Hyperspectral Imaging Systems Market

Hyperspectral Imaging Systems Market Size, Share & Industry Growth Analysis Report by Offering (Cameras, System Integrator, Service Provider), Technology (Pushbroom, Snapshot, Tunable Filter, Imaging FTIR, Whiskbroom), Wavelength and Region - Global Forecast to 2029

Report Code: SE 8995 Apr, 2024, by marketsandmarkets.com

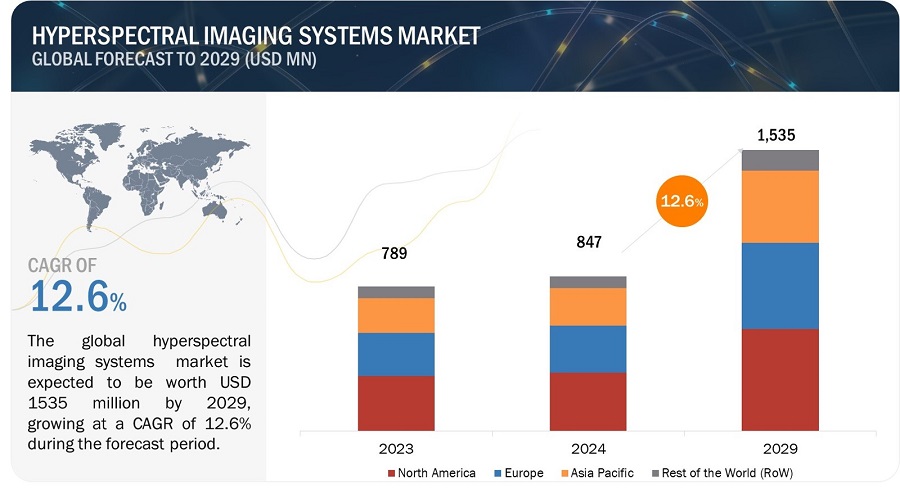
[216 Pages Report] The global hyperspectral imaging systems market Size is expected to be valued at USD 847 million in 2024 and is projected to reach USD 1,535 million by 2029 and growing at a CAGR of 12.6% from 2024 to 2029.

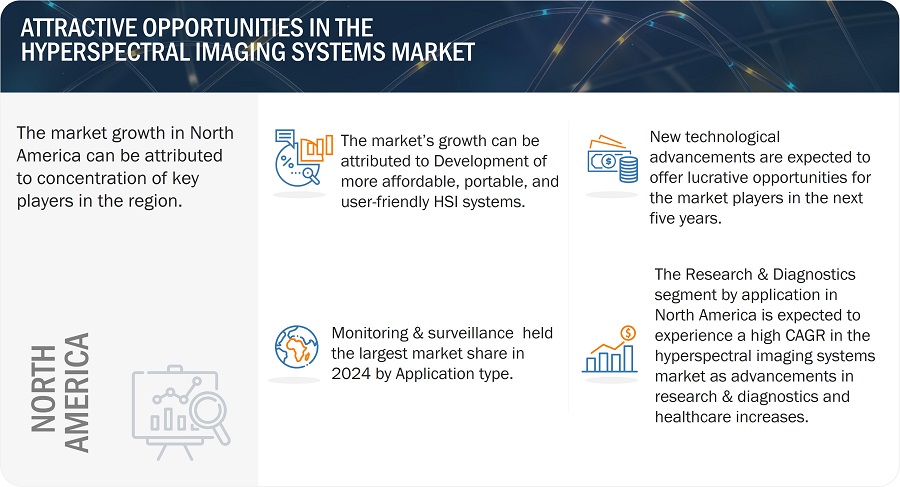
The market is experiencing growth driven by emerging industry applications due to superior spectral and spatial details offered by hyperspectral sensors and the development of more affordable, portable, and user-friendly hyperspectral imaging systems.
Hyperspectral Imaging Systems Market

Hyperspectral Imaging Systems Market

Hyperspectral Imaging Systems Market Forecast to 2029

To know about the assumptions considered for the study, Request for Free Sample Report

Hyperspectral Imaging Systems Market Dynamics

Driver: Emerging applications in industries due to superior spectral and spatial details offered by hyperspectral sensors.

Emerging industry applications benefit from hyperspectral sensors providing superior spatial and spectral details, driving growth in the hyperspectral imaging systems market. These sensors enable precise identification and characterization of materials, improving quality control, resource management, and product development across agriculture, mining, and pharmaceutical sectors. Businesses seek to leverage this advanced technology to gain competitive advantages, enhance decision-making processes, and meet evolving regulatory requirements, thus fueling the demand for hyperspectral imaging systems.

Restraint: Need for specialized expertise

The interpretation and analysis of hyperspectral data require advanced knowledge in remote sensing, image processing, and spectral analysis, which may limit the pool of qualified professionals. Secondly, the complexity of hyperspectral imaging technology necessitates specialized training and skills, leading to higher operational costs for businesses. Additionally, the shortage of experts in this field can hinder the adoption of hyperspectral imaging systems across various industries, slowing market growth.

Opportunity: Growing industry collaboration

Collaborations enable companies to pool resources, expertise, and technologies, leading to the development of more advanced and integrated solutions. This synergy allows for creating tailored products that meet diverse market demands across various sectors, fostering innovation and expanding the adoption of hyperspectral imaging technology. Moreover, strategic partnerships facilitate market expansion, opening up new avenues for growth and establishing stronger footholds in emerging applications and geographic regions.

Challenge: Management and storage of sizeable hyperspectral imagery datasets and high-resolution maps

The sheer volume of data these hyperspectral imaging systems generate requires significant storage capacity and efficient data management solutions. Additionally, processing and analyzing such extensive datasets require advanced computational resources and expertise, which can be costly and time-consuming for businesses. Moreover, ensuring data integrity, security, and accessibility further compounds the challenge, necessitating the development of robust infrastructure and software solutions to address these complexities.

Hyperspectral Imaging Systems Market Ecosystem

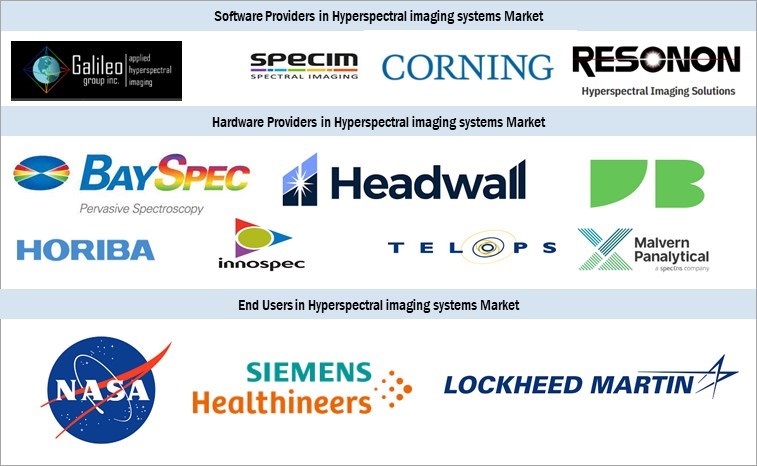
Leading players in the market include HORIBA (Japan), Resonon Inc. (US), Bayspec, INC. (US), SPECIM, SPECTRAL IMAGING LTD. (Finland), Malvern Panalytical Ltd  (UK) and many more.
Hyperspectral Imaging Systems Market by Ecosystem

Hyperspectral imaging systems market for the camera segment by offering to exhibit the highest CAGR during the forecast period.

Cameras offer precise spectral data, enabling enhanced detection and identification capabilities crucial for applications like agriculture, mineral exploration, and healthcare diagnostics. Moreover, advancements in technology have led to more compact and affordable hyperspectral cameras, making them accessible to a broader range of businesses and driving their adoption for diverse uses, thereby fueling market growth.

Pushbroom/Line Scan by technology is estimated to account for the largest market share during the forecast period.

The growth of pushbroom/ line scan by technology in the hyperspectral imaging systems market, with the highest market share during the forecast period, can be attributed to rapid growth due to its efficiency and effectiveness in capturing continuous spectral data along a linear path. Unlike other technologies, push broom technology cameras can swiftly cover larger areas with high resolution, making them ideal for applications such as agriculture, environmental monitoring, and infrastructure inspection. Additionally, their streamlined design and reduced complexity result in lower costs and more excellent reliability, further driving their adoption in various industries seeking advanced imaging solutions.

LWIR (Long wave infrared) by wavelength exhibits the highest CAGR in the hyperspectral imaging systems market.

With the increasing emphasis on safety, security, and efficiency, LWIR cameras offer unparalleled capabilities in detecting heat signatures and identifying potential hazards in various industries like surveillance, defense, and automotive. Furthermore, advancements in LWIR technology are driving down costs and enhancing performance, making these cameras more accessible and attractive to a broader range of businesses.

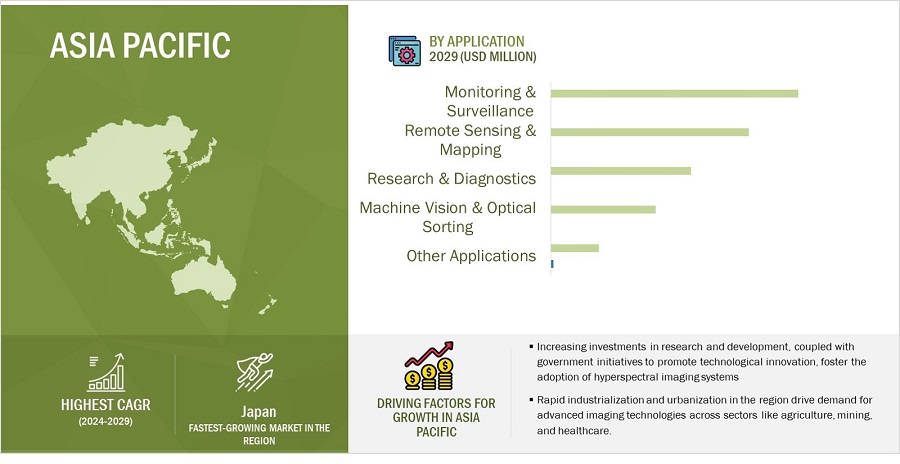
Hyperspectral Imaging Systems market for Asia Pacific region to hold the largest CAGR during the forecast period.

Rapid industrialization and urbanization in the region drive demand for advanced imaging technologies across agriculture, mining, and healthcare sectors. Additionally, increasing investments in research and development and government initiatives to promote technological innovation fosters the adoption of hyperspectral imaging systems. Moreover, the growing awareness of the benefits of hyperspectral imaging for precision agriculture, environmental monitoring, and infrastructure development further fuels market growth in Asia Pacific.
Hyperspectral Imaging Systems Market by Region

Hyperspectral Imaging Systems Market by Region

To know about the assumptions considered for the study, download the pdf brochure

Key Market Players

The hyperspectral imaging systems companies is dominated by players such as Specim - Hyperspectral imaging cameras and systems (Finland), Corning | Corning.com (US), Welcome to HORIBA (Japan), resonon.com (US), BaySpec (US) and many more.

Get online access to the report on the World's First Market Intelligence Cloud

  • Easy to Download Historical Data & Forecast Numbers
  • Company Analysis Dashboard for high growth potential opportunities
  • Research Analyst Access for customization & queries
  • Competitor Analysis with Interactive dashboard
  • Latest News, Updates & Trend analysis
Request Sample

Scope of the Report

Report Metric

Details

Estimated Market Size USD 847 million in 2024 
Projected Market Size USD 1,535 million by 2029
Hyperspectral Imaging Systems Market Growth CAGR of 12.6%

Market size available for years

2020-2029

Base year considered

2023

Forecast period

2024-2029

Forecast units

Value (USD Million/Billion)

Segments Covered

By Offering; By Technology; By Wavelength; By Application and Region.

Geographies covered

North America, Europe, Asia Pacific, and Rest of the world (RoW)

Companies covered

The major market players include Corning Incorporated (US), SPECIM, SPECTRAL IMAGING LTD.  (Finland), Malvern Panalytical Ltd (UK), HORIBA (Japan),  Resonon Inc. (US), Norsk Elektro Optikk (Norway), Telops Inc. (Norway), Headwall Photonics (US), Bayspec, INC. (US), Cubert GmbH (Germany) and many more.
(A total of 25 players are profiled)

Hyperspectral Imaging Systems Market Highlights

The study categorizes the hyperspectral imaging systems market based on the following segments:

Segment

Subsegment

By Offering

  • Cameras
  • Services

By Technology

  • Pushborrm/Line scan
  • Snapshot
  • Other technologies

By Wavelength

  • Visible & near wave infrared (NIR)
  • Short wave infrared (SWIR)
  • Mid wave infrared (MWIR)
  • Long wave infrared (LWIR)

By Application

  • Monitoring & Surveillance
  • Remote Sensing and Mapping (Agriculture, Mining, Environmental Monitoring and other Remote Sensing Applications, which include Forensics, Cosmetics, Document Preservation, and Infrastructure Evaluation)
  • Machine Vision & Optical Sorting
  • Research & Diagnostics
  • Other applications (Colorimetry, Meteorology, Thin-film Manufacturing)

By Region

  • North America
  • Europe
  • Asia Pacific
  • RoW

Recent Developments

  • In January 2024, SPECIM, SPECTRAL IMAGING LTD. (Finland) Announced a new product, Specim FX120. The Specim FX120 is a long-wave infrared hyperspectral camera offering a full spectral range of 7.7 to 12.3 µm. This fast push-broom thermal camera is poised to revolutionize chemical imaging in tough conditions, day or night.
  • In October 2023 Corning Incorporated (US) collaborated with Orbital Sidekick (US). Orbital Sidekick is a startup that provides hyperspectral satellite monitoring solutions. The company has launched six satellites, each of which is equipped with a Corning hyperspectral imaging sensor.
  • In January 2021, HORIBA France SAS (France) collaborated with GreenTropism SAS (France). The partnership between the two companies will integrate their technologies to create and market intelligent solutions. Customers can access optimized results with automated data interpretation by combining HORIBA's spectroscopic and hyperspectral imaging capabilities with GreenTropism's AI-enhanced data processing methods.

Frequently Asked Questions(FAQs):

To speak to our analyst for a discussion on the above findings, click Speak to Analyst

TABLE OF CONTENTS
 
1 INTRODUCTION (Page No. - 30)
    1.1 STUDY OBJECTIVES 
    1.2 MARKET DEFINITION 
    1.3 STUDY SCOPE 
           1.3.1 MARKETS COVERED
                    FIGURE 1 HYPERSPECTRAL IMAGING SYSTEMS MARKET SEGMENTATION
           1.3.2 REGIONAL SCOPE
           1.3.3 INCLUSIONS AND EXCLUSIONS
           1.3.4 YEARS CONSIDERED
    1.4 CURRENCY CONSIDERED 
    1.5 UNIT CONSIDERED 
    1.6 LIMITATIONS 
    1.7 STAKEHOLDERS 
    1.8 SUMMARY OF CHANGES 
    1.9 RECESSION IMPACT 
 
2 RESEARCH METHODOLOGY (Page No. - 35)
    2.1 RESEARCH DATA 
           FIGURE 2 HYPERSPECTRAL IMAGING SYSTEMS MARKET: RESEARCH DESIGN
           2.1.1 SECONDARY AND PRIMARY RESEARCH
                    FIGURE 3 HYPERSPECTRAL IMAGING SYSTEMS MARKET: RESEARCH APPROACH
           2.1.2 SECONDARY DATA
                    2.1.2.1 List of major secondary sources
                    2.1.2.2 Key data from secondary sources
           2.1.3 PRIMARY DATA
                    2.1.3.1 Intended participants and key opinion leaders in primary interviews
                    2.1.3.2 List of major participants in primary interviews
                    2.1.3.3 Breakdown of primaries
                    2.1.3.4 Key data from primary sources
                    2.1.3.5 Key industry insights
    2.2 MARKET SIZE ESTIMATION METHODOLOGY 
           FIGURE 4 HYPERSPECTRAL IMAGING SYSTEMS MARKET: MARKET SIZE ESTIMATION METHODOLOGY
           2.2.1 BOTTOM-UP APPROACH
                    2.2.1.1 Approach to estimate market size using bottom-up analysis (demand side)
                               FIGURE 5 HYPERSPECTRAL IMAGING SYSTEMS MARKET: BOTTOM-UP APPROACH
           2.2.2 TOP-DOWN APPROACH
                    2.2.2.1 Approach to estimate market size using top-down analysis (supply side)
                               FIGURE 6 HYPERSPECTRAL IMAGING SYSTEMS MARKET: TOP-DOWN APPROACH
                               FIGURE 7 HYPERSPECTRAL IMAGING SYSTEMS MARKET: SUPPLY-SIDE ANALYSIS
    2.3 DATA TRIANGULATION 
           FIGURE 8 HYPERSPECTRAL IMAGING SYSTEMS MARKET: DATA TRIANGULATION
    2.4 RESEARCH ASSUMPTIONS 
           TABLE 1 HYPERSPECTRAL IMAGING SYSTEMS MARKET: RESEARCH ASSUMPTIONS
    2.5 RESEARCH LIMITATIONS 
           FIGURE 9 HYPERSPECTRAL IMAGING SYSTEMS MARKET: RESEARCH LIMITATIONS
    2.6 RISK ASSESSMENT 
           TABLE 2 HYPERSPECTRAL IMAGING SYSTEMS MARKET: RISK ASSESSMENT
    2.7 PARAMETERS CONSIDERED TO ANALYZE IMPACT OF RECESSION ON HYPERSPECTRAL IMAGING SYSTEMS MARKET 
           TABLE 3 HYPERSPECTRAL IMAGING SYSTEMS MARKET: PARAMETERS CONSIDERED TO ANALYZE IMPACT OF RECESSION
 
3 EXECUTIVE SUMMARY (Page No. - 48)
    FIGURE 10 SERVICES SEGMENT TO HOLD LARGER MARKET SHARE IN 2024
    FIGURE 11 VISIBLE & NIR HYPERSPECTRAL IMAGING SYSTEMS TO CAPTURE LARGEST MARKET SHARE IN 2029
    FIGURE 12 RESEARCH & MEDICAL DIAGNOSIS SEGMENT TO EXHIBIT HIGHEST CAGR DURING FORECAST PERIOD
    FIGURE 13 PUSHBROOM/LINE SCAN SEGMENT TO DOMINATE MARKET THROUGHOUT FORECAST PERIOD
    FIGURE 14 NORTH AMERICA TO ACCOUNT FOR LARGEST MARKET SHARE IN 2024
 
4 PREMIUM INSIGHTS (Page No. - 52)
    4.1 ATTRACTIVE OPPORTUNITIES FOR PLAYERS IN HYPERSPECTRAL IMAGING SYSTEMS MARKET 
           FIGURE 15 DEVELOPMENT OF MORE AFFORDABLE, PORTABLE, AND USER-FRIENDLY HYPERSPECTRAL IMAGING SYSTEMS TO BOOST MARKET GROWTH
    4.2 HYPERSPECTRAL IMAGING SYSTEMS MARKET, BY WAVELENGTH 
           FIGURE 16 LWIR SEGMENT TO REGISTER HIGHEST CAGR IN HYPERSPECTRAL IMAGING SYSTEMS MARKET, BY WAVELENGTH, DURING FORECAST PERIOD
    4.3 HYPERSPECTRAL IMAGING SYSTEMS MARKET, BY APPLICATION 
           FIGURE 17 MONITORING & SURVEILLANCE APPLICATIONS TO LEAD MARKET IN 2029
    4.4 HYPERSPECTRAL IMAGING SYSTEMS MARKET, BY TECHNOLOGY 
           FIGURE 18 PUSHBROOM/LINE SCAN TECHNOLOGY TO DOMINATE MARKET THROUGHOUT FORECAST PERIOD
    4.5 HYPERSPECTRAL IMAGING SYSTEMS MARKET IN NORTH AMERICA, BY APPLICATION AND COUNTRY 
           FIGURE 19 MONITORING & SURVEILLANCE SEGMENT AND US HELD LARGEST SHARES OF NORTH AMERICAN MARKET IN 2023
    4.6 HYPERSPECTRAL IMAGING SYSTEMS MARKET, BY COUNTRY 
           FIGURE 20 JAPAN TO EXHIBIT HIGHEST CAGR IN GLOBAL HYPERSPECTRAL IMAGING SYSTEMS MARKET DURING FORECAST PERIOD
 
5 MARKET OVERVIEW (Page No. - 55)
    5.1 INTRODUCTION 
    5.2 MARKET DYNAMICS 
           FIGURE 21 HYPERSPECTRAL IMAGING SYSTEMS MARKET: DRIVERS, RESTRAINTS, OPPORTUNITIES, AND CHALLENGES
           5.2.1 DRIVERS
                    FIGURE 22 HYPERSPECTRAL IMAGING SYSTEMS MARKET: IMPACT ANALYSIS OF DRIVERS
                    5.2.1.1 Significant demand for hyperspectral imaging from diverse industries
                    5.2.1.2 Development of affordable, portable, and user-friendly hyperspectral imaging systems
                    5.2.1.3 Increasing funding for R&D to enhance analytical ability of hyperspectral imaging products
           5.2.2 RESTRAINTS
                    FIGURE 23 HYPERSPECTRAL IMAGING SYSTEMS MARKET: IMPACT ANALYSIS OF RESTRAINTS
                    5.2.2.1 Need for specialized expertise to navigate complexities of hyperspectral imaging technology
                    5.2.2.2 Lack of standardized data formats and processing methods
                    5.2.2.3 Stringent government regulations about geospatial imagery and mapping data management
           5.2.3 OPPORTUNITIES
                    FIGURE 24 HYPERSPECTRAL IMAGING SYSTEMS MARKET: IMPACT ANALYSIS OF OPPORTUNITIES
                    5.2.3.1 Ongoing miniaturization of sensors enabling deployment in handheld and airborne platforms
                    5.2.3.2 Collaborations among industry players
           5.2.4 CHALLENGES
                    FIGURE 25 HYPERSPECTRAL IMAGING SYSTEMS MARKET: IMPACT ANALYSIS OF CHALLENGES
                    5.2.4.1 Management and storage of large hyperspectral imagery datasets and high-resolution maps
    5.3 SUPPLY CHAIN ANALYSIS 
           FIGURE 26 HYPERSPECTRAL IMAGING SYSTEMS MARKET: SUPPLY CHAIN ANALYSIS
    5.4 ECOSYSTEM ANALYSIS 
           FIGURE 27 KEY PLAYERS IN ECOSYSTEM
           TABLE 4 ROLE OF PLAYERS IN ECOSYSTEM
    5.5 TRENDS/DISRUPTIONS IMPACTING CUSTOMER BUSINESS 
           FIGURE 28 TRENDS/DISRUPTIONS INFLUENCING CUSTOMER BUSINESS
    5.6 PRICING ANALYSIS 
           5.6.1 INDICATIVE PRICING TREND OF HYPERSPECTRAL CAMERAS, BY KEY PLAYER
                    FIGURE 29 INDICATIVE PRICING TREND OF HYPERSPECTRAL CAMERAS OFFERED BY KEY PLAYERS, 2023 (USD)
                    TABLE 5 INDICATIVE PRICING TREND OF HYPERSPECTRAL CAMERAS OFFERED BY KEY PLAYERS, 2023 (USD THOUSAND)
           5.6.2 AVERAGE SELLING PRICE TREND OF HYPERSPECTRAL CAMERAS, BY WAVELENGTH
                    FIGURE 30 AVERAGE SELLING PRICE TREND OF HYPERSPECTRAL CAMERAS, BY WAVELENGTH, 2020–2023 (USD THOUSAND)
           5.6.3 AVERAGE SELLING PRICE TREND, BY REGION
                    FIGURE 31 AVERAGE SELLING PRICE TREND OF HYPERSPECTRAL CAMERAS, BY REGION, 2020–2024 (USD THOUSAND)
    5.7 TECHNOLOGY ANALYSIS 
           5.7.1 KEY TECHNOLOGY
                    5.7.1.1 Hyperspectral cameras with higher spatial and spectral resolution
                    5.7.1.2 Advanced sensors and optics for spectral range expansion in hyperspectral imaging systems
                    5.7.1.3 Long-wave infrared (LWIR) sensors in hyperspectral imaging systems
           5.7.2 COMPLEMENTARY TECHNOLOGY
                    5.7.2.1 Integration of cloud computing, artificial intelligence, machine learning, and deep learning in hyperspectral imaging systems
                    5.7.2.2 Enhanced signal processing methods in hyperspectral imaging
           5.7.3 ADJACENT TECHNOLOGY
                    5.7.3.1 Advanced spectral unmixing techniques in hyperspectral imaging
    5.8 PORTER’S FIVE FORCES ANALYSIS 
           TABLE 6 HYPERSPECTRAL IMAGING SYSTEMS MARKET: PORTER’S FIVE FORCES ANALYSIS
           FIGURE 32 HYPERSPECTRAL IMAGING SYSTEMS MARKET: PORTER’S FIVE FORCES ANALYSIS
           5.8.1 THREAT OF NEW ENTRANTS
           5.8.2 THREAT OF SUBSTITUTES
           5.8.3 BARGAINING POWER OF SUPPLIERS
           5.8.4 BARGAINING POWER OF BUYERS
           5.8.5 INTENSITY OF COMPETITIVE RIVALRY
    5.9 KEY STAKEHOLDERS AND BUYING CRITERIA 
           5.9.1 KEY STAKEHOLDERS IN BUYING PROCESS
                    FIGURE 33 KEY STAKEHOLDERS IN BUYING PROCESS FOR TOP 3 APPLICATIONS
                    TABLE 7 INFLUENCE OF STAKEHOLDERS ON BUYING PROCESS FOR TOP 3 APPLICATIONS
           5.9.2 BUYING CRITERIA
                    FIGURE 34 KEY BUYING CRITERIA FOR TOP 3 APPLICATIONS
                    TABLE 8 KEY BUYING CRITERIA FOR TOP 3 APPLICATIONS
    5.10 CASE STUDY ANALYSIS 
           5.10.1 WASTE ROBOTICS ADOPTED SPECIM ONE HYPERSPECTRAL IMAGING PLATFORM OFFERED BY SPECIM TO ADDRESS WASTE MANAGEMENT CHALLENGES
           5.10.2 ORBITAL SIDEKICK INTEGRATED CORNING’S HYPERSPECTRAL IMAGING SENSORS INTO ITS GHOST CONSTELLATION TO DETECT GREENHOUSE GAS LEAKS AND OTHER ENVIRONMENTAL THREATS
           5.10.3 AGRICOLA MODERNA IMPLEMENTED SPECIM’S FX10E PRODUCT TO MAXIMIZE EFFICIENCY OF FARMING OPERATIONS
           5.10.4 INTEGRATION OF HYPERMED'S HYPERVIEW SYSTEM INTO SURGICAL AND WOUND HEALING DIAGNOSTIC TOOLS TO ASSESS MICROCIRCULATORY PERFORMANCE AND OXYGEN DELIVERY
    5.11 INVESTMENT AND FUNDING SCENARIO 
           FIGURE 35 FUNDS RAISED BY PIXXEL—STARTUP IN HYPERSPECTRAL IMAGING SYSTEMS MARKET
    5.12 TRADE ANALYSIS 
           5.12.1 IMPORT SCENARIO (HS CODE 902730)
                    TABLE 9 IMPORT SCENARIO FOR HS CODE 902730, BY COUNTRY, 2018–2022 (USD THOUSAND)
                    FIGURE 36 IMPORT DATA FOR HS CODE 902730, BY COUNTRY, 2018–2022 (USD THOUSAND)
           5.12.2 EXPORT SCENARIO (HS CODE 902730)
                    TABLE 10 EXPORT SCENARIO FOR HS CODE 902730, BY COUNTRY, 2018–2022 (USD THOUSAND)
                    FIGURE 37 EXPORT DATA FOR HS CODE 902730, BY COUNTRY, 2018–2022 (USD THOUSAND)
    5.13 PATENT ANALYSIS 
           TABLE 11 HYPERSPECTRAL IMAGING SYSTEMS MARKET: LIST OF PATENTS, 2022–2023
           FIGURE 38 NUMBER OF PATENTS GRANTED AND APPLIED, 2013–2023
    5.14 KEY CONFERENCES AND EVENTS 
           TABLE 12 HYPERSPECTRAL IMAGING SYSTEMS MARKET: KEY CONFERENCES AND EVENTS, 2024–2025
    5.15 REGULATORY LANDSCAPE 
           5.15.1 REGULATORY BODIES, GOVERNMENT AGENCIES, AND OTHER ORGANIZATIONS
                    TABLE 13 NORTH AMERICA: LIST OF REGULATORY BODIES, GOVERNMENT AGENCIES, AND OTHER ORGANIZATIONS
                    TABLE 14 EUROPE: LIST OF REGULATORY BODIES, GOVERNMENT AGENCIES, AND OTHER ORGANIZATIONS
                    TABLE 15 ASIA PACIFIC: LIST OF REGULATORY BODIES, GOVERNMENT AGENCIES, AND OTHER ORGANIZATIONS
                    TABLE 16 ROW: LIST OF REGULATORY BODIES, GOVERNMENT AGENCIES, AND OTHER ORGANIZATIONS
           5.15.2 STANDARDS AND REGULATIONS
 
6 HYPERSPECTRAL IMAGING SYSTEMS MARKET, BY OFFERING (Page No. - 90)
    6.1 INTRODUCTION 
           FIGURE 39 HYPERSPECTRAL IMAGING SYSTEMS MARKET, BY OFFERING
           FIGURE 40 HYPERSPECTRAL IMAGING SYSTEMS MARKET FOR CAMERAS, 2020–2029 (UNITS)
           TABLE 17 HYPERSPECTRAL IMAGING SYSTEMS MARKET FOR CAMERAS, 2020–2023 (UNITS)
           TABLE 18 HYPERSPECTRAL IMAGING SYSTEMS MARKET FOR CAMERAS, 2024–2029 (UNITS)
           FIGURE 41 CAMERAS TO REGISTER HIGHER CAGR IN HYPERSPECTRAL IMAGING SYSTEMS MARKET, BY OFFERING, DURING FORECAST PERIOD
           TABLE 19 OFFERING: HYPERSPECTRAL IMAGING SYSTEMS MARKET, 2020–2023 (USD MILLION)
           TABLE 20 OFFERING: HYPERSPECTRAL IMAGING SYSTEMS MARKET, 2024–2029 (USD MILLION)
    6.2 CAMERAS 
           6.2.1 RISING FOCUS OF INDUSTRIES ON REGULATORY COMPLIANCE AND PRODUCT INNOVATION TO DRIVE MARKET
                    TABLE 21 CAMERAS: HYPERSPECTRAL IMAGING SYSTEMS MARKET, BY REGION, 2020–2023 (USD MILLION)
                    TABLE 22 CAMERAS: HYPERSPECTRAL IMAGING SYSTEMS MARKET, BY REGION, 2024–2029 (USD MILLION)
    6.3 SERVICES 
           6.3.1 NEED FOR TAILORED HYPERSPECTRAL SOLUTIONS TO FUEL SEGMENTAL GROWTH
                    TABLE 23 SERVICES: HYPERSPECTRAL IMAGING SYSTEMS MARKET, BY REGION, 2020–2023 (USD MILLION)
                    TABLE 24 SERVICES: HYPERSPECTRAL IMAGING SYSTEMS MARKET, BY REGION, 2024–2029 (USD MILLION)
 
7 HYPERSPECTRAL IMAGING SYSTEMS MARKET, BY WAVELENGTH (Page No. - 97)
    7.1 INTRODUCTION 
           FIGURE 42 LWIR SEGMENT TO REGISTER HIGHEST CAGR IN HYPERSPECTRAL IMAGING SYSTEMS MARKET DURING FORECAST PERIOD
           TABLE 25 HYPERSPECTRAL IMAGING SYSTEMS MARKET, BY WAVELENGTH, 2020–2023 (USD MILLION)
           TABLE 26 HYPERSPECTRAL IMAGING SYSTEMS MARKET, BY WAVELENGTH, 2024–2029 (USD MILLION)
    7.2 VISIBLE & NIR 
           7.2.1 SURGING NEED TO IDENTIFY DIFFERENCES IN MATERIALS, DETECT ANOMALIES, AND ASSESS BIOCHEMICAL PROPERTIES WITH HIGHER PRECISION AND ACCURACY TO FUEL SEGMENTAL GROWTH
                    TABLE 27 VISIBLE & NIR: HYPERSPECTRAL IMAGING SYSTEMS MARKET, BY TECHNOLOGY, 2020–2023 (USD MILLION)
                    TABLE 28 VISIBLE & NIR: HYPERSPECTRAL IMAGING SYSTEMS MARKET, BY TECHNOLOGY, 2024–2029 (USD MILLION)
    7.3 SWIR 
           7.3.1 GROWING ADOPTION IN SECURITY & SURVEILLANCE APPLICATIONS TO FOSTER SEGMENTAL GROWTH
                    TABLE 29 SWIR: HYPERSPECTRAL IMAGING SYSTEMS MARKET, BY TECHNOLOGY, 2020–2023 (USD MILLION)
                    TABLE 30 SWIR: HYPERSPECTRAL IMAGING SYSTEMS MARKET, BY TECHNOLOGY, 2024–2029 (USD MILLION)
    7.4 MWIR 
           7.4.1 RISING USE IN THERMAL EMISSION DETECTION AND INDUSTRIAL INSPECTIONS TO SUPPORT SEGMENTAL GROWTH
                    TABLE 31 MWIR: HYPERSPECTRAL IMAGING SYSTEMS MARKET, BY TECHNOLOGY, 2020–2023 (USD MILLION)
                    TABLE 32 MWIR: HYPERSPECTRAL IMAGING SYSTEMS MARKET, BY TECHNOLOGY, 2024–2029 (USD MILLION)
    7.5 LWIR 
           7.5.1 INCREASING DEPLOYMENT IN UAVS AND SATELLITES TO ACCELERATE SEGMENTAL GROWTH
                    TABLE 33 LWIR: HYPERSPECTRAL IMAGING SYSTEMS MARKET, BY TECHNOLOGY, 2020–2023 (USD MILLION)
                    TABLE 34 LWIR: HYPERSPECTRAL IMAGING SYSTEMS MARKET, BY TECHNOLOGY, 2024–2029 (USD MILLION)
 
8 HYPERSPECTRAL IMAGING SYSTEMS MARKET, BY TECHNOLOGY (Page No. - 104)
    8.1 INTRODUCTION 
           FIGURE 43 SNAPSHOT TECHNOLOGY TO REGISTER HIGHEST CAGR IN HYPERSPECTRAL IMAGING SYSTEMS MARKET DURING FORECAST PERIOD
           TABLE 35 HYPERSPECTRAL IMAGING SYSTEMS MARKET, BY TECHNOLOGY, 2020–2023 (USD MILLION)
           TABLE 36 HYPERSPECTRAL IMAGING SYSTEMS MARKET, BY TECHNOLOGY, 2024–2029 (USD MILLION)
    8.2 PUSHBROOM/LINE SCAN 
           8.2.1 PRECISION AGRICULTURE, GEOLOGICAL SURVEYING, AND OCEANOGRAPHY APPLICATIONS TO CONTRIBUTE TO MARKET GROWTH
                    TABLE 37 PUSHBROOM/LINE SCAN: HYPERSPECTRAL IMAGING SYSTEMS MARKET, BY WAVELENGTH, 2020–2023 (USD MILLION)
                    TABLE 38 PUSHBROOM/LINE SCAN: HYPERSPECTRAL IMAGING SYSTEMS MARKET, BY WAVELENGTH, 2024–2029 (USD MILLION)
                    TABLE 39 PUSHBROOM/LINE SCAN: HYPERSPECTRAL IMAGING SYSTEMS MARKET, BY REGION, 2020–2023 (USD MILLION)
                    TABLE 40 PUSHBROOM/LINE SCAN: HYPERSPECTRAL IMAGING SYSTEMS MARKET, BY REGION, 2024–2029 (USD MILLION)
    8.3 SNAPSHOT 
           8.3.1 MEDICAL DIAGNOSTICS, MOBILE DEVICES, AND ENVIRONMENTAL MONITORING APPLICATIONS TO DRIVE MARKET
                    TABLE 41 SNAPSHOT: HYPERSPECTRAL IMAGING SYSTEMS MARKET, BY WAVELENGTH, 2020–2023 (USD MILLION)
                    TABLE 42 SNAPSHOT: HYPERSPECTRAL IMAGING SYSTEMS MARKET, BY WAVELENGTH, 2024–2029 (USD MILLION)
                    TABLE 43 SNAPSHOT: HYPERSPECTRAL IMAGING SYSTEMS MARKET, BY REGION, 2020–2023 (USD MILLION)
                    TABLE 44 SNAPSHOT: HYPERSPECTRAL IMAGING SYSTEMS MARKET, BY REGION, 2024–2029 (USD MILLION)
    8.4 OTHER TECHNOLOGIES 
           TABLE 45 OTHER TECHNOLOGIES: HYPERSPECTRAL IMAGING SYSTEMS MARKET, BY WAVELENGTH, 2020–2023 (USD MILLION)
           TABLE 46 OTHER TECHNOLOGIES: HYPERSPECTRAL IMAGING SYSTEMS MARKET, BY WAVELENGTH, 2024–2029 (USD MILLION)
           TABLE 47 OTHER TECHNOLOGIES: HYPERSPECTRAL IMAGING SYSTEMS MARKET, BY REGION, 2020–2023 (USD MILLION)
           TABLE 48 OTHER TECHNOLOGIES: HYPERSPECTRAL IMAGING SYSTEMS MARKET, BY REGION, 2024–2029 (USD MILLION)
 
9 HYPERSPECTRAL IMAGING SYSTEMS MARKET, BY APPLICATION (Page No. - 112)
    9.1 INTRODUCTION 
           FIGURE 44 RESEARCH & MEDICAL DIAGNOSIS SEGMENT TO REGISTER HIGHEST CAGR IN HYPERSPECTRAL IMAGING SYSTEMS MARKET DURING FORECAST PERIOD
           TABLE 49 HYPERSPECTRAL IMAGING SYSTEMS MARKET, BY APPLICATION, 2020–2023 (USD MILLION)
           TABLE 50 HYPERSPECTRAL IMAGING SYSTEMS MARKET, BY APPLICATION, 2024–2029 (USD MILLION)
    9.2 MONITORING & SURVEILLANCE 
           9.2.1 GROWING DEMAND FOR SECURITY & SURVEILLANCE SOLUTIONS FROM GOVERNMENT ENTITIES TO DRIVE MARKET
                    TABLE 51 MONITORING & SURVEILLANCE: HYPERSPECTRAL IMAGING SYSTEMS MARKET, BY REGION, 2020–2023 (USD MILLION)
                    TABLE 52 MONITORING & SURVEILLANCE: HYPERSPECTRAL IMAGING SYSTEMS MARKET, BY REGION, 2024–2029 (USD MILLION)
    9.3 REMOTE SENSING & MAPPING 
           TABLE 53 REMOTE SENSING & MAPPING: HYPERSPECTRAL IMAGING SYSTEMS MARKET, BY REGION, 2020–2023 (USD MILLION)
           TABLE 54 REMOTE SENSING & MAPPING: HYPERSPECTRAL IMAGING SYSTEMS MARKET, BY REGION, 2024–2029 (USD MILLION)
           TABLE 55 REMOTE SENSING & MAPPING: HYPERSPECTRAL IMAGING SYSTEMS MARKET, BY TYPE, 2020–2023 (USD MILLION)
           TABLE 56 REMOTE SENSING & MAPPING: HYPERSPECTRAL IMAGING SYSTEMS MARKET, BY TYPE, 2024–2029 (USD MILLION)
           9.3.1 AGRICULTURE
                    9.3.1.1 Rising adoption of precision agricultural practices to boost demand
                               TABLE 57 AGRICULTURE: HYPERSPECTRAL IMAGING SYSTEMS MARKET, BY REGION, 2020–2023 (USD MILLION)
                               TABLE 58 AGRICULTURE: HYPERSPECTRAL IMAGING SYSTEMS MARKET, BY REGION, 2024–2029 (USD MILLION)
           9.3.2 MINING
                    9.3.2.1 Increasing use of hyperspectral imaging technology in oil and mineral exploration to foster market growth
                               TABLE 59 MINING: HYPERSPECTRAL IMAGING SYSTEMS MARKET, BY REGION, 2020–2023 (USD MILLION)
                               TABLE 60 MINING: HYPERSPECTRAL IMAGING SYSTEMS MARKET, BY REGION, 2024–2029 (USD MILLION)
           9.3.3 ENVIRONMENTAL MONITORING
                    9.3.3.1 Increasing environmental awareness to contribute to market growth
                               TABLE 61 ENVIRONMENTAL MONITORING: HYPERSPECTRAL IMAGING SYSTEMS MARKET, BY REGION, 2020–2023 (USD MILLION)
                               TABLE 62 ENVIRONMENTAL MONITORING: HYPERSPECTRAL IMAGING SYSTEMS MARKET, BY REGION, 2024–2029 (USD MILLION)
           9.3.4 OTHER REMOTE SENSING & MAPPING APPLICATIONS
                    TABLE 63 OTHER REMOTE SENSING & MAPPING APPLICATIONS: HYPERSPECTRAL IMAGING SYSTEMS MARKET, BY REGION, 2020–2023 (USD MILLION)
                    TABLE 64 OTHER REMOTE SENSING & MAPPING APPLICATIONS: HYPERSPECTRAL IMAGING SYSTEMS MARKET, BY REGION, 2024–2029 (USD MILLION)
    9.4 MACHINE VISION & OPTICAL SORTING 
           9.4.1 GROWING DEMAND FOR MACHINE VISION TECHNOLOGY BY SEMICONDUCTOR MANUFACTURERS TO SUPPORT MARKET GROWTH
                    TABLE 65 MACHINE VISION & OPTICAL SORTING: HYPERSPECTRAL IMAGING SYSTEMS MARKET, BY REGION, 2020–2023 (USD MILLION)
                    TABLE 66 MACHINE VISION & OPTICAL SORTING: HYPERSPECTRAL IMAGING SYSTEMS MARKET, BY REGION, 2024–2029 (USD MILLION)
    9.5 RESEARCH & MEDICAL DIAGNOSIS 
             9.5.1 STRONG FOCUS ON PRECISE DIAGNOSIS AND DRUG DEVELOPMENT TO STIMULATE MARKET GROWTH
                    TABLE 67 RESEARCH & MEDICAL DIAGNOSIS: HYPERSPECTRAL IMAGING SYSTEMS MARKET, BY REGION, 2020–2023 (USD MILLION)
                    TABLE 68 RESEARCH & MEDICAL DIAGNOSIS: HYPERSPECTRAL IMAGING SYSTEMS MARKET, BY REGION, 2024–2029 (USD MILLION)
    9.6 OTHER APPLICATIONS 
           TABLE 69 OTHER APPLICATIONS: HYPERSPECTRAL IMAGING SYSTEMS MARKET, BY REGION, 2020–2023 (USD MILLION)
           TABLE 70 OTHER APPLICATIONS: HYPERSPECTRAL IMAGING SYSTEMS MARKET, BY REGION, 2024–2029 (USD MILLION)
 
10 HYPERSPECTRAL IMAGING SYSTEMS MARKET, BY REGION (Page No. - 126)
     10.1 INTRODUCTION 
             FIGURE 45 REGIONAL SPLIT OF HYPERSPECTRAL IMAGING SYSTEMS MARKET
             FIGURE 46 HYPERSPECTRAL IMAGING SYSTEMS MARKET IN ASIA PACIFIC TO GROW AT HIGHEST CAGR FROM 2024 TO 2029
             TABLE 71 HYPERSPECTRAL IMAGING SYSTEMS MARKET: BY REGION, 2020–2023 (USD MILLION)
             TABLE 72 HYPERSPECTRAL IMAGING SYSTEMS MARKET: BY REGION, 2024–2029 (USD MILLION)
     10.2 NORTH AMERICA 
             FIGURE 47 NORTH AMERICA: HYPERSPECTRAL IMAGING SYSTEMS MARKET SNAPSHOT
             TABLE 73 NORTH AMERICA: HYPERSPECTRAL IMAGING SYSTEMS MARKET, BY OFFERING, 2020–2023 (USD MILLION)
             TABLE 74 NORTH AMERICA: HYPERSPECTRAL IMAGING SYSTEMS MARKET, BY OFFERING, 2024–2029 (USD MILLION)
             TABLE 75 NORTH AMERICA: HYPERSPECTRAL IMAGING SYSTEMS MARKET, BY TECHNOLOGY, 2020–2023 (USD MILLION)
             TABLE 76 NORTH AMERICA: HYPERSPECTRAL IMAGING SYSTEMS MARKET, BY TECHNOLOGY, 2024–2029 (USD MILLION)
             TABLE 77 NORTH AMERICA: HYPERSPECTRAL IMAGING SYSTEMS MARKET, BY APPLICATION, 2020–2023 (USD MILLION)
             TABLE 78 NORTH AMERICA: HYPERSPECTRAL IMAGING SYSTEMS MARKET, BY APPLICATION, 2024–2029 (USD MILLION)
             TABLE 79 NORTH AMERICA: HYPERSPECTRAL IMAGING SYSTEMS MARKET FOR REMOTE SENSING & MAPPING APPLICATIONS, BY TYPE, 2020–2023 (USD MILLION)
             TABLE 80 NORTH AMERICA: HYPERSPECTRAL IMAGING SYSTEMS MARKET FOR REMOTE SENSING & MAPPING APPLICATIONS, BY TYPE, 2024–2029 (USD MILLION)
             TABLE 81 NORTH AMERICA: HYPERSPECTRAL IMAGING SYSTEMS MARKET, BY COUNTRY, 2020–2023 (USD MILLION)
             TABLE 82 NORTH AMERICA: HYPERSPECTRAL IMAGING SYSTEMS MARKET, BY COUNTRY, 2024–2029 (USD MILLION)
             10.2.1 NORTH AMERICA: RECESSION IMPACT
             10.2.2 US
                        10.2.2.1 Collaborations between hyperspectral imaging technology providers and government/private organizations to accelerate market growth
             10.2.3 CANADA
                        10.2.3.1 Government policies encouraging innovation and commercialization of hyperspectral imaging technology to drive market
             10.2.4 MEXICO
                        10.2.4.1 Increased use of hyperspectral imaging technology in agriculture and geology to drive market
     10.3 EUROPE 
             FIGURE 48 EUROPE: HYPERSPECTRAL IMAGING SYSTEMS MARKET SNAPSHOT
             TABLE 83 EUROPE: HYPERSPECTRAL IMAGING SYSTEMS MARKET, BY OFFERING, 2020–2023 (USD MILLION)
             TABLE 84 EUROPE: HYPERSPECTRAL IMAGING SYSTEMS MARKET, BY OFFERING, 2024–2029 (USD MILLION)
             TABLE 85 EUROPE: HYPERSPECTRAL IMAGING SYSTEMS MARKET, BY TECHNOLOGY, 2020–2023 (USD MILLION)
             TABLE 86 EUROPE: HYPERSPECTRAL IMAGING SYSTEMS MARKET, BY TECHNOLOGY, 2024–2029 (USD MILLION)
             TABLE 87 EUROPE: HYPERSPECTRAL IMAGING SYSTEMS MARKET, BY APPLICATION, 2020–2023 (USD MILLION)
             TABLE 88 EUROPE: HYPERSPECTRAL IMAGING SYSTEMS MARKET, BY APPLICATION, 2024–2029 (USD MILLION)
             TABLE 89 EUROPE: HYPERSPECTRAL IMAGING SYSTEMS MARKET FOR REMOTE SENSING & MAPPING, BY TYPE, 2020–2023 (USD MILLION)
             TABLE 90 EUROPE: HYPERSPECTRAL IMAGING SYSTEMS MARKET FOR REMOTE SENSING & MAPPING, BY TYPE, 2024–2029 (USD MILLION)
             TABLE 91 EUROPE: HYPERSPECTRAL IMAGING SYSTEMS MARKET, BY COUNTRY, 2020–2023 (USD MILLION)
             TABLE 92 EUROPE: HYPERSPECTRAL IMAGING SYSTEMS MARKET, BY COUNTRY, 2024–2029 (USD MILLION)
             10.3.1 EUROPE: RECESSION IMPACT
             10.3.2 GERMANY
                        10.3.2.1 Friendly policy framework and R&D funding by government to create opportunities for hyperspectral imaging technology providers
             10.3.3 FRANCE
                        10.3.3.1 Growing interest in environmental monitoring and precision farming to boost demand
             10.3.4 UK
                        10.3.4.1 Technology advances and research activities to create potential for hyperspectral imaging technology in newer applications
             10.3.5 ITALY
                        10.3.5.1 Implementation of hyperspectral sensors for remote sensing and land vegetation to drive market
             10.3.6 SPAIN
                        10.3.6.1 Significant focus on reducing textile waste to stimulate hyperspectral imaging technology demand
             10.3.7 REST OF EUROPE
     10.4 ASIA PACIFIC 
             FIGURE 49 ASIA PACIFIC: HYPERSPECTRAL IMAGING SYSTEMS MARKET SNAPSHOT
             TABLE 93 ASIA PACIFIC: HYPERSPECTRAL IMAGING SYSTEMS MARKET, BY OFFERING, 2020–2023 (USD MILLION)
             TABLE 94 ASIA PACIFIC: HYPERSPECTRAL IMAGING SYSTEMS MARKET, BY OFFERING, 2024–2029 (USD MILLION)
             TABLE 95 ASIA PACIFIC: HYPERSPECTRAL IMAGING SYSTEMS MARKET, BY TECHNOLOGY, 2020–2023 (USD MILLION)
             TABLE 96 ASIA PACIFIC: HYPERSPECTRAL IMAGING SYSTEMS MARKET, BY TECHNOLOGY, 2024–2029 (USD MILLION)
             TABLE 97 ASIA PACIFIC: HYPERSPECTRAL IMAGING SYSTEMS MARKET, BY APPLICATION, 2020–2023 (USD MILLION)
             TABLE 98 ASIA PACIFIC: HYPERSPECTRAL IMAGING SYSTEMS MARKET, BY APPLICATION, 2024–2029 (USD MILLION)
             TABLE 99 ASIA PACIFIC: HYPERSPECTRAL IMAGING SYSTEMS MARKET FOR REMOTE SENSING & MAPPING, BY TYPE, 2020–2023 (USD MILLION)
             TABLE 100 ASIA PACIFIC: HYPERSPECTRAL IMAGING SYSTEMS MARKET FOR REMOTE SENSING & MAPPING, BY TYPE, 2024–2029 (USD MILLION)
             TABLE 101 ASIA PACIFIC: HYPERSPECTRAL IMAGING SYSTEMS MARKET, BY COUNTRY, 2020–2023 (USD MILLION)
             TABLE 102 ASIA PACIFIC: HYPERSPECTRAL IMAGING SYSTEMS MARKET, BY COUNTRY, 2024–2029 (USD MILLION)
             10.4.1 ASIA PACIFIC: RECESSION IMPACT
             10.4.2 CHINA
                        10.4.2.1 Growing use of hyperspectral imaging technology in remote sensing satellites to drive market
             10.4.3 JAPAN
                        10.4.3.1 Rising focus on developing hyperspectral imaging systems for emerging applications to create lucrative opportunities
             10.4.4 INDIA
                        10.4.4.1 Growing use of hyperspectral imaging in scientific research to foster market growth
             10.4.5 REST OF ASIA PACIFIC
     10.5 REST OF THE WORLD (ROW) 
             TABLE 103 ROW: HYPERSPECTRAL IMAGING SYSTEMS MARKET, BY OFFERING, 2020–2023 (USD MILLION)
             TABLE 104 ROW: HYPERSPECTRAL IMAGING SYSTEMS MARKET, BY OFFERING, 2024–2029 (USD MILLION)
             TABLE 105 ROW: HYPERSPECTRAL IMAGING SYSTEMS MARKET, BY TECHNOLOGY, 2020–2023 (USD MILLION)
             TABLE 106 ROW: HYPERSPECTRAL IMAGING SYSTEMS MARKET, BY TECHNOLOGY, 2024–2029 (USD MILLION)
             TABLE 107 ROW: HYPERSPECTRAL IMAGING SYSTEMS MARKET, BY APPLICATION, 2020–2023 (USD MILLION)
             TABLE 108 ROW: HYPERSPECTRAL IMAGING SYSTEMS MARKET, BY APPLICATION, 2024–2029 (USD MILLION)
             TABLE 109 ROW: HYPERSPECTRAL IMAGING SYSTEMS MARKET FOR REMOTE SENSING & MAPPING, BY TYPE, 2020–2023 (USD MILLION)
             TABLE 110 ROW: HYPERSPECTRAL IMAGING SYSTEMS MARKET FOR REMOTE SENSING & MAPPING, BY TYPE, 2024–2029 (USD MILLION)
             TABLE 111 ROW: HYPERSPECTRAL IMAGING SYSTEMS MARKET, BY REGION, 2020–2023 (USD MILLION)
             TABLE 112 ROW: HYPERSPECTRAL IMAGING SYSTEMS MARKET, BY REGION, 2024–2029 (USD MILLION)
             10.5.1 ROW: RECESSION IMPACT
             10.5.2 MIDDLE EAST & AFRICA
                        10.5.2.1 Increasing use of hyperspectral imaging technology in remote sensing and environmental monitoring applications to support market growth
             10.5.3 SOUTH AMERICA
                        10.5.3.1 Elevating demand for hyperspectral imaging in mapping natural resources to fuel market growth
 
11 COMPETITIVE LANDSCAPE (Page No. - 151)
     11.1 OVERVIEW 
     11.2 KEY PLAYER STRATEGIES/RIGHT TO WIN, 2020–2023 
             TABLE 113 OVERVIEW OF STRATEGIES ADOPTED BY MAJOR COMPANIES, 2020–2023
     11.3 REVENUE ANALYSIS, 2019–2023 
             FIGURE 50 REVENUE ANALYSIS OF KEY PLAYERS IN HYPERSPECTRAL IMAGING SYSTEMS MARKET, 2019–2023
     11.4 MARKET SHARE ANALYSIS, 2023 
             TABLE 114 HYPERSPECTRAL IMAGING SYSTEMS MARKET: DEGREE OF COMPETITION, 2023
             FIGURE 51 MARKET SHARE ANALYSIS OF MAJOR PLAYERS, 2023
     11.5 COMPANY VALUATION AND FINANCIAL METRICS 
             FIGURE 52 COMPANY VALUATION (USD MILLION), 2023
             FIGURE 53 FINANCIAL METRICS (EV/EBITDA), 2023
     11.6 BRAND/PRODUCT COMPARISON 
             FIGURE 54 BRAND/PRODUCT COMPARISON
     11.7 COMPANY EVALUATION MATRIX: KEY PLAYERS, 2023 
             11.7.1 STARS
             11.7.2 EMERGING LEADERS
             11.7.3 PERVASIVE PLAYERS
             11.7.4 PARTICIPANTS
                        FIGURE 55 HYPERSPECTRAL IMAGING SYSTEMS MARKET: COMPANY EVALUATION MATRIX (KEY PLAYERS), 2023
             11.7.5 COMPANY FOOTPRINT: KEY PLAYERS, 2023
                        11.7.5.1 Company footprint
                                     FIGURE 56 HYPERSPECTRAL IMAGING SYSTEMS MARKET: COMPANY FOOTPRINT
                        11.7.5.2 Region footprint
                                     TABLE 115 HYPERSPECTRAL IMAGING SYSTEMS MARKET: REGION FOOTPRINT
                        11.7.5.3 Technology footprint
                                     TABLE 116 HYPERSPECTRAL IMAGING SYSTEMS MARKET: TECHNOLOGY FOOTPRINT
                        11.7.5.4 Wavelength footprint
                                     TABLE 117 HYPERSPECTRAL IMAGING SYSTEMS MARKET: WAVELENGTH FOOTPRINT
                        11.7.5.5 Application footprint
                                     TABLE 118 HYPERSPECTRAL IMAGING SYSTEMS MARKET: APPLICATION FOOTPRINT
     11.8 COMPANY EVALUATION MATRIX: STARTUPS/SMES, 2023 
             11.8.1 PROGRESSIVE COMPANIES
             11.8.2 RESPONSIVE COMPANIES
             11.8.3 DYNAMIC COMPANIES
             11.8.4 STARTING BLOCKS
                        FIGURE 57 HYPERSPECTRAL IMAGING SYSTEMS MARKET: COMPANY EVALUATION MATRIX (SMES/STARTUPS), 2023
             11.8.5 COMPETITIVE BENCHMARKING: KEY STARTUPS/SMES, 2023
                        11.8.5.1 Detailed list of startups/SMEs
                                     TABLE 119 HYPERSPECTRAL IMAGING SYSTEMS MARKET: LIST OF KEY STARTUPS/SMES
                        11.8.5.2 Competitive benchmarking of key startups/SMEs
                                     TABLE 120 HYPERSPECTRAL IMAGING SYSTEMS MARKET: COMPETITIVE BENCHMARKING OF KEY STARTUPS/SMES
     11.9 COMPETITIVE SCENARIO AND TRENDS 
             11.9.1 PRODUCT LAUNCHES
                        TABLE 121 HYPERSPECTRAL IMAGING SYSTEMS MARKET: PRODUCT LAUNCHES, JANUARY 2020–MARCH 2024
             11.9.2 DEALS
                        TABLE 122 HYPERSPECTRAL IMAGING SYSTEMS MARKET: DEALS, JANUARY 2020–MARCH 2024
             11.9.3 OTHERS
                        TABLE 123 HYPERSPECTRAL IMAGING SYSTEMS MARKET: OTHERS, JANUARY 2020–MARCH 2024
 
12 COMPANY PROFILES (Page No. - 171)
(Business overview, Products/Services/Solutions offered, Recent Developments, MNM view)*  
     12.1 KEY PLAYERS 
             12.1.1 SPECIM, SPECTRAL IMAGING LTD.
                        TABLE 124 SPECIM, SPECTRAL IMAGING LTD.: COMPANY OVERVIEW
                        TABLE 125 SPECIM, SPECTRAL IMAGING LTD.: PRODUCTS/SOLUTIONS/SERVICES OFFERED
                        TABLE 126 SPECIM, SPECTRAL IMAGING LTD.: PRODUCT/SERVICE LAUNCHES
                        TABLE 127 SPECIM, SPECTRAL IMAGING LTD.: DEALS
                        TABLE 128 SPECIM, SPECTRAL IMAGING LTD.: OTHERS
             12.1.2 CORNING INCORPORATED
                        TABLE 129 CORNING INCORPORATED: COMPANY OVERVIEW
                        FIGURE 58 CORNING INCORPORATED: COMPANY SNAPSHOT
                        TABLE 130 CORNING INCORPORATED: PRODUCTS/SOLUTIONS/SERVICES OFFERED
                        TABLE 131 CORNING INCORPORATED: DEALS
             12.1.3 HORIBA
                        TABLE 132 HORIBA: COMPANY OVERVIEW
                        FIGURE 59 HORIBA: COMPANY SNAPSHOT
                        TABLE 133 HORIBA: PRODUCTS/SOLUTIONS/SERVICES OFFERED
                        TABLE 134 HORIBA: DEALS
             12.1.4 NORSK ELEKTRO OPTIKK
                        TABLE 135 NORSK ELEKTRO OPTIKK: COMPANY OVERVIEW
                        TABLE 136 NORSK ELEKTRO OPTIKK: PRODUCTS/SOLUTIONS/SERVICES OFFERED
             12.1.5 TELOPS
                        TABLE 137 TELOPS: COMPANY OVERVIEW
                        TABLE 138 TELOPS: PRODUCTS/SOLUTIONS/SERVICES OFFERED
                        TABLE 139 TELOPS: DEALS
             12.1.6 MALVERN PANALYTICAL LTD
                        TABLE 140 MALVERN PANALYTICAL LTD: COMPANY OVERVIEW
                        TABLE 141 MALVERN PALANYTICAL LTD: PRODUCTS/SOLUTIONS/SERVICES OFFERED
             12.1.7 HEADWALL PHOTONICS INC
                        TABLE 142 HEADWALL PHOTONICS INC: COMPANY OVERVIEW
                        TABLE 143 HEADWALL PHOTONICS INC: PRODUCTS/SOLUTIONS/SERVICES OFFERED
                        TABLE 144 HEADWALL PHOTONICS INC: DEALS
             12.1.8 BAYSPEC, INC.
                        TABLE 145 BEYSPEC, INC.: COMPANY OVERVIEW
                        TABLE 146 BAYSPEC, INC.: PRODUCTS/SOLUTIONS/SERVICES OFFERED
             12.1.9 RESONON INC.
                        TABLE 147 RESONON INC.: COMPANY OVERVIEW
                        TABLE 148 RESONON INC.: PRODUCTS/SOLUTIONS/SERVICES OFFERED
                        TABLE 149 RESONON INC.: PRODUCT/SERVICE LAUNCHES
                        TABLE 150 RESONON INC.: DEALS
             12.1.10 CUBERT GMBH
                        TABLE 151 CUBERT GMBH: COMPANY OVERVIEW
                        TABLE 152 CUBERT GMBH: PRODUCTS/SOLUTIONS/SERVICES OFFERED
                        TABLE 153 CUBERT GMBH: PRODUCT/SERVICE LAUNCHES
     12.2 OTHER PLAYERS 
             12.2.1 PIXXEL
             12.2.2 HYPERMED IMAGING, INC.
             12.2.3 IMEC
             12.2.4 INNO-SPEC GMBH
             12.2.5 ORNET SDN BHDS
             12.2.6 CYTOVIVA, INC.
             12.2.7 DIASPECTIVE VISION
             12.2.8 GAMAYA
             12.2.9 HINALEA IMAGING CORP.
             12.2.10 ORBITAL SIDEKICK
             12.2.11 PHOTON ETC
             12.2.12 CLYDEHSI
             12.2.13 GLANA SENSORS AB
             12.2.14 SURFACE OPTICS CORPORATION
             12.2.15 BRANDYWINE PHOTONICS
*Details on Business overview, Products/Services/Solutions offered, Recent Developments, MNM view might not be captured in case of unlisted companies.  
 
13 APPENDIX (Page No. - 209)
     13.1 INSIGHTS FROM INDUSTRY EXPERTS 
     13.2 DISCUSSION GUIDE 
     13.3 KNOWLEDGESTORE: MARKETSANDMARKETS’ SUBSCRIPTION PORTAL 
     13.4 CUSTOMIZATION OPTIONS 
     13.5 RELATED REPORTS 
     13.6 AUTHOR DETAILS 
 

The study involved four major activities in estimating the current size of the hyperspectral imaging systems market. Exhaustive secondary research collected information on the market, peer, and parent markets. The next step was to validate these findings, assumptions, and sizing with industry experts across the value chain through primary research. Both top-down and bottom-up approaches were employed to estimate the complete market size. After that, market breakdown and data triangulation were used to estimate the market size of segments and subsegments.

Secondary Research

Various secondary sources have been referred to in the secondary research process to identify and collect information important for this study. The secondary sources include annual reports, press releases, and investor presentations of companies; white papers; journals and certified publications; and articles from recognized authors, websites, directories, and databases. Secondary research has been conducted to obtain key information about the industry’s supply chain, the market’s value chain, the total pool of key players, market segmentation according to the industry trends (to the bottom-most level), regional markets, and key developments from market- and technology-oriented perspectives. The secondary data has been collected and analyzed to determine the overall market size, further validated by primary research.

List of major secondary sources

Sources

Web Link

Company Blogs

What is hyperspectral Imaging?: A Comprehensive Guide - Specim Spectral Imaging

Industry Journals

Remote Sensing | An Open Access Journal from MDPI

Environmental Protection Agency

www.epa.gov

Primary Research

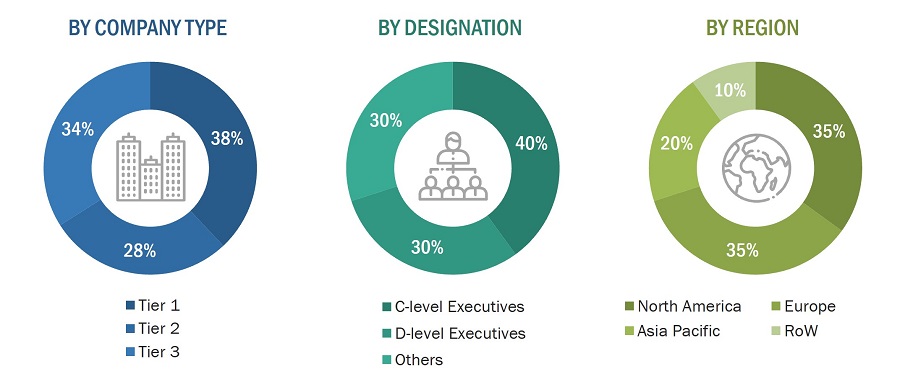
Extensive primary research was conducted after gaining knowledge about the current scenario of the hyperspectral imaging systems market through secondary research. Several primary interviews were conducted with experts from both the demand and supply sides across four major regions—North America, Europe, Asia Pacific and RoW. This primary data was collected through questionnaires, emails, and telephonic interviews.
Hyperspectral Imaging Systems Market
 Size, and Share

To know about the assumptions considered for the study, download the pdf brochure

Market Size Estimation

In the complete market engineering process, both top-down and bottom-up approaches have been used, along with several data triangulation methods, to perform market estimation and forecasting for the overall market segments and subsegments listed in this report. Key players in the market have been identified through secondary research, and their market shares in the respective regions have been determined through primary and secondary research. This entire procedure includes the study of annual and financial reports of the top market players and extensive interviews for key insights (quantitative and qualitative) with industry experts (CEOs, VPs, directors, and marketing executives).

All percentage shares, splits, and breakdowns have been determined using secondary sources and verified through primary sources. All the parameters affecting the markets covered in this research study have been accounted for, viewed in detail, verified through primary research, and analyzed to obtain the final quantitative and qualitative data. This data has been consolidated and supplemented with detailed inputs and analysis from MarketsandMarkets and presented in this report. The following figure represents this study’s overall market size estimation process.

Bottom-Up Approach

  • Identifying various wavelengths using hyperspectral imaging systems
  • Analyzing the penetration of each type of wavelength through secondary and primary research
  • Analyzing the penetration of hyperspectral imaging systems based on different applications and technologies through secondary and primary research
  • Conducting multiple discussion sessions with key opinion leaders to understand the detailed working of hyperspectral imaging systems and their implementation in numerous applications; this helped analyze the break-up of the scope of work carried out by each major company
  • Verifying and cross-checking the estimates at every level with key opinion leaders, including CEOs, directors, operation managers, and finally with MarketsandMarkets domain experts
  • Studying various paid and unpaid sources of information, such as annual reports, press releases, white papers, and databases

Hyperspectral Imaging Systems Market
 Size, and Bottom-Up Approach

Top-Down Approach

  • Focusing initially on the top-line investments and expenditures being made in the ecosystem of the hyperspectral imaging systems market; further, splitting the key market areas based on product type, technology, wavelength, application, and region, and listing the key developments.
  • Identifying all leading players and applications in the hyperspectral imaging systems market based on region through secondary research and thoroughly verifying them through a brief discussion with industry experts
  • Analyzing revenues, product mix, geographic presence, and critical applications served by all identified players to estimate and arrive at percentage splits for all key segments
  • Discussing splits with the industry experts to validate the information and identify critical growth pockets across all key segments
  • Breaking down the total market based on verified splits and critical growth pockets across all segments

Hyperspectral Imaging Systems Market
 Size, and Top-Down Approach

Data Triangulation

After arriving at the overall market size from the estimation process explained in the previous section, the total market was split into several segments and subsegments. Where applicable, the data triangulation procedure was employed to complete the overall market engineering process and arrive at the exact statistics for all segments and subsegments. The data was triangulated by studying various factors and trends from the demand and supply sides, and the market size was validated using top-down and bottom-up approaches.

Market Definition

Hyperspectral imaging systems are utilized to capture specific spectral bands across a continuous spectrum. Hyperspectral imaging systems are advanced imaging technologies that capture and process information across a wide range of the electromagnetic spectrum. Unlike traditional imaging systems, which typically capture images in three spectral bands (red, green, and blue), hyperspectral imaging systems collect spectral data across hundreds or thousands of narrow contiguous bands. These systems consist of hyperspectral cameras along with their accompanying systems. They are widely used in fields such as agriculture, environmental monitoring, mining etc.

Key Stakeholders

  • Hyperspectral imaging systems providers
  • Original equipment manufacturers (OEMs)
  • Research organisations and consulting firms
  • Technology standards organisationa
  • Raw material suppliers
  • Allaince and associations related to hyperspectral imaging technology
  • Technology solution providers and design contractors
  • Electronics and semiconductor companies
  • Technology standards organizations, forums, alliances, and associations
  • Analysts and strategic business planners
  • Associations, organizations, and alliances related to hyperspectral imaging technology
  • Universities and research organizations
  • Government bodies

Report Objectives

  • To describe and forecast the hyperspectral imaging systems market by offering, technology, wavelength, application, and region.
  • To forecast the market size for various segments concerning four key regions, namely, North America, Europe, Asia Pacific, and Rest of the World (RoW), in terms of value
  • To provide detailed information regarding the major factors influencing the market growth (drivers, restraints, opportunities, and challenges).
  • To forecast the size of the hyperspectral cameras deployed in the hyperspectral imaging systems market.
  • To provide a detailed overview of the value chain of hyperspectral imaging system ecosystems, along with the average selling price for hyperspectral cameras and other systems
  • To strategically profile key players and comprehensively analyze their position in the hyperspectral imaging systems market regarding their ranking and core competencies and detail the competitive landscape for market leaders.
  • To strategically analyze the ecosystem, regulatory landscape, patent landscape, Porter’s five forces, import and export scenarios, tariff analysis, and case studies about the market under study.
  • To analyze strategic developments, such as product launches, related developments, acquisitions, expansions, and agreements, in the market

Customization Options

With the given market data, MarketsandMarkets offers customizations according to the company’s specific needs. The following customization options are available for the report:

Company Information

  • Detailed analysis and profiling of additional market players (up to five)

Geographic Analysis

  • Further breakdown of regions into respective countries
Custom Market Research Services

We will customize the research for you, in case the report listed above does not meet with your exact requirements. Our custom research will comprehensively cover the business information you require to help you arrive at strategic and profitable business decisions.

Request Customization

Instant Answers with GPT - Ask Now!

Ask real questions. Get complete answers !
Report Code
SE 8995
Published ON
Apr, 2024
Choose License Type
BUY NOW
  • SHARE
X
Request Customization
Speak to Analyst
Speak to Analyst
OR FACE-TO-FACE MEETING
PERSONALIZE THIS RESEARCH
  • Triangulate with your Own Data
  • Get Data as per your Format and Definition
  • Gain a Deeper Dive on a Specific Application, Geography, Customer or Competitor
  • Any level of Personalization
REQUEST A FREE CUSTOMIZATION
LET US HELP YOU!
  • What are the Known and Unknown Adjacencies Impacting the Hyperspectral Imaging Systems Market
  • What will your New Revenue Sources be?
  • Who will be your Top Customer; what will make them switch?
  • Defend your Market Share or Win Competitors
  • Get a Scorecard for Target Partners
CUSTOMIZED WORKSHOP REQUEST
+1-888-600-6441
  • Call Us
  • +1-888-600-6441 (Corporate office hours)
  • +1-888-600-6441 (US/Can toll free)
  • +44-800-368-9399 (UK office hours)
CONNECT WITH US
ABOUT TRUST ONLINE
©2024 MarketsandMarkets Research Private Ltd. All rights reserved
DMCA.com Protection Status Website Feedback