3D Laser Scanner Market by Range (Short, Medium, and Long), Product (Tripod Mounted, Fixed CMM Based, Portable CMM Based, and Desktop), Offering (Hardware & Software and After-Sales Services), Application, End User, and Geography - Global Forecast to 2022


The 3D laser scanner market is expected to be worth USD 3.74 Billion by 2022, growing at a CAGR of 8.18% between 2017 and 2022.
The objective of this report is to define, describe, and forecast the market size and growth potential of the market across different segments such as range, product, offering, application, end user, and geography. It includes the forecast of the market size, in terms of value, with respect to four main geographies, namely, the Americas, Europe, APAC, and RoW. The study identifies and analyzes the market dynamics such as drivers, restraints, opportunities, and industry-specific challenges for the market. It also profiles the key players operating in the market. The base year considered for this report is 2016, and the forecast period for the market has been considered between 2017 and 2022. The growth of this market is driven by factors such as the high level of quality control and inspection standards offered by 3D laser scanners, significant deployment of 3D laser scanners in various industries, and the emerging market for 3D printers across the globe.
The research methodology used to estimate and forecast the market begins by capturing the revenues of the key players and their shares in the market. Some of the organizations associated with the market include Laser Scanning Forum Ltd, SPAR 3D, 3D Hubs, and 3dprintboard.com. The overall market size has been calculated on the basis of the revenue of the key players identified in the market. After arriving at the overall market size, the total market has been split into several segments and subsegments, which have then been verified through primary research by conducting extensive interviews with industry experts such as CEOs, VPs, directors, and executives. The data triangulation and market breakdown procedures have been employed to complete the overall market engineering process and arrive at the exact statistics for all segments and subsegments. The breakdown of profiles of the primary respondents is depicted in the figure below:
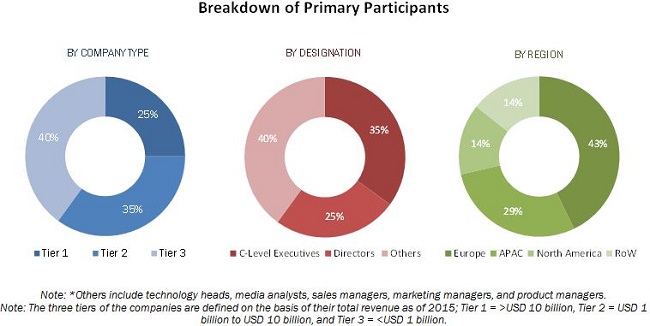
To know about the assumptions considered for the study, download the pdf brochure
The value chain of the overall 3D laser scanner market includes various activities and factors that help achieve a high level of performance with respect to a service or a product. The key players operating across the value chain of the market are FARO Technologies, Inc., (US), Hexagon AB (Sweden), Creaform (Canada), Perceptron, Inc. (US), Nikon Metrology NV (Belgium), Trimble Inc. (US), Topcon Corporation (Japan), 3D Digital Corporation (US), Riegl Laser Measurement Systems GmbH (Austria), and Carl Zeiss Optotechnik GmbH (Germany).
Key Target Audience:
- Component and equipment suppliers
- Original equipment manufacturers (OEMs)
- Original design manufacturers (ODMs)
- Installers and maintenance service providers
- Research organizations
- Component integrators
- Technology providers
Get online access to the report on the World's First Market Intelligence Cloud
Request Sample Scope of the Report
:

The 3D laser scanner market has been covered in detail in this report. To provide a holistic picture, the current market demand and forecasts have also been included in the report. In this report, the market has been segmented as follows:
3D Laser Scanner Market, by Range
- Short
- Medium
- Long
3D Laser Scanner Market, by Product
- Tripod Mounted
- Fixed CMM Based
- Bridge CMM Based
- Gantry CMM Based
- Horizontal Arm CMM Based
- Portable CMM Based
- Articulated Arm CMM
- Handheld
- Desktop
3D laser scanner Market, by Application
- Quality Control & Inspection
- Reverse Engineering
- Virtual Simulation
- Others
3D laser scanner, by Offering
- Hardware and Software
- After-Sales Services
3D laser scanner Market, by End User
- Automotive
- Healthcare
- Aerospace & Defense
- Architecture & Construction
- Energy & Power
- Tunnel & Mining
- Artifacts & Heritage Preservation Department
- Others
Geographic Analysis of the Global 3D Laser Scanner Market:
- Americas
- Europe
- APAC
- RoW
Available Customizations:
With the given market data, MarketsandMarkets offers customizations according to the company�s specific needs. The following customization options are available for the report:
- Country-wise breakdown of all regions by application
- Detailed analysis and profiling of additional five market players
According to the MarketsandMarkets forecast, the 3D laser scanner market is expected to be worth USD 3.74 Billion by 2022, growing at a CAGR of 8.18% between 2017 and 2022. The major drivers for the market include the high level of quality control and inspection standards offered by 3D laser scanners, significant deployment of 3D laser scanners in various industries, and the emerging market for 3D printers across the globe.
The report covers the market on the basis of range, product, application, offering end user, and geography. The study identifies and analyzes the market dynamics such as drivers, restraints, opportunities, and industry-specific challenges for the market. It also profiles the key players operating in the market.
The quality control & inspection application held a larger share of the 3D laser scanner market in 2016. Quality control is an integral part of production process as it leads the production to run smooths and without incurring any extra cost. In the quality control & inspection application, 3D laser scanner is used for alignment, CAD-based inspection, dimensional analysis, and machine calibration, among others. Manufacturers have a robust inspection process to improve quality. Manufacturers use 3D laser scanners for accurate 3D scanning and inspection analysis to determine the corrective action without slowing down the production.
On the basis of end users, the automotive sector held the largest share in 2016, while architecture & construction industry is expected to witness the highest growth highest rate during the forecast period. The architecture & construction industry is gradually evolving and state-of-the-art solutions are being adopted to execute giant construction projects such as construction of bridges, multistoried buildings, expressways, and industrial plants. 3D laser scanner is a safe and fast way to capture the as-built information required for bridge and road design, monitoring, and inspection.
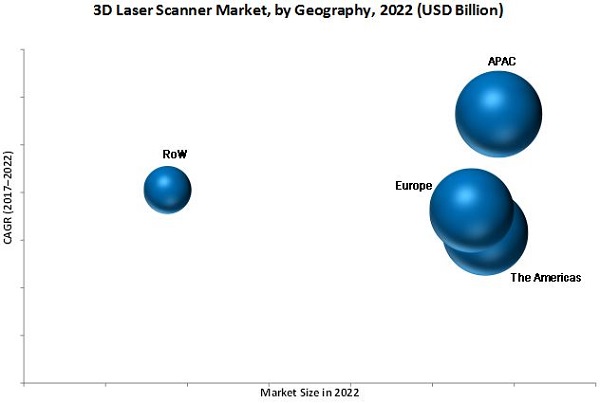
The market is dominated by the Americas; however, APAC is expected to grow the highest rate during the forecast period. The highest growth rate in APAC is attributed to the rising number of engineering and infrastructure projects, increasing preference for custom implants in medical applications to ensure better and faster recovery, and increasing number of dental restoration surgeries.
The complex 3D scanning software and huge data storage concerns may pose a challenge for manufacturers in the market. The major vendors in market are FARO Technologies, Inc., (US), Hexagon AB (Sweden), Creaform (Canada), Perceptron, Inc. (US), Nikon Metrology NV (Belgium), Trimble Inc. (US), Topcon Corporation (Japan), 3D Digital Corporation (US), Riegl Laser Measurement Systems GmbH (Austria), and Carl Zeiss Optotechnik GmbH (Germany). These players adopted various strategies such as new product launches and developments, contracts, acquisitions, partnerships, and business expansions to cater to the needs of the market.
To speak to our analyst for a discussion on the above findings, click Speak to Analyst
Table of Contents
1 Introduction (Page No. - 14)
1.1 Objectives of the Study
1.2 Market Definition
1.3 Study Scope
1.3.1 Markets Covered
1.3.2 Years Considered for the Study
1.4 Currency and Pricing
1.5 Package Size
1.6 Limitations
1.7 Stakeholders
2 Research Methodology (Page No. - 18)
2.1 Research Data
2.1.1 Secondary Data
2.1.1.1 List of Major Secondary Sources
2.1.1.2 Key Data From Secondary Source
2.1.2 Primary Data
2.1.2.1 Primary Interviews With Experts
2.1.2.2 Breakdown of Primaries
2.1.2.3 Key Data From Primary Source
2.2 Secondary and Primary Research
2.2.1 Key Industry Insights
2.3 Market Size Estimation
2.3.1 Bottom-Up Approach
2.3.1.1 Approach for Capturing the Market Share By Bottom-Up Analysis (Demand Side)
2.3.2 Top-Down Approach
2.3.2.1 Approach for Capturing the Market Share By Top-Down Analysis (Supply Side)
2.4 Data Triangulation
2.5 Process Flow of Market Size Estimation
2.6 Research Assumptions
3 Executive Summary (Page No. - 30)
4 Premium Insights (Page No. - 36)
4.1 Major Opportunities in the Market
4.2 Market, By Range
4.3 Market in APAC
4.4 Americas Held the Largest Share of the Market in 2016
4.5 Market, By Application
5 Market Overview (Page No. - 40)
5.1 Introduction
5.2 Market Dynamics: Market
5.2.1 Drivers
5.2.1.1 High Level of Quality Control and Inspection Standards Offered By 3D Laser Scanners
5.2.1.2 Significant Deployment of 3D Laser Scanners in Various Industries
5.2.1.3 Emerging Market for 3D Printers Across the Globe
5.2.2 Restraints
5.2.2.1 High Cost of 3D Laser Scanners
5.2.2.2 Availability and Affordability of Traditional Alternatives to 3D Laser Scanning
5.2.3 Opportunities
5.2.3.1 Integration of 3D Scanning Technology in Affordable Consumer Devices
5.2.4 Challenges
5.2.4.1 Complex 3D Scanning Software and Huge Data Storage Concerns
5.3 Value Chain Analysis
6 3D Laser Scanner Market, By Range (Page No. - 47)
6.1 Introduction
6.2 Short Range
6.3 Medium Range
6.4 Long Range
7 3D Laser Scanner Market, By Product (Page No. - 53)
7.1 Introduction
7.2 Tripod Mounted
7.3 Fixed CMM Based
7.3.1 Bridge CMM Based
7.3.2 Gantry CMM Based
7.3.3 Horizontal Arm CMM Based
7.4 Portable CMM Based
7.4.1 Articulated Arm CMM
7.4.2 Handheld
7.5 Desktop
8 3D Laser Scanner Market, By Offering (Page No. - 63)
8.1 Introduction
8.2 Hardware & Software
8.2.1 Laser Emitter and Receiver
8.2.2 Sensor
8.2.3 Camera
8.2.4 Motor & Processor
8.2.5 Mirrors
8.2.6 Others
8.3 After-Sales Services
9 3D Laser Scanner Market, By Application (Page No. - 67)
9.1 Introduction
9.2 Reverse Engineering
9.3 Quality Control & Inspection
9.4 Virtual Simulation
9.5 Other Applications
10 3D Laser Scanner Market, By End User (Page No. - 77)
10.1 Introduction
10.2 Automotive
10.3 Healthcare
10.4 Aerospace & Defense
10.5 Architecture & Construction
10.6 Energy & Power
10.7 Tunnel & Mining
10.8 Artifact & Heritage Preservation Department
10.9 Other End Users
11 Geographic Analysis (Page No. - 92)
11.1 Introduction
11.2 Americas
11.2.1 US
11.2.2 Canada
11.2.3 Mexico
11.2.4 South America
11.3 Europe
11.3.1 Germany
11.3.2 Uk
11.3.3 France
11.3.4 Rest of Europe
11.4 APAC
11.4.1 China
11.4.2 Japan
11.4.3 India
11.4.4 Rest of APAC
11.5 Rest of the World
11.5.1 Middle East
11.5.2 Africa
12 Competitive Landscape (Page No. - 115)
12.1 Introduction
12.2 Market Ranking of Players, 2016
12.3 Vendor Dive Overview
12.3.1 Vanguards
12.3.2 Dynamic Players
12.3.3 Innovators
12.3.4 Emerging Players
12.4 Business Strategies Adopted By Major Players in the Market (25 Companies)
12.5 Analysis of the Product Offerings of Major Players in the Market (25 Companies)
*Top Companies Analyzed for This Study are � Faro Technologies Inc.; Hexagon; Nikon Metrology NV; Creaform; Trimble Inc.; Topcon Corporation; Carl Zeiss Optotechnik GmbH; Perceptron, Inc.; Riegl Laser Measurement Systems GmbH; 3D Digital Corp; 3D Print & Project; Maptek Pty Ltd; Nextengine Inc.; ShapegrABBer Inc.; Teledyne Optech Incorporated; Mitutoyo Corporation; Renishaw PLC.; Wenzel America, Ltd.; Surphaser; Dewalt Corporation; Laser Scanning Australia Pty Ltd; Smartgeometrics; Precise Visual Technologies; Laser Aviation Inc.; 360geo4tech
13 Company Profiles (Page No. - 120)
13.1 Introduction
(Business Overview, Products Offered & Services Strategies, Key Insights, Recent Developments, MnM View)*
13.2 Faro Technologies, Inc.
13.3 Hexagon AB
13.4 Creaform
13.5 Perceptron, Inc.
13.6 Nikon Metrology NV
13.7 Trimble Inc.
13.8 Topcon Corporation
13.9 3D Digital Corporation
13.10 Riegl Laser Measurement Systems GmbH
13.11 Carl Zeiss Optotechnik GmbH
13.12 Key Innovators
13.12.1 Surphaser
13.12.2 Dewalt Corporation
13.12.3 ShapegrABBer Inc.
13.12.4 Wenzel America, Ltd.
13.12.5 Nextengine, Inc.
*Details on Business Overview, Products Offered & Services Strategies, Key Insights, Recent Developments, MnM View Might Not Be Captured in Case of Unlisted Companies.
14 Appendix (Page No. - 155)
14.1 Insights of Industry Experts
14.2 Discussion Guide
14.3 Knowledge Store: Marketsandmarkets� Subscription Portal
14.4 Introducing RT: Real-Time Market Intelligence
14.5 Available Customizations
14.6 Related Reports
14.7 Author Details
List of Tables (63 Tables)
Table 1 Market, By Range, 2014�2022 (USD Million)
Table 2 Short-Range 3D Laser Scanner Market, By Region, 2014�2022 (USD Million)
Table 3 Medium-Range 3D Laser Scanner Market, By Region, 2014�2022 (USD Million)
Table 4 Long-Range 3D Laser Scanner Market, By Region, 2014�2022 (USD Million)
Table 5 Market, By Product, 2014�2022 (USD Million)
Table 6 Tripod-Mounted 3D Laser Scanner Market, By Region, 2014�2022 (USD Million)
Table 7 Tripod-Mounted 3D Laser Scanner Market, By End User, 2014�2022 (USD Million)
Table 8 Fixed CMM-Based 3D Laser Scanner Market, By Region, 2014�2022 (USD Million)
Table 9 Market, By End User, 2014�2022 (USD Million)
Table 10 Portable CMM-Based 3D Laser Scanner Market, By Region, 2014�2022 (USD Million)
Table 11 Market, By End User, 2014�2022 (USD Million)
Table 12 Desktop 3D Laser Scanner Market, By Region, 2014�2022 (USD Million)
Table 13 Market, By End User, 2014�2022 (USD Million)
Table 14 Market, By Offering, 2014�2022 (USD Million)
Table 15 Market, By Application, 2014�2022 (USD Million)
Table 16 Market for Reverse Engineering, By Region, 2014�2022 (USD Million)
Table 17 Market for Reverse Engineering, By End User, 2014�2022 (USD Million)
Table 18 Market for Quality Control & Inspection, By Region, 2014�2022 (USD Million)
Table 19 Market for Quality Control & Inspection, By End User, 2014�2022 (USD Million)
Table 20 Market for Virtual Simulation, By Region, 2014�2022 (USD Million)
Table 21 Market for Virtual Simulation Application, By End User, 2014�2022 (USD Million)
Table 22 Market for Other Applications, By Region, 2014�2022 (USD Million)
Table 23 Market for Other Applications, By End User, 2014�2022 (USD Million)
Table 24 Market, By End User, 2014�2022 (USD Million)
Table 25 Market for Automotive, By Region, 2014�2022 (USD Million)
Table 26 Market for Automotive, By Product, 2014�2022 (USD Million)
Table 27 Market for Healthcare, By Region, 2014�2022 (USD Million)
Table 28 Market for Healthcare, By Product, 2014�2022 (USD Million)
Table 29 Market for Aerospace & Defense, By Region, 2014�2022 (USD Million)
Table 30 Market for Aerospace & Defense, By Product, 2014�2022 (USD Million)
Table 31 Market for Architecture & Construction, By Region, 2014�2022 (USD Million)
Table 32 Market for Architecture & Construction, By Product, 2014�2022 (USD Million)
Table 33 Market for Energy & Power, By Region, 2014�2022 (USD Million)
Table 34 Market for Energy & Power, By Product, 2014�2022 (USD Million)
Table 35 Market for Tunnel & Mining, By Region, 2014�2022 (USD Million)
Table 36 Market for Tunnel & Mining, By Product, 2014�2022 (USD Million)
Table 37 Market for Artifact & Heritage Preservation, By Region, 2014�2022 (USD Million)
Table 38 Market for Artifact & Heritage Preservation, By Product, 2014�2022 (USD Million)
Table 39 Market for Other End Users, By Region, 2014�2022 (USD Million)
Table 40 Market for Other End Users, By Product, 2014�2022 (USD Million)
Table 41 Market, By Region, 2014�2022 (USD Million)
Table 42 Market, By Region, 2014�2022 (Thousand Units)
Table 43 Market in the Americas, By Country, 2014�2022 (USD Million)
Table 44 Market in the Americas, By Product, 2014�2022 (USD Million)
Table 45 Market in Americas, By End User, 2014�2022 (USD Million)
Table 46 Market in the Americas, By Range, 2014�2022 (USD Million)
Table 47 Market in the Americas, By Application, 2014�2022 (USD Million)
Table 48 Market in Europe, By Country, 2014�2022 (USD Million)
Table 49 Market in Europe, By Product, 2014�2022 (USD Million)
Table 50 Market in Europe, By End User, 2014�2022 (USD Million)
Table 51 Market in Europe, By Range, 2014�2022 (USD Million)
Table 52 (3D) Laser Scanner Market in Europe, By Application, 2014�2022 (USD Million)
Table 53 Market in APAC, By Country, 2014�2022 (USD Million)
Table 54 Market in APAC, By Product, 2014�2022 (USD Million)
Table 55 Market in APAC, By End User, 2014�2022 (USD Million)
Table 56 Market in APAC, By Range, 2014�2022 (USD Million)
Table 57 Market in APAC, By Application, 2014�2022 (USD Million)
Table 58 Market in RoW, By Region, 2014�2022 (USD Million)
Table 59 Market in RoW, By Product, 2014�2022 (USD Million)
Table 60 Market in RoW, By End User, 2014�2022 (USD Million)
Table 61 Market in RoW, By Range, 2014�2022 (USD Million)
Table 62 Market in RoW, By Application, 2014�2022 (USD Million)
Table 63 Ranking for the Market, 2016
List of Figures (54 Figures)
Figure 1 Research Design for 3D Laser Scanner Market
Figure 2 Market Size Estimation Methodology: Bottom-Up Approach
Figure 3 Market Size Estimation Methodology: Top-Down Approach
Figure 4 Data Triangulation
Figure 5 Market, in Terms of Value and Volume, 2014�2022
Figure 6 Short-Range 3D Laser Scanner Expected to Hold the Largest Size of the Market During the Forecast Period
Figure 7 Portable CMM-Based Product Expected to Witness the Highest Growth Rate in the 3D Laser Scanner Market During the Forecast Period
Figure 8 Quality Control & Inspection Application to Hold the Largest Share of the Market During the Forecast Period
Figure 9 Automotive Estimated to Hold the Largest Share of the Market During the Forecast Period
Figure 10 The Americas Held the Largest Share of the Market in 2016
Figure 11 Significant Adoption of 3D Laser Scanners Expected in APAC Between 2017 and 2022
Figure 12 Market for Short-Range 3D Laser Scanner Expected to Witness the Highest Growth Rate During the Forecast Period
Figure 13 Fixed CMM-Based 3D Laser Scanner Held the Largest Share of the Market in APAC in 2016
Figure 14 US Dominated the Market in 2016
Figure 15 Reverse Engineering Application to Witness the Highest Growth in the Market During the Forecast Period
Figure 16 Market Dynamics
Figure 17 Increasing Unit Shipments of 3D Printers Between 2016 and 2020 Globally
Figure 18 Value Chain Analysis: Market
Figure 19 Market, By Range
Figure 20 Short-Range 3D Laser Scanners Expected to Witness the Highest Growth Rate During the Forecast Period
Figure 21 APAC Expected to Witness the Highest CAGR in the Short-Range 3D Laser Scanner Market During the Forecast Period
Figure 22 Market, By Product
Figure 23 Portable CMM-Based 3D Laser Scanners Expected to Witness the Highest CAGR During the Forecast Period
Figure 24 Architecture & Construction End User Expected to Dominate the Tripod-Mounted Market During the Forecast Period
Figure 25 Portable CMM-Based Market in APAC Expected to Witness the Highest CAGR During the Forecast Period
Figure 26 Market, By Offering
Figure 27 Hardware & Software Segment Expected to Hold A Larger Market Size in the Market During the Forecast Period
Figure 28 Market, By Application
Figure 29 Quality Control & Inspection Application Expected to Dominate the Market During the Forecast Period
Figure 30 APAC Expected to Register the Highest Growth Rate in the Market for the Quality Control & Inspection Application During the Forecast Period
Figure 31 Other End Users Expected to Lead the Market for Virtual Simulation During the Forecast Period
Figure 32 Market, By End User
Figure 33 Automotive Expected to Lead the Market During the Forecast Period
Figure 34 Europe Estimated to Lead the 3D Scanner Market for Healthcare in 2017
Figure 35 APAC Expected to Dominate the Market for Architecture & Construction During the Forecast Period
Figure 36 Tripod-Mounted 3D Laser Scanner Market Estimated to Witness the Highest CAGR in the Artifact & Heritage Preservation Department During the Forecast Period
Figure 37 Market, By Geography
Figure 38 Geographic Snapshot of the Market, 2017�2022
Figure 39 Market in the Americas
Figure 40 Americas: Market Snapshot
Figure 41 Market in Europe
Figure 42 Europe: Market Snapshot
Figure 43 Market in APAC
Figure 44 APAC: Market Snapshot
Figure 45 Market in RoW
Figure 46 RoW: Market Snapshot
Figure 47 Key Growth Strategies Adopted By the Companies Between 2014 and 2017
Figure 48 Dive Chart
Figure 49 Geographic Revenue Mix of Major Companies
Figure 50 Faro Technologies, Inc.: Company Snapshot
Figure 51 Hexagon AB.: Company Snapshot
Figure 52 Perceptron, Inc.: Company Snapshot
Figure 53 Trimble Inc.: Company Snapshot
Figure 54 Topcon Corporation: Company Snapshot


Growth opportunities and latent adjacency in 3D Laser Scanner Market
I�m interested in to know about components used in 3D laser scanner, dose your report includes it and what all information will be provided?
we are working on 3D vision, measurement, and inspection system, so we would like to know your coverage around the same. We are particularly looking for market size and end-users perspectives.