4K Technology Market by Product (TVs, Monitors, Digital Signage, Set-Top Boxes, Smartphones, Tablets, Laptops, Projectors, Cameras, and Blu-Ray Players) and Geography (North America, Europe, APAC, and RoW) - Global Analysis and Forecast to 2020


4K technology is on the cusp of replacing the HD technology from TV screens, computer monitors, cameras, and projectors. The term 4K is used to refer to video signals with a horizontal resolution on the order of 4,000 pixels. A 4K resolution is 4096 x 2160 pixels (approximately a 1.9:1 aspect ratio). In a full HD resolution produced by the Blu-ray technology, a 4K image is composed of nearly 8.3 Million pixels, whereas a 1080p image has just more than 2 Million pixels. The 4K technology market was valued at USD 18.1 Billion in 2014 and it is expected to grow at a CAGR of 21.8% from 2015 to 2020.
Different 4K technology-enabled products which have been considered in this report include TVs, monitors, tablets, smartphones, cameras, laptops, digital signage, set-top boxes, and Blu-ray players. 4K TVs accounted for the largest market share of ~49% of the 4K technology market in 2014. Although 4K tablets would be commercialized by the end of 2015, this product segment is expected to grow at the highest CAGR during the forecast period, followed by 4K Blu-ray players and 4K smartphones which are expected to be commercialized in 2016. This report covers the 4K technology market in regions, including the Americas, Europe, Asia-Pacific, and Rest of the World (RoW).
The report also includes the market dynamics such as drivers, restraints, opportunities, and challenges. Apart from the market segmentation, the report also includes the critical market data and qualitative information for each product type, along with the critical analysis such as the Porter�s five forces analysis and the value chain analysis. The report also discusses the future roadmap of the global 4K technology market with respect to upcoming products and potential markets for the same. This report will provide valuable insights to various stakeholders of this market such as raw material suppliers, display manufacturers, OEMs, and distributers in order to formulate their market strategies. Similarly, this report will provide useful information to various technology forums, alliances, associations, research institutes, and organizations to understand the current trends in this market.
The key players included in the 4K technology market report are Canon Inc. (Japan), Blackmagic Design Pty Ltd. (Australia), Innolux Corp. (Taiwan), LG Electronics Corp. (South Korea), Panasonic Corp. (Japan), Samsung Electronics Corp. (South Korea), Sharp Corp. (Japan), Sony Corp. (Japan), JVC Kenwood Corp. (Japan), AsusTek Corp. (Taiwan), Hong Kong Skyworth Digital Holdings Ltd. (China), TCL Corp. (China), and Hisense Co., Ltd. (China)
In relation to the 4K technology report, two similar reports were published by MarketsandMarkets, namely, camera technology market (published in January 2015) and interactive display market (published in June 2015). Both these reports are available on the company�s website (www.marketsandmarkets.com) for reference. With the given market data, MarketsandMarkets offers customizations as per the company�s specific needs. Further breakdown of all the regions into major countries, and in-depth analysis and profiling of additional players on the basis of various blocks of the value chain can be provided as per a client requirement.
4K resolution provides four times more pixel density than that of full HD 1080p, with 8.3 Million pixels to display which enhances the picture quality along with incredibly intense colors and image details. Brilliant picture quality and vivid colors play a significant role in the growth of the 4K technology market. However, the lack of 4K content, discrepancy between screen size and viewing distance, and broadcasting problems of 4K contents are key factors limiting the growth of this market.
On the basis of products, the 4K technology market has been segmented into TVs, monitors, smartphones, digital signage, tablets, set-top boxes, projectors, cameras and Blu-ray players. Among all, 4K TVs are expected to hold the largest share of the market at ~39% by 2020. The 4K TV market is sub segmented on the basis of screen size and the technology used.
This report describes market trends, drivers, restraints, opportunities, and challenges for the 4K technologies market and forecasts the market size from 2014 to 2020 in terms of both value and volume. This report covers the market in major regions such as the Americas, Europe, APAC, and RoW. In 2014, APAC had the largest market size in terms of value; however, the market in RoW is projected to grow at the highest CAGR of 32.2% between 2015 and 2020.
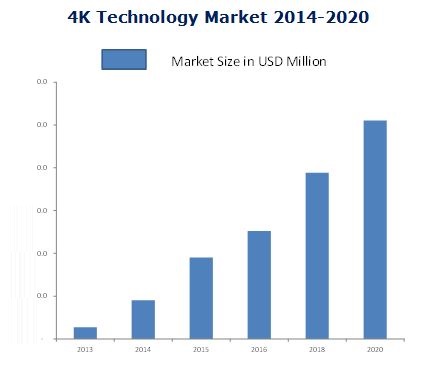
The global 4K technology market is estimated to grow at a CAGR of 21.8% to reach $102.1 Billion by 2020. A high demand from developing regions, enhanced picture quality and real colors, and rapidly declining ASP of 4K-enabled consumer electronic products are some of the major reasons for the growth of the market.
The market has been witnessing a series of new product launches, announcements, and partnerships across the value chain. The report profiles major players along with their SWOT analysis in the 4K technology market. The key players included in the report are Canon Inc. (Japan), Blackmagic Design Pty Ltd. (Australia), Innolux Corp. (Taiwan), LG Electronics Corp. (South Korea), Panasonic Corp. (Japan), Samsung Electronics Corp. (South Korea), Sharp Corp. (Japan), Sony Corp. (Japan), JVC Kenwood Corp. (Japan), AsusTek Corp. (Taiwan), Hong Kong Skyworth Digital Holdings Ltd. (China), TCL Corp. (China), and Hisense Co., Ltd. (China).
Table of Contents
1 Introduction (Page No. - 6)
1.1 Objectives of the Study
1.2 Market Definition
1.3 Study Scope
1.3.1 Markets Covered
1.3.2 Years Considered for the Study
1.4 Currency
1.5 Limitation
1.6 Stakeholders
2 Research Methodology (Page No. - 9)
2.1 Introduction
2.2 Research Data
2.2.1 Secondary Data
2.2.1.1 Key Data From Secondary Sources
2.2.2 Primary Data
2.2.2.1 Key Data From Primary Sources
2.2.2.2 Key Industry Insights
2.2.2.3 Breakdown of Primaries
2.3 Variables Considered Within Factor Analysis
2.3.1 Demand-Side Analysis
2.3.1.1 Panel Technology-Wise Analysis of the Global TV Market
2.3.1.2 Historical Analysis of the Global PC Market
2.4 Market Size Estimation
2.4.1 Bottom-Up Approach
2.4.2 Top-Down Approach
2.4.3 Market Share Estimation
2.5 4K Technology Market Breakdown and Data Triangulation
2.6 Research Assumptions
3 Research Methodology (Page No. - 19)
4 Premium Insights (Page No. - 24)
4.1 Attractive Opportunities in the 4K Technology Market
4.2 4K Technology Market �Top Three Products
4.3 4K Technology Market, By Product and Geography
4.4 Regional Analysis of the 4K Technology Market
4.5 Lifecycle Cycle Analysis, By Product
5 Market Overview (Page No. - 27)
5.1 Introduction
5.2 Market Segmentation
5.2.1 4K Technology Market, By Product
5.2.2 Market, By Geography
5.3 Market Dynamics
5.3.1 Drivers
5.3.1.1 Better Picture Quality
5.3.1.2 High Quality Videography and Photography
5.3.1.3 Declining Selling Price of 4K TVs
5.3.1.4 4K Technology Fits With the Growing Requirement for Large TV Screens
5.3.2 Restraints
5.3.2.1 Limited Content Availability
5.3.2.2 Discrepancy Between Viewing Distance and Screen Width
5.3.3 Opportunity
5.3.3.1 4K Broadcast Points New Era in Live Sports Coverage
5.3.4 Challenges
5.3.4.1 Broadcast of 4K Content Requires Considerably More Bandwidth Than HD Content
6 Industry Trends (Page No. - 36)
6.1 Introduction
6.2 Value Chain Analysis
6.3 Porter�s Five Forces Analysis
6.3.1 Threat of New Entrants
6.3.2 Threats of Substitutes
6.3.3 Bargaining Power of Suppliers
6.3.4 Bargaining Power of Buyers
6.3.5 Degree of Competition
7 4K Technology Market By Product (Page No. - 41)
7.1 Introduction
7.2 4K TVs
7.2.1 4K TVs Market, By Screen Size
7.2.2 4K TVs, By Technology
7.2.2.1 LCD TVs
7.2.2.2 Oled TVs
7.3 4K Digital Signage
7.3.1 4K Digital Signage Panels
7.3.2 4K Digital Signage Media Players
7.4 4K Set-Top Boxes
7.5 4K Smartphones
7.6 4K Tablets
7.7 4K Laptops
7.8 4K Projectors
7.9 4K Cameras
7.9.1 4K Digital Cameras
7.9.2 4K Action Cameras
7.10 4K Blu-Ray Players
8 4K Technology Market By Geography (Page No. - 87)
8.1 Introduction
8.1 North America
8.2 Europe
8.3 APAC
8.4 RoW
9 Competitive Landscape (Page No. - 107)
9.1 Overview
9.2 4K Technology Market Share Analysis
9.3 Competitive Scenario
9.3.1 New Product Launches
9.3.2 Expansions, Partnerships, Acquisitions, Collaborations, and Others
10 Company Profiles (Page No. - 113)
10.1 Introduction
10.2 Samsung Electronics Co., Ltd.
10.2.1 Business Overview
10.2.2 Product Portfolio
10.2.3 Recent Developments
10.2.4 MnM View
10.3 LG Electronics Inc.
10.3.1 Business Overview
10.3.2 Product Portfolio
10.3.3 Recent Developments
10.3.4 MnM View
10.4 Canon Inc.
10.4.1 Business Overview
10.4.2 Product Portfolio
10.4.3 Recent Developments
10.4.4 MnM View
10.5 Panasonic Corporation
10.5.1 Business Overview
10.5.2 Product Portfolio
10.5.3 Recent Developments
10.5.4 MnM View
10.6 Sharp Corporation
10.6.1 Business Overview
10.6.2 Product Portfolio
10.6.3 Recent Developments
10.6.4 MnM View
10.7 Sony Corporation
10.7.1 Business Overview
10.7.2 Product Portfolio
10.7.3 Recent Developments
10.7.4 MnM View
10.8 Hisense Co., Ltd.
10.8.1 Business Overview
10.8.2 Product Portfolio
10.8.3 Recent Developments
10.9 Blackmagic Design Pty Ltd.
10.9.1 Business Overview
10.9.2 Product Portfolio
10.9.3 Recent Developments
10.10 Hong Kong Skyworth Digital Holdings Ltd.
10.10.1 Business Overview
10.10.2 Product Portfolio
10.10.3 Recent Developments
10.11 TCL Corporation
10.11.1 Business Overview
10.11.2 Product Portfolio
10.11.3 Recent Developments
10.12 Innolux Corporation
10.12.1 Business Overview
10.12.2 Product Portfolio
10.12.3 Recent Developments
10.13 JVC Kenwood Corporation
10.13.1 Business Overview
10.13.2 Product Portfolio
10.13.3 Recent Developments
10.14 Asustek Computer Inc.
10.14.1 Business Overview
10.14.2 Product Portfolio
10.14.3 Recent Developments
11 Appendix (Page No. - 143)
11.1 Insights of Industry Experts
11.2 Discussion Guide
11.3 Introducing RT: Real-Time Market Intelligence
11.4 Available Customizations
11.5 Related Reports
List of Tables (85 Tables)
Table 1 Better Picture Quality and Declining Selling Prices of Uhd TVs is Propelling the Growth of the 4K Technology Market
Table 2 Limited Availability of the Content is Expected to Restrain the Growth of the 4K Technology Market
Table 3 Live Sports Coverage and 4K Enabled Action Cameras are Generating New Opportunities for the 4K Technology Market
Table 4 Broadcast of 4K Content is the Major Challenge for the 4K Technology Market
Table 5 4K Technology Market, By Product (USD Million )
Table 6 Market, By Product (Thousand Units)
Table 7 4K Television Market, By Geography (USD Million)
Table 8 4K TV Market, By Geography (Thousand Units)
Table 9 Gist of Lechner Distance Chart
Table 10 4K Television Market, By Screen Size (USD Million)
Table 11 4K Television Market, By Screen Size (Thousand Units)
Table 12 <55" 4K Television Market, By Technology (USD Million)
Table 13 <55" 4K Television Market, By Technology (Thousand Units)
Table 14 55"-64" 4K Television Market, By Technology (USD Million)
Table 15 55"-64" 4K Television Market, By Technology (Thousand Units)
Table 16 >64" 4K Television Market, By Technology (USD Million)
Table 17 >64" 4K Television Market, By Technology (Thousand Units)
Table 18 4K Television Market, By Technology (USD Million)
Table 19 4K Television Market, By Technology (Thousand Units)
Table 20 4K LCD Television Market, By Geography (USD Million)
Table 21 4K LCD Television Market, By Geography (Thousand Units)
Table 22 <55" 4K LCD Television Market, By Geography (USD Million)
Table 23 <55" 4K LCD Television Market, By Geography (Thousand Units)
Table 24 55"-64" 4K LCD Television Market, By Geography (USD Million)
Table 25 55"-64" 4K LCD Television Market, By Geography (Thousand Units)
Table 26 >64" 4K LCD Television Market, By Geography (USD Million)
Table 27 >64" 4K LCD Television Market, By Geography (Thousand Units)
Table 28 4K Oled Television Market, By Geography (USD Million)
Table 29 4K Oled Television Market, By Geography (Thousand Units)
Table 30 <55" 4K Oled Television Market, By Geography (USD Million)
Table 31 <55" 4K Oled Television Market, By Geography (Thousand Units)
Table 32 55"-64" 4K Oled Television Market, By Geography (USD Million)
Table 33 55"-64" 4K Oled Television Market, By Geography (Thousand Units)
Table 34 >64" 4K Oled Television Market, By Geography (USD Million)
Table 35 >64" 4K Oled Television Market, By Geography (Thousand Units)
Table 36 4K Monitor Market, By Geography (USD Million)
Table 37 4K Monitor Market, By Geography (Thousand Units)
Table 38 4K Digital Signage Market, By Geography (USD Million)
Table 39 4K Digital Signage Market, By Geography (Thousand Units)
Table 40 4K Digital Signage Market, By Component (USD Million)
Table 41 4K Digital Signage Market, By Component (Thousand Units)
Table 42 4K Digital Signage Panels Market, By Geography (USD Million)
Table 43 4K Digital Signage Panels Market, By Geography (Thousand Units)
Table 44 4K Digital Signage Panels Market, By Screen Size (USD Million)
Table 45 4K Digital Signage Panels Market, By Screen Size (Thousand Units)
Table 46 <=52" 4K Digital Signage Panels Market, By Geography (USD Million)
Table 47 <=52" 4K Digital Signage Panels Market, By Geography (Thousand Units)
Table 48 >52" 4K Digital Signage Panels Market, By Geography (USD Million)
Table 49 >52" 4K Digital Signage Panels Market, By Geography (Thousand Units)
Table 50 4K Digital Signage Media Players Market, By Geography (USD Million)
Table 51 4K Digital Signage Media Players Market, By Geography (Thousand Units)
Table 52 4K Set-Top Boxes Market, By Geography (USD Million)
Table 53 4K Set-Top Boxes Market, By Geography (Thousand Units)
Table 54 4K Set-Top Boxes Market, By Type (USD Million)
Table 55 4K Set-Top Boxes Market, By Type (Thousand Units)
Table 56 4K Smartphones Market, By Geography (USD Million)
Table 57 4K Smartphones Market, By Geography (Thousand Units)
Table 58 4K Tablets Market, By Geography (USD Million)
Table 59 4K Tablets Market, By Geography (Thousand Units)
Table 60 4K Laptops Market, By Geography (USD Million)
Table 61 4K Laptops Market, By Geography (Thousand Units)
Table 62 4K Projectors Market, By Geography (USD Million)
Table 63 4K Projectors Market, By Geography (Thousand Units)
Table 64 4K Cameras Market, By Geography (USD Million)
Table 65 4K Cameras Market, By Geography (Thousand Units)
Table 66 4K Cameras Market, By Product (USD Million)
Table 67 4K Cameras Market, By Product (Thousand Units)
Table 68 4K Digital Cameras Market, By Geography (USD Million)
Table 69 4K Digital Cameras Market, By Geography (Thousand Units)
Table 70 4K Action Cameras Market, By Geography (USD Million)
Table 71 4K Action Cameras Market, By Geography (Thousand Units)
Table 72 4K Blu-Ray Players Market, By Geography (USD Million)
Table 73 4K Blu-Ray Players Market, By Geography (Thousand Units)
Table 74 4K Technology Market Size, By Region, 2013-2020, (USD Million )
Table 75 Market Size, By Region, 2013-2020, (Thousand Units)
Table 76 North America: 4K Technology Market Size, By Product, 2013-2020 (USD Million)
Table 77 North America: Market Size, By Product, 2013-2020 (Thousand Units)
Table 78 Europe: 4K Technology Market Size, By Product Segment, 2013-2020 (USD Million)
Table 79 Europe: Market Size, By Product, 2013-2020 (Thousand Units)
Table 80 APAC: 4K Technology Market Size, By Product Segment, 2013-2020 (USD Million)
Table 81 APAC: Market Size, By Product, 2013-2020 (Thousand Units)
Table 82 RoW: 4K Technology Market Size, By Product, 2013-2020 (Million USD)
Table 83 RoW: Market Size, By Product Segment, 2013-2020 (Thousand Units)
Table 84 Most Significant New Product Launches of Market
Table 85 Most Significant Expansions, Partnerships, Acquisitions, Collaborations, and Other Developments of 4K Technology Market
List of Figures (83 Figures)
Figure 1 Research Design
Figure 2 LCD/LED Technology Grew Exponentially in Global TV Market
Figure 3 the Overall Pc Shipments are Shrinking Consistently Since 2011
Figure 4 Process Flow of Market Size Estimation
Figure 5 Market Size Estimation Methodology: Bottom-Up Approach
Figure 6 Market Size Estimation Methodology: Top-Down Approach
Figure 7 Market Breakdown & Data Triangulation
Figure 8 Assumptions of the Research Study
Figure 9 4K TVs are Estimated to Have A Large Market in 2015
Figure 10 APAC Accounted for Around Half of the Overall Market in 2015
Figure 11 4K Tablet Expected to Be the Fastest Growing Product Segment in the 4K Technology Market During the Forecast Period
Figure 12 RoW Likely to Be the Fastest Growing Region in the 4K Technology Market During the Forecast Period
Figure 13 the 4K Technology Market is Expected to Grow at A Cagr of 21.8% in Terms of Value, From 2015 to 2020
Figure 14 4K TVs Accounted for the Largest Share of the 4K Technology Market, in Terms of Volume
Figure 15 Asia-Pacific Estimated to Account for More Than Half of the Overall 4K Technology Market Share, in Terms of Value
Figure 16 APAC has A Large Market for 4K Technology-Enabled Products
Figure 17 4K Enabled TVs, Cameras, and Digital Signage Market Have Reached the Growth Stage
Figure 18 Comparison of All Resolutions
Figure 19 Market, By Product
Figure 20 Market, By Geography
Figure 21 Declining Selling Prices of Uhd TVs is Expected to Lead to New Growth Opportunities in the 4K Technology Market
Figure 22 Average Uhd TV Prices, 2011�2014
Figure 23 4K Broadcasting Timeline
Figure 24 Value Chain Analysis: Major Value is Added During Panel Manufacturing and Final Assembling of 4K Technology-Enabled Products
Figure 25 Value Chain: 4K Content Delivery
Figure 26 Porter�s Five Forces Analysis
Figure 27 the Market for 4K Tablets is Expected to Grow at the Highest Rate During the Forecast Period
Figure 28 4K TVs Expected to Have the Largest Market Size in Terms of Volume in 2015
Figure 29 4K TV Market, By Geography, in Terms of Value, (2015 vs 2020)
Figure 30 4K TV Market, By Screen Size, in Terms of Value (2015 vs 2020)
Figure 31 4K TV Market, By Display Technology, in Terms of Value (2015 vs 2020)
Figure 32 Oled Structure
Figure 33 4K Monitor Market, By Product, in Terms of Value, (2015 vs 2020)
Figure 34 4K Digital Signage Market, By Geography, in Terms of Value, (2015 vs 2020)
Figure 35 4K Digital Signage Market, By Component, in Terms of Value (2015 vs 2020)
Figure 36 4K Set-Top Box Market, By Geography, in Terms of Value (2015 vs 2020)
Figure 37 4K Set-Top Box Market, By Product Type, in Terms of Value (2015 vs 2020)
Figure 38 4K Smartphones Market, By Geography, in Terms of Value, (2016 vs 2020)
Figure 39 4K Tablet Market, By Geography, in Terms of Value (2015 vs 2020)
Figure 40 4K Laptop Market, By Geography, in Terms of Value (2015 vs 2020)
Figure 41 4K Projector Market, By Geography, in Terms of Value (2015 vs 2020)
Figure 42 4K Camera Market, By Geography, in Terms of Value (2015 vs 2020)
Figure 43 4K Cameras Market, By Product Type, in Terms of Value (2015 vs 2020)
Figure 44 4K Blu-Ray Player Market, By Geography, in Terms of Value (2015 vs 2020)
Figure 45 Geographic Snapshot of the 4K Technology Market
Figure 46 4K Technology Market in RoW is Expected to Grow at the Highest Rate During the Forecast Period
Figure 47 APAC is Expected to Lead the 4K Technology Market During the Forecast Period
Figure 48 North America: 4K Technology Market Snapshot
Figure 49 North America: 4K Technology Market Size, By Product, ( (2015 vs 2020) (USD Million)
Figure 50 North America: 4K Technology Market Size, By Product, in Terms of Volume, (2015 vs 2020) (Thousand Units)
Figure 51 Europe: 4K Technology Market Snapshot
Figure 52 Europe: Market Size, By Product, (2015 vs 2020) (USD Million)
Figure 53 Europe: Market Size, By Product, (2015 vs 2020) (Thousand Units)
Figure 54 APAC�s 4K Technology Market Snapshot
Figure 55 Comparison of the APAC�s 4K Technology Market Size, By Product, in Terms of Value, (2015 vs 2020)
Figure 56 APAC: 4K Technology Market Size, By Product, (2015 vs 2020) (Thousand Units)
Figure 57 RoW: 4K Technology Market Snapshot
Figure 58 RoW: Market Size, By Product, (2015 vs 2020) (USD Million)
Figure 59 RoW: Market Size, By Product, (2015 vs 2020) (Thousand Units)
Figure 60 Companies Adopted Product Innovation as the Key Growth Strategy From 2013 to 2015
Figure 61 Market Share of the Top Five Players in the 4K Technology Market, 2014
Figure 62 Market Evolution Framework
Figure 63 Battle for the Market Share: New Product Launches is the Key Strategy
Figure 64 Geographic Revenue Mix of Top Five Players in the 4K Technology Market
Figure 65 Samsung Electronics Co., Ltd.: Company Snapshot
Figure 66 Samsung Electronics Co., Ltd.: SWOT Analysis
Figure 67 LG Electronics Inc.: Company Snapshot
Figure 68 LG Electronics Inc.: SWOT Analysis
Figure 69 Canon Inc.: Company Snapshot
Figure 70 Canon Inc.: SWOT Analysis
Figure 71 Panasonic Corporation: Company Snapshot
Figure 72 Panasonic Corporation: SWOT Analysis
Figure 73 Sharp Corporation: Company Snapshot
Figure 74 Sharp Corporation: SWOT Analysis
Figure 75 Sony Corporation: Company Snapshot
Figure 76 Sony Corporation: SWOT Analysis
Figure 77 Hisense Co., Ltd.: Company Snapshot
Figure 78 Blackmagic Design Pty. Ltd.: Company Snapshot
Figure 79 Hong Kong Skyworth Digital Holdings Ltd.: Company Snapshot
Figure 80 TCL Corporation: Company Snapshot
Figure 81 Innolux Corporation: Company Snapshot
Figure 82 JVC Kenwood Corporation: Company Snapshot
Figure 83 Asustek Computer Inc.: Company Snapshot


Growth opportunities and latent adjacency in 4K Technology Market