Advanced Functional Material Market For Low Carbon Applications By Categories (Ceramics, Composites, Energy Materials, Conductive Polymers & Nanomaterials), Applications (Chemicals, Electronics, Healthcare & Transportation) & Geography - Global Trends & Forecasts To 2018


[621 Pages Report] Advanced functional materials for low carbon applications include five categories of materials. These consist of advanced functional ceramics, advanced functional composites, advanced energy materials, conductive polymers, and nanomaterials. The demand for Advanced functional material is derived from industries such as electrical & electronics, energy & power, automotive, aerospace, and healthcare & pharmaceuticals. AFMs reduce the carbon footprint of the component in which it is incorporated in three ways: It consumes less energy during the manufacturing process; has a smaller carbon footprint during use and recycling.
ADVANCED FUNCTIONAL MATERIAL MARKET SEGMENTATION
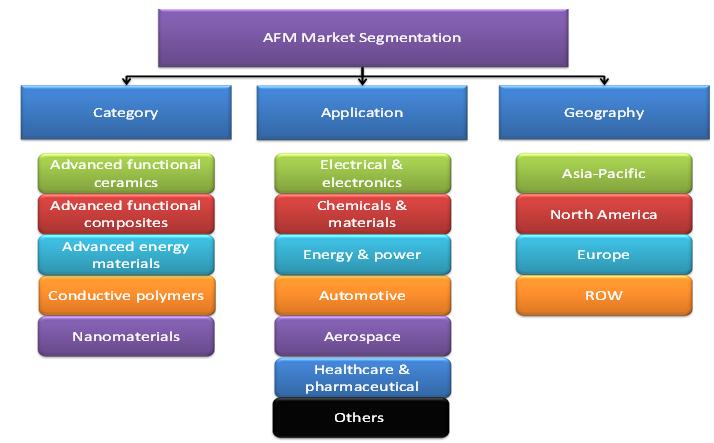
Source: Marketsandmarkets Analysis
Electrical and electronics with the revenue of $35,356.3 in 2012, electrical and electronics was the biggest application segment for AFM. Electrical equipment are increasingly using advanced functional materials ceramics in device such as capacitors. Nanomaterials, advanced energy materials, and conductive polymers are the most researched categories of AFM for the electrical & electronics applications.
The present advanced functional material market growing with a CAGR of 6.6% is expected to generate global revenue of $1,13,881.9 million by 2018.
AFMs for low carbon applications include five categories of materials. These are advanced functional ceramics, advanced functional composites, advanced energy materials, conductive polymers, and nanomaterials. The demand for advanced functional material is derived from industries such as electrical & electronics, energy & power, automotive, aerospace, and healthcare & pharmaceuticals. AFMs reduce the carbon footprint of the component in which it is incorporated in three ways. It consumes less energy during manufacturing process. It has a smaller carbon footprint during use and has a lower carbon footprint during recycling.
Asia-Pacific is currently the largest market for advance functional material. The demand for advanced functional material is derived from end user industries such as automotive, aerospace, consumer durables, electronics, healthcare, and energy. China, Japan, and South Korea are the major markets for AFM in Asia-Pacific.
Nanomaterials are currently the fastest growing category of advanced functional material market. The global nanomaterials market is growing with a CAGR of 19.7%. Nanomaterials are used in several industries due to its magnetic, optical, catalytic, and electronic properties. There are already established markets for nanomaterials such as titanium dioxide, zinc oxide, silicon oxide nanopowders and carbon nanotubes, nanofibers, nanosilver, nanoclays, quantum dots, and nanoporous materials. Nanoparticles are used in applications such as filtration, electronics, cosmetics, energy, medicine, chemicals, coatings, and catalysts.
The advanced functional composite is the largest category of advanced functional material by volume. The market is expected to reach 8,230.0 kilotons by 2018. Two different types of advanced functional composites are covered in this report. These are metal matrix composites and fiber reinforced plastics. Advanced functional composite materials can be separated into three categories based on the strengthening mechanism. These categories are dispersion strengthened, particle reinforced, and fiber reinforced. Asia-Pacific with a CAGR of 9.2% is the fastest growing market for advanced functional composites. Major applications of advanced functional composites include automotive, marine, energy, aerospace, pipes & tanks, electrical & electronics, and consumer durables.
ADVANCED FUNCTIONAL MATERIAL: MARKET SHARE, BY COUNTRIES, 2012
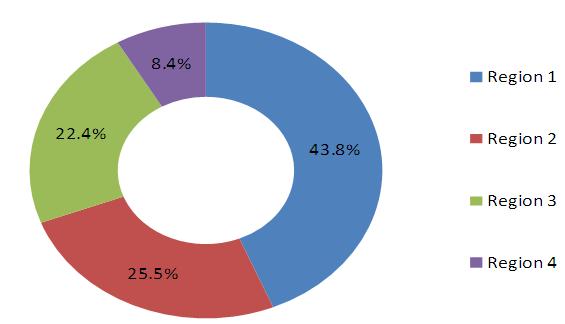
Source: MarketsandMarkets Analysis
This report follows a bottom up approach to estimate and forecast the global market for advanced functional materials by volume and revenue. A holistic approach has been followed in order to segment the entire market into definite categories, applications, and geographies.
Table Of Contents
1 Introduction (Page No. - 31)
1.1 Key Take-Aways
1.2 Report Description
1.3 Stakeholders
1.4 Research Methodology
1.4.1 Market Size
1.4.2 Major Secondary Sources Used
1.4.3 Key Data Points Taken From Secondary Sources
1.4.4 Key Data Points Taken From Primary Sources
1.4.5 Assumptions Made For This Report
2 Executive Summary (Page No. - 36)
3 Premium Insights (Page No. - 42)
3.1 Advanced Functional Material Market Segments
3.2 Advanced Functional Materials Market Dynamics
3.3 Advanced Functional Material Market Global Outlook
4 Market Overview (Page No. - 49)
4.1 Introduction
4.2 Value Chain Analysis
4.2.1 Raw Materials For Advanced Functional Material
4.2.2 Advanced Functional Material Manufacturers
4.2.3 Distribution Network
4.2.4 Industry Applications
4.3 Market Dynamics
4.3.1 Drivers
4.3.1.1 Advanced Functional Materials Substituting Conventional Materials In Transportation Industry
4.3.1.2 Growing Demand In Healthcare Applications
4.3.1.3 Growing Demand In Regional Markets Of Asia-Pacific
4.3.2 Restraints
4.3.2.1 Cost And Raw Material Availability Restricting Market Penetration Of Advanced Functional Material
4.3.3 Opportunities
4.3.3.1 Conductive Polymers, An Emerging Market
4.3.3.2 Eco-Buildings Of The Future Using Advanced Functional Material
4.3.3.3 Asia-Pacific Expected To Grow Rapidly Through 2018
4.4 Burning Issues
4.4.1 Lack Of Standardization In Industry
4.5 Winning Imperatives
4.5.1 Establishing Geography Specific Supply Chain
4.5.2 Establishing Production Capacities In Low Cost And High Consumption Markets In Asia-Pacific
4.6 Raw Material Analysis
4.7 Porter�s Five Force Analysis
4.7.1 Threat Of New Entrants
4.7.2 Threat Of Substitutes
4.7.3 Buyer�s Power
4.7.4 Supplier�s Power
4.7.5 Degree Of Competition
4.8 Patent Analysis
5 Advanced Functional Ceramics (Page No. - 72)
5.1 Introduction
5.2 Advanced Functional Ceramics, By Application
5.2.1 Electrical & Electronics
5.2.2 Transportation
5.2.3 Machinery
5.2.4 Healthcare
5.2.5 Others
5.3 Advanced Functional Ceramics, By Geography
5.3.1 North America
5.3.1.1 U.S.
5.3.1.2 Others
5.3.2 Europe
5.3.2.1 Germany
5.3.2.2 France
5.3.2.3 U.K.
5.3.2.4 Others
5.3.3 Asia-Pacific
5.3.3.1 Japan
5.3.3.2 China
5.3.3.3 South Korea
5.3.3.4 Others
5.3.4 ROW
5.3.4.1 Brazil
5.3.4.2 Other
6 Advance Functional Composites (Page No. - 118)
6.1 Introduction
6.2 Advance Functional Composites Market, By Application
6.2.1 Automotive
6.2.2 Marine
6.2.3 Wind Energy
6.2.4 Aerospace
6.2.5 Pipes & Tanks
6.2.6 Building & Construction
6.2.7 Electrical & Electronics
6.2.8 Consumer Goods
6.2.9 Other
6.3 Advance Functional Composites Market, By Geography
6.3.1 North America
6.3.1.1 U.S.
6.3.1.2 Other
6.3.2 Europe
6.3.2.1 Germany
6.3.2.2 France
6.3.2.3 U.K.
6.3.2.4 Other
6.3.3 Asia-Pacific
6.3.3.1 China
6.3.3.2 Japan
6.3.3.3 South Korea
6.3.3.4 Other
6.3.4 ROW
6.3.4.1 Brazil
6.3.4.2 Other
7 Advanced Energy Materials (Page No. - 175)
7.1 Introduction
7.2 Advanced Energy Materials, By Type
7.2.1 Crystalline Silicon Solar Cell Material
7.2.2 Thin Film Solar Cell Material
7.3 Advanced Energy Materials, By Geography
7.3.1 North America
7.3.1.1 U.S.
7.3.1.2 Other
7.3.2 Europe
7.3.2.1 Germany
7.3.2.2 Italy
7.3.2.3 France
7.3.2.4 Other
7.3.3 Asia-Pacific
7.3.3.1 Japan
7.3.3.2 China
7.3.3.3 South Korea
7.3.3.4 Other
7.3.4 ROW
7.3.4.1 Israel
7.3.4.2 Other
8 Conductive Polymers (Page No. - 209)
8.1 Introduction
8.2 Conductive Polymers, By Application
8.2.1 Oled
8.2.2 Capacitors
8.2.3 Batteries
8.2.4 Organic/Plastic Transistor
8.2.5 Sensors
8.2.6 Solar Cell Components
8.2.7 Actuators
8.2.8 Textile & Fabrics
8.2.9 Anti-Electromagnetic Interference Equipment
8.2.10 Anti-Electrostatic Discharge Equipment
8.2.11 Antistatic Packaging
8.2.12 Electrostatic Paints & Coatings
8.2.13 Other Applications
8.3 Conductive Polymers, By Geography
8.3.1 North America
8.3.1.1 U.S.
8.3.1.2 Others
8.3.2 Europe
8.3.2.1 Germany
8.3.2.2 France
8.3.2.3 U.K.
8.3.2.4 Others
8.3.3 Asia-Pacific
8.3.3.1 China
8.3.3.2 Japan
8.3.3.3 South Korea
8.3.3.4 Others
8.3.4 ROW
8.3.4.1 Brazil
8.3.4.2 Others
9 Nanomaterials (Page No. - 276)
9.1 Introduction
9.2 Nanomaterials Global Market, By Application
9.2.1 Chemicals & Materials
9.2.2 Electrical & Electronics
9.2.3 Healthcare & Pharmaceuticals
9.2.4 Aerospace
9.2.5 Other
9.3 Nanomaterials Market, By Geography
9.3.1 North America
9.3.1.1 U.S.
9.3.1.2 Other
9.3.2 Europe
9.3.2.1 Germany
9.3.2.2 France
9.3.2.3 U.K.
9.3.2.4 Other
9.3.3 Asia-Pacific
9.3.3.1 China
9.3.3.2 Japan
9.3.3.3 South Korea
9.3.3.4 Other
9.3.4 ROW
9.3.4.1 Brazil
9.3.4.2 Other
10 Competitive Landscape (Page No. - 324)
10.1 Introduction
10.2 Agreements & Collaborations: The Most Popular Growth Strategy
10.3 Maximum Development In 2011
10.4 Asia-Pacific: Region With Maximum Developments
10.5 Renesola Ltd, E. I. Du. Pont. De. Nemours And Company: The Most Active Participants
10.6 Mergers & Acquisitions
10.7 New Products Launch/Developments
10.8 Agreements & Collaborations
10.9 Expansions
11 Company Profiles (Overview, Financials, Products & Services, Strategy, And Developments)* (Page No. - 353)
11.1 3A Composites Holding AG
11.2 3M Company
11.3 Air Products And Chemicals, Inc.
11.4 Ametek Inc.
11.5 Applied Materials Inc.
11.6 Applied Nanotech Holdings, Inc.
11.7 Bayer AG
11.8 Cambridge Display Technology Ltd (CDT Ltd)
11.9 CNANO Technology Ltd
11.10 Ceradyne Inc.
11.11 CPS Technologies Corporation
11.12 Crosslink
11.13 Deutsche Edelstahlwerke GMBH
11.14 E.I. Du Pont De Nemours & Company
11.15 Kyocera Corporation
11.16 LDK Solar Hi-Tech Co. Ltd.
11.17 Materion Corporation
11.18 Momentive Performance Materials Inc.
11.19 Murata Manufacturing Company, Ltd.
11.20 Renesola Ltd
11.21 Samsung Electro-Mechanics Co., Ltd.
11.22 Sunedison Inc.
11.23 Showa Denko K.K. (SDK)
11.24 Wacker Chemie AG
*Details On Overview, Financials, Product & Services, Strategy, And Developments Might Not Be Captured In Case Of Unlisted Companies.
Appendix (Page No. - 448)
Advanced Functional Ceramics: U.S. Patents
Advanced Functional Ceramics: Europe Patents
Advanced Functional Ceramics: Japan Patents
Advanced Functional Composites: U.S. Patents
Advanced Functional Composites: Europe Patents
Advanced Functional Composites: Japan Patents
Conductive Polymers: U.S. Patents
Conductive Polymers: Europe Patents
Conductive Polymers: Japan Patents
Nanomaterials: U.S. Patents
Nanomaterials: Europe Patents
Nanomaterials: Japan Patents
Advanced Energy Materials: U.S. Patents
Advanced Energy Materials: Europe Patents
Advanced Energy Materials: Japan Patents
List Of Tables (254 Tables)
Table 1 Advanced Functional Material Market Volume, By Geography, 2011 � 2018 (Kilotons)
Table 2 Advanced Functional Materials Market Revenue, By Geography, 2011 � 2018 ($Million)
Table 3 Advanced Functional Material Market Volume, By Category, 2011 � 2018 (Kilotons)
Table 4 Advanced Functional Materials Market Revenue, By Category, 2011 � 2018 ($Million)
Table 5 Advanced Functional Ceramics: Market Volume, By Geography, 2011 - 2018 (Kilotons)
Table 6 Advanced Functional Ceramics: Market Revenue, By Geography, 2011 - 2018 ($Million)
Table 7 Electrical & Electronics: Advanced Functional Ceramics Market, By Volume (Kilotons) & Revenue ($Million), 2011 � 2018
Table 8 Transportation: Advanced Functional Ceramics Market, By Volume (Kilotons) & Revenue ($Million), 2011 � 2018
Table 9 Machinery: Advanced Functional Ceramics Market, By Volume (Kilotons) & Revenue ($Million), 2011 � 2018
Table 10 Healthcare: Advanced Functional Ceramics Market, By Volume (Kilotons) & Revenue ($Million), 2011 � 2018
Table 11 Other: Advanced Functional Ceramics Market, By Volume (Kilotons) & Revenue ($Million), 2011 � 2018
Table 12 North America: Advanced Functional Ceramics, Market Volume, By Applications, 2011 � 2018 (Kilotons)
Table 13 North America: Advanced Functional Ceramics, Market Revenue, By Applications, 2011 � 2018 ($Million)
Table 14 U.S: Advanced Functional Ceramics, Market Volume, By Applications, 2011 � 2018 (Kilotons)
Table 15 U.S: Advanced Functional Ceramics, Market Revenue, By Applications, 2011 � 2018 ($Million)
Table 16 Others: Advanced Functional Ceramics, Market Volume, By Applications, 2011 � 2018 (Kilotons)
Table 17 Other: Advanced Functional Ceramics, Market Revenue, By Applications, 2011 � 2018 ($Million)
Table 18 Europe: Advanced Functional Ceramics, Market Volume, By Applications, 2011 � 2018 (Kilotons)
Table 19 Europe: Advanced Functional Ceramics, Market Revenue, By Applications, 2011 � 2018 ($Million)
Table 20 Germany: Advanced Functional Ceramics, Market Volume, By Applications, 2011 � 2018 (Kilotons)
Table 21 Germany: Advanced Functional Ceramics, Market Revenue, By Applications, 2011 � 2018 ($Million)
Table 22 France: Advanced Functional Ceramics, Market Volume, By Applications, 2011 � 2018 (Kilotons)
Table 23 France: Advanced Functional Ceramics, Market Revenue, By Applications, 2011 � 2018 ($Million)
Table 24 U.K: Advanced Functional Ceramics, Market Volume, By Applications, 2011 � 2018 (Kilotons)
Table 25 U.K: Advanced Functional Ceramics, Market Revenue, By Applications, 2011 � 2018 ($Million)
Table 26 Others: Advanced Functional Ceramics, Market Volume, By Applications, 2011 � 2018 (Kilotons)
Table 27 Others: Advanced Functional Ceramics, Market Revenue, By Applications, 2011 � 2018 ($Million)
Table 28 Asia-Pacific: Advanced Functional Ceramics, Market Volume, By Applications, 2011 � 2018 (Kilotons)
Table 29 Asia-Pacific: Advanced Functional Ceramics, Market Revenue, By Applications, 2011 � 2018 ($Million)
Table 30 Japan: Advanced Functional Ceramics, Market Volume, By Applications, 2011 � 2018 (Kilotons)
Table 31 Japan: Advanced Functional Ceramics, Market Revenue, By Applications, 2011 � 2018 ($Million)
Table 32 China: Advanced Functional Ceramics, Market Volume, By Applications, 2011 � 2018 (Kilotons)
Table 33 China: Advanced Functional Ceramics, Market Revenue, By Applications, 2011 � 2018 ($Million)
Table 34 South Korea: Advanced Functional Ceramics, Market Volume, By Applications, 2011 � 2018 (Kilotons)
Table 35 South Korea: Advanced Functional Ceramics, Market Revenue, By Applications, 2011 � 2018 (Kilotons)
Table 36 Others: Advanced Functional Ceramics, Market Volume, By Applications, 2011 � 2018 (Kilotons)
Table 37 Others: Advanced Functional Ceramics, Market Revenue, By Applications, 2011 � 2018 ($Million)
Table 38 Row: Advanced Functional Ceramics, Market Volume, By Applications, 2011 � 2018 (Kilotons)
Table 39 Row: Advanced Functional Ceramics, Market Revenue, By Applications, 2011 � 2018 ($Million)
Table 40 Brazil: Advanced Functional Ceramics, Market Volume, By Applications, 2011 � 2018 (Kilotons)
Table 41 Brazil: Advanced Functional Ceramics, Market Revenue, By Applications, 2011 � 2018 ($Million)
Table 42 Other: Advanced Functional Ceramics, Market Volume, By Applications, 2011 � 2018 (Kilotons)
Table 43 Other: Advanced Functional Ceramics, Market Revenue, By Applications, 2011 � 2018 ($Million)
Table 44 Advanced Functional Composites: Market Volume, By Geography, 2011 - 2018 (Kilotons)
Table 45 Advanced Functional Composites: Market Revenue, By Geography, 2011 � 2018 ($Million)
Table 46 Automotive: Advanced Functional Composites Market, By Volume (Kilotons) & Revenue ($Million), 2011 � 2018
Table 47 Marine: Advanced Functional Composites Market, By Volume (Kilotons) & Revenue ($Million), 2011 � 2018
Table 48 Wind Energy: Advanced Functional Composites Market, By Volume (Kilotons) & Revenue ($Million), 2011 � 2018
Table 49 Aerospace: Advanced Functional Composites Market, By Volume (Kilotons) & Revenue ($Million), 2011 � 2018
Table 50 Pipes & Tanks: Advanced Functional Composites Market, By Volume (Kilotons) & Revenue ($Million), 2011 � 2018
Table 51 Building & Construction: Advanced Functional Composites Market, By Volume (Kilotons) & Revenue ($Million), 2011 � 2018
Table 52 Electrical & Electronics: Advanced Functional Composites Market, By Volume (Kilotons) & Revenue ($Million), 2011 � 2018
Table 53 Consumer Goods: Advanced Functional Composites Market, By Volume (Kilotons) & Revenue ($Million), 2011 � 2018
Table 54 Other: Advanced Functional Composites Market, By Volume (Kilotons) & Revenue ($Million), 2011 � 2018
Table 55 North America: Advanced Functional Composites, Market Volume, By Applications, 2011 � 2018 (Kilotons)
Table 56 North America: Advanced Functional Composites, Market Revenue, By Applications, 2011 � 2018 ($Million)
Table 57 U.S: Advanced Functional Composites, Market Volume,By Applications, 2011 � 2018 (Kilotons)
Table 58 U.S: Advanced Functional Composites, Market Revenue,By Applications, 2011 � 2018 ($Million)
Table 59 Other: Advanced Functional Composites, Market Volume, By Applications, 2011 � 2018 (Kilotons)
Table 60 Other: Advanced Functional Composites, Market Revenue,By Applications, 2011 � 2018 ($Million)
Table 61 Europe: Advanced Functional Composites, Market Volume, By Applications, 2011 � 2018 (Kilotons)
Table 62 Europe: Advanced Functional Composites, Market Revenue, By Applications, 2011 � 2018 ($Million)
Table 63 Germany: Advanced Functional Composites, Market Volume, By Applications, 2011 � 2018 (Kilotons)
Table 64 Germany: Advanced Functional Composites, Market Revenue, By Applications, 2011 � 2018 ($Million)
Table 65 France: Advanced Functional Composites, Market Volume, By Applications, 2011 � 2018 (Kilotons)
Table 66 France: Advanced Functional Composites, Market Revenue, By Applications, 2011 � 2018 ($Million)
Table 67 U.K: Advanced Functional Composites, Market Volume, By Applications, 2011 � 2018 (Kilotons)
Table 68 U.K: Advanced Functional Composites, Market Revenue, By Applications, 2011 � 2018 ($Million)
Table 69 Other: Advanced Functional Composites, Market Volume,By Applications, 2011 � 2018 (Kilotons)
Table 70 Other: Advanced Functional Composites, Market Revenue, By Applications, 2011 � 2018 ($Million)
Table 71 Asia-Pacific: Advanced Functional Composites, Market Volume, By Applications, 2011 � 2018 (Kilotons)
Table 72 Asia-Pacific: Advanced Functional Composites, Market Revenue, By Applications, 2011 � 2018 ($Million)
Table 73 China: Advanced Functional Composites, Market Volume, By Applications, 2011 � 2018 (Kilotons)
Table 74 China: Advanced Functional Composites, Market Revenue, By Applications, 2011 � 2018 ($Million)
Table 75 Japan: Advanced Functional Composites, Market Volume, By Applications, 2011 � 2018 (Kilotons)
Table 76 Japan: Advanced Functional Composites, Market Revenue, By Applications, 2011 � 2018 ($Million)
Table 77 South Korea: Advanced Functional Composites, Market Volume, By Applications, 2011 � 2018 (Kilotons)
Table 78 South Korea: Advanced Functional Composites, Market Revenue, By Applications, 2011 � 2018 ($Million)
Table 79 Others: Advanced Functional Composites, Market Volume, By Applications, 2011 � 2018 (Kilotons)
Table 80 Others: Advanced Functional Composites, Market Revenue, By Applications, 2011 � 2018 ($Million)
Table 81 ROW: Advanced Functional Composites, Market Volume, By Applications, 2011 � 2018 (Kilotons)
Table 82 ROW: Advanced Functional Composites, Market Revenue, By Applications, 2011 � 2018 ($Million)
Table 83 Brazil: Advanced Functional Composites, Market Volume, By Applications, 2011 � 2018 (Kilotons)
Table 84 Brazil: Advanced Functional Composites, Market Revenue, By Applications, 2011 � 2018 ($Million)
Table 85 Other: Advanced Functional Composites, Market Volume, By Applications, 2011 � 2018 (Kilotons)
Table 86 Other: Advanced Functional Composites, Market Revenue, By Applications, 2011 � 2018 ($Million)
Table 87 Advanced Energy Materials: Market Volume, By Geography, 2011 � 2018 (Kilotons)
Table 88 Advanced Energy Materials: Market Revenue, By Geography, 2011 � 2018 ($Million)
Table 89 Crystalline Silicon Solar Cell Material: Advanced Energy Materials Market, By Volume (Kilotons) & Revenue ($Million), 2011 � 2018
Table 90 Thin Film Solar Cell Material: Advanced Energy Materials Market, By Volume (Kilotons) & Revenue ($Million),2011 � 2018
Table 91 North America: Advanced Energy Materials, Market Volume, By Types, 2011 � 2018 (Kilotons)
Table 92 North America: Advanced Energy Materials Market Revenue, By Types, 2011 � 2018 ($Million)
Table 93 U.S: Advanced Energy Materials, Market Volume, By Types, 2011 � 2018 (Kilotons)
Table 94 U.S.: Advanced Energy Materials, Market Revenue, By Types, 2011 � 2018 ($Million)
Table 95 Other: Advanced Energy Materials Market Volume, By Types, 2011 � 2018 (Kilotons)
Table 96 Other: Advanced Energy Materials Market Revenue, By Types, 2011 � 2018 ($Million)
Table 97 Europe: Advanced Energy Materials, Market Volume, By Types, 2011 � 2018 (Kilotons)
Table 98 Europe: Advanced Energy Materials Market Revenue, By Types, 2011 � 2018 ($Million)
Table 99 Germany: Advanced Energy Materials, Market Volume, By Types, 2011 � 2018 (Kilotons)
Table 100 Germany: Advanced Energy Materials, Market Revenue,By Types, 2011 � 2018 ($Million)
Table 101 Italy: Advanced Energy Materials, Market Volume, By Types, 2011 � 2018 (Kilotons)
Table 102 Italy: Advanced Energy Materials, Market Revenue, By Types, 2011 � 2018 ($Million)
Table 103 France: Advanced Energy Materials, Market Volume, By Types, 2011 � 2018 (Kilotons)
Table 104 France: Advanced Energy Materials, Market Revenue,By Types, 2011 � 2018 ($Million)
Table 105 Other: Advanced Energy Materials, Market Volume, By Types, 2011 � 2018 (Kilotons)
Table 106 Other: Advanced Energy Materials Market Revenue, By Types, 2011 � 2018 ($Million)
Table 107 Asia-Pacific: Advanced Energy Materials, Market Volume, By Types, 2011 � 2018 (Kilotons)
Table 108 Asia-Pacific: Advanced Energy Materials, Market Revenue, By Types, 2011 � 2018 ($Million)
Table 109 Japan: Advanced Energy Materials, Market Volume, By Types, 2011 � 2018 (Kilotons)
Table 110 Japan: Advanced Energy Materials, Market Revenue, By Types, 2011 � 2018 ($Million)
Table 111 China: Advanced Energy Materials, Market Volume, By Types, 2011 � 2018 (Kilotons)
Table 112 China: Advanced Energy Materials, Market Revenue, By Types, 2011 � 2018 ($Million)
Table 113 South Korea: Advanced Energy Materials, Market Volume, By Types, 2011 � 2018 (Kilotons)
Table 114 South Korea: Advanced Energy Materials, Market Revenue, By Types, 2011 � 2018 ($Million)
Table 115 Other: Advanced Energy Materials, Market Volume, By Types, 2011 � 2018 (Kilotons)
Table 116 Other: Advanced Energy Materials, Market Revenue, By Types, 2011 � 2018 ($Million)
Table 117 ROW: Advanced Energy Materials, Market Volume, By Types, 2011 � 2018 (Kilotons)
Table 118 ROW: Advanced Energy Materials, Market Revenue, By Types, 2011 � 2018 ($Million)
Table 119 Israel: Advanced Energy Materials, Market Volume, By Types, 2011 � 2018 (Kilotons)
Table 120 Israel: Advanced Energy Materials, Market Revenue, By Types, 2011 � 2018 ($Million)
Table 121 Other: Advanced Energy Materials, Market Volume, By Types, 2011 � 2018 (Kilotons)
Table 122 Other: Advanced Energy Materials, Market Revenue, By Types, 2011 � 2018 ($Million)
Table 123 Conductive Polymers: Market Volume, By Geography, 2011 � 2018 (Kilotons)
Table 124 Conductive Polymers: Market Revenue, By Geography, 2011- 2018 ($Million)
Table 125 Oled: Global Conductive Polymer, Market, By Volume (Tons) & Revenue ($Million), 2011 � 2018
Table 126 Capacitors: Conductive Polymer Market, By Volume (Tons) & Revenue ($Million), 2011 � 2018
Table 127 Batteries: Conductive Polymer Market, By Volume (Tons) & Revenue ($Million), 2011 � 2018
Table 128 Transistors: Conductive Polymer Market, By Volume (Tons) & Revenue ($Million), 2011 � 2018
Table 129 Sensors: Conductive Polymer Market, By Volume (Tons) & Revenue ($Million), 2011 � 2018
Table 130 Solar Cell Components: Conductive Polymer Market, By Volume (Tons) & Revenue ($Million), 2011 � 2018
Table 131 Actuators: Conductive Polymer Market, By Volume (Tons) & Revenue ($Million), 2011 � 2018
Table 132 Textile & Fabrics: Conductive Polymer Market, By Volume (Tons) & Revenue ($Million), 2011 � 2018
Table 133 Anti Electromagnetic Interference Equipment: Conductive Polymer Market, By Volume (Tons) & Revenue ($Million), 2011 � 2018
Table 134 Anti-Electrostatic Discharge Equipment: Conductive Polymer Market, By Volume (Tons) & Revenue ($Million), 2011 � 2018
Table 135 Antistatic Packaging: Conductive Polymer Market, By Volume (Tons) & Revenue ($Million), 2011 � 2018
Table 136 Pcep: Conductive Polymer Market, By Volume (Tons) & Revenue ($Million), 2011 � 2018
Table 137 Other Applications: Conductive Polymer Market, By Volume (Tons) & Revenue ($Million), 2011 � 2018
Table 138 North America: Conductive Polymers, Market Volume, By Applications, 2011 � 2018 (Tons)
Table 139 North America: Conductive Polymers, Market Revenue, By Applications, 2011 � 2018 ($Million)
Table 140 U.S.: Conductive Polymers, Market Volume, By Applications, 2011 � 2018 (Tons)
Table 141 U.S.: Conductive Polymers, Market Revnue, By Applications, 2011 � 2018 ($Million)
Table 142 Others: Conductive Polymers, Market Volume, By Applications, 2011 � 2018 (Tons)
Table 143 Others: Conductive Polymers, Market Revenue, By Applications, 2011 � 2018 ($Million)
Table 144 Europe: Conductive Polymers, Market Volume, By Applications, 2011 � 2018 (Tons)
Table 145 Europe: Conductive Polymers, Market Revenue, By Applications, 2011 � 2018 ($Million)
Table 146 Germany: Conductive Polymers, Market Volume, By Applications, 2011 � 2018 (Tons)
Table 147 Germany: Conductive Polymers, Market Revenue, By Applications, 2011 � 2018 ($Million)
Table 148 France: Conductive Polymers, Market Volume, By Applications, 2011 � 2018 (Tons)
Table 149 France: Conductive Polymers, Market Revenue, By Applications, 2011 � 2018 ($Million)
Table 150 U.K.: Conductive Polymers, Market Volume, By Applications, 2011 � 2018 (Tons)
Table 151 U.K.: Conductive Polymers, Market Revenue, By Applications, 2011 � 2018 ($Million)
Table 152 Others: Conductive Polymers, Market Volume, By Applications, 2011 � 2018 (Tons)
Table 153 Others: Conductive Polymers, Market Revenue, By Applications, 2011 � 2018 ($Million)
Table 154 Asia-Pacific: Conductive Polymers, Market Volume, By Applications, 2011 � 2018 (Tons)
Table 155 Asia-Pacific: Conductive Polymers, Market Revenue, By Applications, 2011 � 2018 ($Million)
Table 156 China: Conductive Polymers, Market Volume, By Applications, 2011 � 2018 (Tons)
Table 157 China: Conductive Polymers, Market Revenue, By Applications, 2011 � 2018 ($Million)
Table 158 Japan: Conductive Polymers, Market Volume, By Applications, 2011 � 2018 (Tons)
Table 159 Japan: Conductive Polymers, Market Revenue, By Applications, 2011 � 2018 ($Million)
Table 160 South Korea: Conductive Polymers, Market Volume, By Applications, 2011 � 2018 (Tons)
Table 161 South Korea: Conductive Polymers, Market Revenue, By Applications, 2011 � 2018 ($Million)
Table 162 Others: Conductive Polymers, Market Volume, By Applications, 2011 � 2018 (Tons)
Table 163 Others: Conductive Polymers, Market Revenue, By Applications, 2011 � 2018 ($Million)
Table 164 ROW: Conductive Polymers, Market Volume, By Applications, 2011 � 2018 (Tons)
Table 165 ROW: Conductive Polymers, Market Revenue, By Applications, 2011 � 2018 ($Million)
Table 166 Brazil: Conductive Polymers, Market Volume,By Applications, 2011 � 2018 (Tons)
Table 167 Brazil: Conductive Polymers, Market Revenue, By Applications, 2011 � 2018 ($Million)
Table 168 Others: Conductive Polymers, Market Volume, By Applications, 2011 � 2018 (Tons)
Table 169 Others: Conductive Polymers, Market Revenue, By Applications, 2011 � 2018 ($Million)
Table 170 Nanomaterials: Market Volume, By Geography, 2011 � 2018 (Kilotons)
Table 171 Nanomaterials: Market Revenue, By Geography, 2011 � 2018 ($Million)
Table 172 Chemicals & Materials: Global Nanomaterials Market, By Volume (Kilotons) & Revenue ($Million), 2011 � 2018
Table 173 Electrical & Electronics: Global Nanomaterials Market, By Volume (Kilotons) & Revenue ($Million), 2011 � 2018
Table 174 Healthcare & Pharmaceuticals: Global Nanomaterials Market, By Volume (Kilotons) & Revenue ($Million), 2011 � 2018
Table 175 Aerospace: Global Nanomaterials Market, By Volume (Tons) & Revenue ($Million), 2011 � 2018
Table 176 Other: Global Nanomaterials Market, By Volume (Tons) & Revenue ($Million), 2011 � 2018
Table 177 North America: Nanomaterials Market Volume, By Applications, 2011 � 2018 (Kilotons)
Table 178 North America: Nanomaterials, Market Revenue, By Applications, 2011 � 2018 ($Million)
Table 179 U.S.: Nanomaterials, Market Volume, By Applications, 2011 � 2018 (Kilotons)
Table 180 U.S.: Nanomaterials, Market Revenue, By Applications, 2011 � 2018 ($Million)
Table 181 Other: Nanomaterials, Market Volume, By Applications, 2011 � 2018 (Kilotons)
Table 182 Others: Nanomaterials, Market Revenue, By Applications, 2011 � 2018 ($Million)
Table 183 Europe: Nanomaterials, Market Volume, By Applications, 2011 � 2018 (Kilotons)
Table 184 Europe: Nanomaterials, Market Revenue, By Applications, 2011 � 2018 ($Million)
Table 185 Germany: Nanomaterials, Market Volume, By Applications, 2011 � 2018 (Kilotons)
Table 186 Germany: Nanomaterials, Market Revenue, By Applications, 2011 � 2018 ($Million)
Table 187 France: Nanomaterials, Market Volume, By Applications, 2011 � 2018 (Kilotons)
Table 188 France: Nanomaterials, Market Revenue, By Applications, 2011 � 2018 ($Million)
Table 189 U.K: Nanomaterials, Market Volume, By Applications, 2011 � 2018 (Kilotons)
Table 190 U.K: Nanomaterials, Market Revenue, By Applications, 2011 � 2018 ($Million)
Table 191 Other: Nanomaterials, Market Volume, By Applications, 2011 � 2018 (Kilotons)
Table 192 Others: Nanomaterials, Market Revenue, By Applications, 2011 � 2018 ($Million)
Table 193 Asia-Pacific: Nanomaterials, Market Volume, By Applications, 2011 � 2018 (Kilotons)
Table 194 Asia-Pacific: Nanomaterials, Market Revenue, By Applications, 2011 � 2018 ($Million)
Table 195 China: Nanomaterials, Market Volume, By Applications, 2011 � 2018 (Kilotons)
Table 196 China: Nanomaterials, Market Revenue, By Applications, 2011 - 2018 ($Million)
Table 197 Japan: Nanomaterials, Market Volume, By Applications, 2011 � 2018 (Kilotons)
Table 198 Japan: Nanomaterials, Market Revenue, By Applications, 2011 � 2018 ($Million)
Table 199 South Korea: Nanomaterials, Market Volume, By Applications, 2011 � 2018 (Kilotons)
Table 200 South Korea: Nanomaterials, Market Revenue, By Applications, 2011 � 2018 ($Million)
Table 201 Other: Nanomaterials, Market Volume, By Applications, 2011 � 2018 (Kilotons)
Table 202 Other: Nanomaterials, Market Revenue, By Applications, 2011 - 2018 ($Million)
Table 203 Row: Nanomaterials, Market Volume, By Applications, 2011 � 2018 (Kilotons)
Table 204 Row: Nanomaterials, Market Revenue, By Applications, 2011 � 2018 ($Million)
Table 205 Brazil: Nanomaterials, Market Volume, By Applications, 2011 � 2018 (Kilotons)
Table 206 Brazil: Nanomaterials, Market Revenue, By Applications, 2011 � 2018 ($Million)
Table 207 Other: Nanomaterials, Market Volume, By Applications, 2011 � 2018 (Kilotons)
Table 208 Other: Nanomaterials, Market Revenue, By Applications, 2011 � 2018 ($Million)
Table 209 Mergers & Acquisitions
Table 210 New Products Launch/Developments, 2010 � 2013
Table 211 Agreements & Collaborations, 2010 � 2013
Table 212 Expansions 2010 � 2013
Table 213 3A Composites: Products & Its Applications
Table 214 3M: Annual Revenue, By Business Segment, 2011 � 2012 ($Million)
Table 215 3M: Products & Its Applications
Table 216 Air Products: Annual Revenue, By Business Segment, 2011 - 2012 ($Million)
Table 217 Air Products: Products & Its Applications
Table 218 Ametek: Annual Revenue, By Business Segment, 2011 - 2012 ($Million)
Table 219 Ametek: Products & Its Applications
Table 220 Applied Materials: Annual Revenue, By Business Segment, 2011 - 2012 ($Million)
Table 221 Applied Material: Products & Its Applications
Table 222 Applied Nanotech: Products & Its Applications
Table 223 Bayer Ag: Annual Revenue, By Business Segment, 2011 - 2012 ($Million)
Table 224 Bayer Ag: Products & Its Applications
Table 225 CDT: Products & Its Applications
Table 226 CNANO: Products & Its Applications
Table 227 Ceradyne: Annual Revenue, By Business Segment, 2010 � 2011 ($Million)
Table 228 Ceradyne: Products & Its Applications
Table 229 CPS: Products & Its Applications
Table 230 Crosslink: Products & Its Applications
Table 231 Deutsche Edelstahlwerke: Products & Its Applications
Table 232 Dupont: Annual Revenue, By Business Segment, 2011 - 2012 ($Million)
Table 233 Dupont: Products & Its Applications
Table 234 Kyocera: Annual Revenue, By Business Segment, 2011 - 2012 ($Million)
Table 235 Kyocera: Products & Its Applications
Table 236 LDK Solar: Annual Revenue, By Business Segment, 2011 - 2012 ($Million)
Table 237 LDK Solar: Products & Its Applications
Table 238 Materion: Annual Revenue, By Business Segment, 2011 - 2012 ($Million)
Table 239 Materion: Products & Its Applications
Table 240 Momentive Performance Materials: Annual Revenue, By Business Segment, 2011 � 2012 ($Million)
Table 241 Momentive Performance Materials: Products & Its Applications
Table 242 Murata: Annual Revenue, By Business Segment, 2011 - 2012 ($Million)
Table 243 Murata: Products & Its Applications
Table 244 Renesola: Annual Revenue, By Business Segment, 2011 - 2012 ($Million)
Table 245 Renesola: Annual Revenue, By Product Segment, 2011 - 2012 ($Million)
Table 246 Renesola: Products & Its Applications
Table 247 Samsung Electro-Mechanics: Annual Revenue, By Business Segment, 2010 - 2011, ($Million)
Table 248 Samsung Electro-Mechanics: Products & Its Applications
Table 249 Sunedison: Annual Revenue, By Business Segment, 2011 � 2012 ($Million)
Table 250 Sunedison: Products & Its Applications
Table 251 SDK: Annual Revenue, By Business Segment, 2011 � 2012 ($Million)
Table 252 SDK: Products & Its Applications
Table 253 Wacker Chemie: Annual Revenue, By Business Segment, 2011 - 2012 ($Million)
Table 254 Wacker Chemie: Products & Its Applications
List Of Figures (48 Figures)
Figure 1 Advanced Functional Material Market Share, By Geography, 2012
Figure 2 Advanced Functional Materials Market Share, By Category, 2012
Figure 3 Advanced Functional Material Global Market Segments
Figure 4 Advanced Functional Materials Market Dynamics
Figure 5 Advanced Functional Material Global Market: Drivers Vs Restraints
Figure 6 Advanced Functional Materials Porter�s Five Forces Analysis
Figure 7 Advanced Functional Material Regional Market Life Cycle
Figure 8 Advanced Functional Materials Global & Regional Overview
Figure 9 Advanced Functional Material Competitive Analysis
Figure 10 Advanced Functional Materials Market Revenue, 2011 Vs 2018 ($Million)
Figure 11 Advanced Functional Material Market Share, By Applications, 2012
Figure 12 Advanced Functional Materials For Low Carbon Application Value Chain
Figure 13 Impact Of Major Drivers On Advanced Functional Material Market, 2013 � 2018
Figure 14 Impact Of Major Restraints On Advanced Functional Materials Market, 2013 � 2018
Figure 15 Impact Of Major Opportunities On Advanced Functional Material Market, 2013 � 2018
Figure 16 Asia-Pacific: Passenger Vehicle Market Volume, 2011 � 2012 (Thousand Units)
Figure 17 Porter�s Five Forces Analysis
Figure 18 Advanced Functional Material Market: Patent Analysis, By Category, 2009 � 2013
Figure 19 Advanced Functional Materials Patent Analysis, By Geography, 2009 � 2013
Figure 20 Advanced Functional Material Patent Trends, By Category, 2009 � 2013
Figure 21 Global Advanced Functional Ceramics: Market Revenue Share, By Applications, 2012
Figure 22 North America: Advanced Functional Ceramics, Market Share, By Countries, 2012
Figure 23 Europe: Advanced Functional Ceramics, Market Share, By Countries, 2012
Figure 24 Asia-Pacific: Advanced Functional Ceramics, Market Share, By Countries, 2012
Figure 25 ROW: Advanced Functional Ceramics, Market Share, By Countries, 2012
Figure 26 Global Advanced Functional Composites Market: Revenue Share, By Applications, 2012
Figure 27 North America: Advanced Functional Composites, Market Share, By Countries, 2012
Figure 28 Europe: Advanced Functional Composites, Market Share, By Countries, 2012
Figure 29 Asia-Pacific; Advanced Functional Composites, Market Share, By Countries, 2012
Figure 30 ROW: Advanced Functional Composites, Market Share, By Countries, 2012
Figure 31 North America: Advanced Energy Materials, Market Share, By Countries, 2012
Figure 32 Europe: Advanced Energy Materials, Market Share, By Countries, 2012
Figure 33 Asia-Pacific: Advanced Energy Materials, Market Share, By Countries, 2012
Figure 34 ROW: Advanced Energy Materials, Market Share, By Countries, 2012
Figure 35 Global Conductive Polymer Market: Revenue Share, By Applications, 2012
Figure 36 North America: Conductive Polymer, Market Share, By Countries, 2012
Figure 37 Europe: Conductive Polymer, Market Share,By Countries,2012236
Figure 38 Asia-Pacific: Conductive Polymer, Market Share, By Countries, 2012
Figure 39 ROW: Conductive Polymer, Market Share, By Countries, 2012
Figure 40 Global Nanomaterials Market: Revenue Share, By Applications, 2012
Figure 41 North America: Nanomaterials, Market Share, By Countries, 2012
Figure 42 Europe: Nanomaterials, Market Share, By Countries, 2012
Figure 43 Asia-Pacific: Nanomaterials, Market Share, By Countries, 2012
Figure 44 ROW: Nanomaterials, Market Share, By Countries, 2012
Figure 45 Advanced Functional Materials Market Share, By Growth Strategies, 2010 � 2013
Figure 46 Advanced Functional Material Developments In Low Carbon Applications Market, 2010 - 2013
Figure 47 Advanced Functional Materials Growth Strategies, By Geography, 2010 � 2013
Figure 48 Advanced Functional Material Growth Strategies, By Companies, 2010 � 2013


Growth opportunities and latent adjacency in Advanced Functional Material Market