Agricultural Dyes & Pigments Market by Type (Dyes and Pigments), Application (Seed Treatment, Fertilizers, Crop Protection Products, Turf & Ornamental, Pond/Lake Color & Others), and by Region - Global Forecasts to 2020


The agricultural dyes & pigments market is estimated to be valued at USD 1.51 Billion in 2015. The market is projected to grow at a CAGR of 4.3% from 2015 to 2020. The agricultural dyes & pigments market is segmented on the basis of its types and applications. It is further segmented on the basis of regions, such as North America, Europe, Asia-Pacific, Latin America, and Rest of the World (RoW). The years considered for the study are:
- Base Year � 2014
- Estimated Year � 2015
- Projected Year � 2020
- Forecast Period � 2015 to 2020
Research Methodology:
This report includes estimations of market sizes for value (USD million) and volume (KT). Both top-down and bottom-up approaches have been used to estimate and validate the size of the global agricultural dyes & pigments market and to estimate the size of various other submarkets. Key players in the market have been identified through secondary research, and their market share in respective regions has been determined through primary and secondary research. All percentage shares, splits, and breakdowns have been determined using secondary sources and were verified through primary sources.
includes qualitative and quantitative analyses of the agricultural dyes & pigments market, competitive landscape, and the preferred development strategies of key players. The report also analyzes the market dynamics and issues faced by leading players.
Market Ecosystem:
The upstream players such as the raw material suppliers of the agricultural dyes & pigments and the downstream stakeholders such as the manufacturers and end-user industries of the agricultural dyes & pigments influence the global agricultural dyes & pigments market.
Target Audience:
The report is targeted toward the existing players in the industry, which include fertilizer & agrochemical manufacturers, turf & ornamental manufacturers, seed treatment & crop protection manufacturers, pond/lake color manufacturers, and research institutions. Key participants in the supply chain of agricultural dyes & pigments are raw material suppliers, government bodies, distributors, and end users.
Companies who offer agricultural dyes & pigments to end users have been included such as Bayer CropScience AG (Germany) and BASF SE (Germany).
�The study answers several questions for stakeholders, primarily which market segments to focus on in next two to five years for prioritizing efforts and investments�.
Get online access to the report on the World's First Market Intelligence Cloud
Request Sample Scope of the Report

On the basis of type, the market is segmented as follows:
- Dyes
- Pigments
On the basis of application, the market is segmented as follows:
- Seed Treatment
- Fertilizers
- Crop Protection Products
- Turf & Ornamental
- Pond/Lake Color
- Others including bio-stimulants & plant growth regulators
On the basis of region, the market is segmented as follows:
- North America
- Europe
- Asia-Pacific
- Latin America
- RoW
Available Customizations
With the given market data, MarketsandMarkets offers customizations according to the company�s specific needs.
The following customization options are available for the report:
Product Analysis
- Product matrix, which gives a detailed comparison of the product portfolio of each company
Company Information
- Detailed analysis and profiling of additional market players (up to five)
The agricultural dyes & pigments market is projected to grow at a CAGR of 4.3% from 2015 to reach a projected value of USD 1.86 Billion by 2020. The market growth is driven by increasing demand from end-user industries such as fertilizer industry, turf & ornamental industry & pond/lake color management industry. Further, the increasing number of applications such as use of dyes & pigments in seed treatment, seed coating, seed dressing and crop protection products. The market is further driven by factors such as advanced farming technologies and its multi-functional uses.
Depending upon the applications, the agricultural dyes & pigments market is led by the turf & ornamentals segment, followed by pond/lake color. Pond/lakes and turf & ornamental are the major applications for the agricultural dyes & pigments market. Pond water is generally cloudy, dull, and dirty brown in appearance. Thus, dyes and pigments are added to the lakes and ponds, which has special UV filtering properties that protect the ponds and lakes and maintains its natural color shading by limiting algae growth. Further, turf paint is preferred by most number of people for imparting lawns and gardens with color. Among the types of agricultural dyes & pigments, i.e., dyes and pigments, pigments accounted for the largest market share in 2014, followed by dyes.
North America accounted for the largest share in the agricultural dyes & pigments market, followed Europe and Latin America. Adoption of agriculture dyes & pigments in emerging countries such as Brazil, South Africa, and Argentina is increasing, which is promoted by agronomic benefits in terms of yield and protection. The North American region is projected to be the fastest-growing market with investments from several multinational manufacturers, especially in countries such as the U.S., Canada, and Mexico.

The different government regulations in different countries related to the usage of agricultural dyes & pigments and growing environmental concerns such as contamination of groundwater and soil pollution may hinder the growth of the agricultural dyes & pigments market.
The key market players that dominated the agricultural dyes & pigments market include Bayer CropScience AG (Germany), BASF SE (Germany), Clariant International AG (Switzerland), Chromatech Incorporated (U.S.), and INCOTEC Group BV (The Netherlands). Most key participants have been exploring new regions through new product launches across the globe, to avail a competitive advantage through combined synergies.
Table of Contents
1 Introduction (Page No. - 16)
1.1 Objectives of the Study
1.2 Market Definition
1.2.1 Markets Covered
1.3 Years Considered for the Study
1.4 Currency
1.5 Stakeholders
2 Research Methodology (Page No. - 19)
2.1 Research Data
2.1.1 Secondary Data
2.1.1.1 Key Data From Secondary Sources
2.1.2 Primary Data
2.1.2.1 Key Data From Primary Sources
2.1.2.2 Key Industry Insights
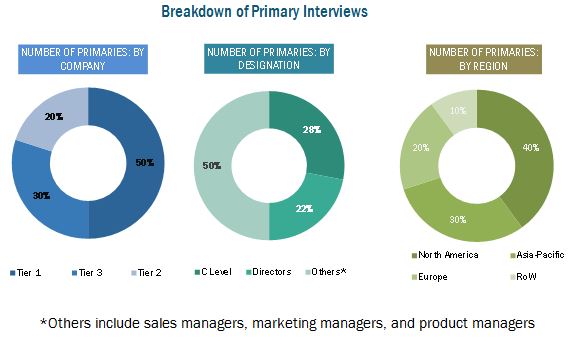
2.1.2.3 Breakdown of Primary Interviews
2.2 Factor Analysis
2.2.1 Introduction
2.2.2 Demand-Side Analysis
2.2.2.1 Increasing Farm Expenditure
2.2.3 Supply-Side Analysis
2.2.3.1 Fluctuations in Raw Material Prices
2.2.3.2 Research & Development
2.3 Market Size Estimation
2.3.1 Bottom-Up Approach
2.3.2 Top-Down Approach
2.4 Market Breakdown & Data Triangulation
2.4.1 Data Triangulation
2.5 Research Assumptions & Limitations
2.5.1 Assumptions
2.5.2 Limitations
3 Executive Summary (Page No. - 31)
3.1 Overview
4 Premium Insights (Page No. - 35)
4.1 Attractive Opportunities in Agricultural Dyes & Pigments Market
4.2 Agricultural Dyes & Pigments Market Across Different Regions
4.3 Agricultural Dyes & Pigments Market Potential
4.4 Agricultural Dyes & Pigments Life Cycle Analysis, By Region
5 Market Overview (Page No. - 39)
5.1 Introduction
5.2 Market Segmentation
5.2.1 Agricultural Dyes & Pigments Market, By Type
5.2.2 Agricultural Dyes & Pigments Market, By Application
5.3 Market Dynamics
5.3.1 Market Drivers
5.3.1.1 Increasing Demand From End-User Industries
5.3.1.2 Advanced Farming Technologies
5.3.1.3 Multi-Functional Benefits
5.3.2 Market Restraints
5.3.2.1 Avoidance By Fertilizer Manufacturers
5.3.2.2 Stringent Government Regulations
5.3.2.3 Growing Environmental Considerations
5.3.3 Market Opportunities
5.3.3.1 Green-Field Investments
5.3.3.2 Development of Environment-Friendly Agricultural Dyes & Pigments
5.3.4 Challenge
5.3.4.1 Colored Mulches: an Environmental Concern
5.4 Porter�s Analysis
5.4.1 Bargaining Power of Suppliers
5.4.2 Bargaining Power of Buyers
5.4.3 Threat of New Entrants
5.4.4 Threat of Substitutes
5.4.5 Intensity of Competetive Rivalry
6 Industry Trends (Page No. - 55)
6.1 Introduction
6.2 Supply Chain Analysis
6.3 Value Chain Analysis
6.4 Industry Insights
6.4.1 Prominent Companies
6.4.2 Small & Medium Enterprises
7 Regulations in Agricultural Dyes & Pigments Market (Page No. - 58)
7.1 Introduction
7.2 Electronic Code of Federal Regulations, U.S.
7.3 Environmental Protection Agency (EPA), U.S.
7.4 Japan External Trade Organization, Japan
7.5 Philippines National Standard of Organic Farming
8 Agricultural Dyes & Pigments Market, By Brand (Page No. - 60)
8.1 Introduction
8.2 Stressgard
8.3 Pro�Ized Seed Colorant
8.4 Color Coat Colorants
8.5 Starburst Mulch Colorant
8.6 Impact Mulch Colorant
8.7 Poly Tree Rubber Colorant
8.8 Mulch Magic Mulch Colorant
8.9 Sensipro
8.10 Agrocer
8.11 PV Fast
8.12 Chromatint
9 Agricultural Dyes & Pigments Market, By Type (Page No. - 68)
9.1 Introduction
9.2 Dyes
9.2.1 Types of Dyes
9.2.1.1 Water-Soluble Dyes
9.2.1.2 Solvent-Soluble Dyes
9.3 Pigments
9.3.1 Types of Pigments
9.3.1.1 Organic Pigments
9.3.1.2 Inorganic Pigments
10 Agricultural Dyes & Pigments Market, By Application (Page No. - 74)
10.1 Introduction
10.2 Seed Treatment
10.2.1 Crop (Agriculture) Seed
10.2.1.1 Insecticides
10.2.1.2 Fungicides
10.2.1.3 Inoculants
10.2.1.4 Others
10.2.2 Grass (TURF) Seeds
10.2.2.1 Insecticides
10.2.2.2 Fungicides
10.2.2.3 Inoculants
10.2.2.4 Others
10.3 Fertilizers
10.3.1 By Type
10.3.1.1 Nitrogen
10.3.1.2 Phosphorus
10.3.1.3 Potassium
10.3.1.4 Micronutrients
10.3.1.5 Others
10.3.2 By End-Use Form
10.3.2.1 Water-Soluble Fertilizers (Granules)
10.3.2.2 Liquid Fertilizers
10.3.2.3 Controlled-Release Fertilizers
10.3.2.4 Slow-Release Fertilizers
10.3.2.5 Others
10.3.3 Crop Protection Products
10.3.3.1 Insecticides
10.3.3.2 Fungicides
10.3.3.3 Inoculants
10.3.3.4 Others
10.3.4 TURF & Ornamentals
10.3.5 Pond Color/Lake Color
10.3.6 Others
11 Agricultural Dyes & Pigments Market, By Region (Page No. - 98)
11.1 Introduction
11.2 North America
11.2.1 U.S.
11.2.2 Canada
11.2.3 Mexico
11.3 Europe
11.3.1 France
11.3.2 Germany
11.3.3 Russia
11.3.4 Rest of Europe
11.4 Asia-Pacific
11.4.1 China
11.4.2 India
11.4.3 Australia
11.4.4 Rest of Asia-Pacific
11.5 Latin America
11.5.1 Brazil
11.5.2 Argentina
11.5.3 Rest of Latin America
11.6 RoW
11.6.1 South Africa
11.6.2 Other Countries in RoW
12 Competitive Landscape (Page No. - 132)
12.1 Overview
12.2 Competitive Situation & Trends
12.2.1 Expansions
12.2.2 New Product Launches
12.2.3 Acquisitions
12.2.4 Partnerships, Collaborations, Agreements & Joint Ventures
12.2.5 Investments
13 Company Profiles (Page No. - 138)
(Company at A Glance, Recent Financials, Products & Services, Strategies & Insights, & Recent Developments)*
13.1 Introduction
13.2 BASF SE Company
13.3 Bayer Cropscience AG
13.4 Clariant International AG
13.5 Croda International PLC
13.6 Incotec Group Bv
13.7 Sun Chemical Corporation
13.8 Brettyoung
13.9 Germains Seed Technology Inc.
13.10 Organic Dyes & Pigments
13.11 Keystone Aniline Corporation
13.12 Chromatech Incorporated
*Details on Company at A Glance, Recent Financials, Products & Services, Strategies & Insights, & Recent Developments Might Not Be Captured in Case of Unlisted Companies.
14 Appendix (Page No. - 169)
14.1 Discussion Guide
14.2 Company Developments
14.2.1 Expansions
14.2.2 New Product Launches
14.2.3 Acquisitions
14.2.4 Partnerships, Collaborations, Agreements & Joint Ventures
14.3 Introducing RT: Real Time Market Intelligence
14.4 Available Customizations
14.5 Related Reports
List of Tables (97 Tables)
Table 1 Stressgard: Product Range
Table 2 Pro�Ized Seed Colorant: Product Range
Table 3 Color Coat Colorants: Product Range
Table 4 Starburst Mulch Colorant: Product Range
Table 5 Impact Mulch Colorant: Product Range
Table 6 Poly Tree Rubber Colorant: Product Range
Table 7 Mulch Magic Mulch Colorant: Product Range
Table 8 Sensipro: Product Range
Table 9 Agrocer: Product Range
Table 10 PV Fast: Product Range
Table 11 Chromatint: Product Range
Table 12 Agricultural Dyes & Pigments Market Size, By Type, 2013�2020 (USD Million)
Table 13 Agricultural Dyes & Pigments Market Size, By Type, 2013�2020 (KT)
Table 14 Agricultural Dyes & Pigments Market Size, By Dye Type, 2013�2020 (USD Million)
Table 15 Agricultural Dyes & Pigments Market Size, By Dye Type, 2013�2020 (KT)
Table 16 Agricultural Dyes & Pigments Market Size, By Pigment Type, 2013�2020 (USD Million)
Table 17 Agricultural Dyes & Pigments Market Size, By Pigment Type, 2013�2020 (KT)
Table 18 Agricultural Dyes & Pigments Market Size, By Application, 2013�2020 (USD Million)
Table 19 Agricultural Dyes & Pigments Market Size, By Application, 2013�2020 (KT)
Table 20 EPA Approved Dyes for Seed Treatment Materials
Table 21 Seed Treatment Market Size, By Type, 2013�2020 (USD Million)
Table 22 Seed Treatment Market Size, By Type, 2013�2020 (KT)
Table 23 Crop (Agriculture) Seed Market Size, By Type, 2013�2020 (USD Million)
Table 24 Crop (Agriculture) Seed Market Size, By Type, 2013�2020 (KT)
Table 25 Grass (TURF) Seed Market Size, By Type, 2013�2020 (USD Million)
Table 26 Grass (TURF) Seed Market Size, By Type, 2013�2020 (KT)
Table 27 Agricultural Dyes & Pigments for Fertilizers & Pesticides
Table 28 Fertilizers Market Size, By Type, 2013�2020 (USD Million)
Table 29 Fertilizers Market Size, By Type, 2013�2020 (KT)
Table 30 Agricultural Dyes & Pigments By Chromatech Europe B.V. (Europe) Designed for Application in Water Soluble Fertilizers
Table 31 Fertilizers Market Size, By End-Use Form, 2013�2020 (USD Million)
Table 32 Fertilizers Market Size, By End-Use Form, 2013�2020 (KT)
Table 33 Crop Protection Products & Protection Against Specific Crops
Table 34 Crop Protection Products Market Size, By Type, 2013�2020 (USD Million)
Table 35 Crop Protection Products Market Size, By Type, 2013�2020 (KT)
Table 36 Agricultural Dyes & Pigments Market Size, By Region, 2013-2020 (USD Million)
Table 37 North America: Agricultural Dyes & Pigments Market Size, By Type, 2013-2020 (USD Million)
Table 38 North America: Agricultural Dyes & Pigments Market Size, By Type, 2013-2020 (KT)
Table 39 North America: Agricultural Dyes & Pigments Market Size, By Application, 2013-2020 (USD Million)
Table 40 North America: Agricultural Dyes & Pigments Market Size, By Application, 2013-2020 (KT)
Table 41 U.S.: Agricultural Dyes & Pigments Market Size, By Type, 2013-2020 (USD Million)
Table 42 U.S.: Agricultural Dyes & Pigments Market Size, By Type, 2013-2020 (KT)
Table 43 Canada: Agricultural Dyes & Pigments Market Size, By Type, 2013-2020 (USD Million)
Table 44 Canada: Agricultural Dyes & Pigments Market Size, By Type, 2013-2020 (KT)
Table 45 Mexico: Agricultural Dyes & Pigments Market Size, By Type, 2013-2020 (USD Million)
Table 46 Mexico: Agricultural Dyes & Pigments Market Size, By Type, 2013-2020 (KT)
Table 47 Europe: Agricultural Dyes & Pigments Market Size, By Type, 2013-2020 (USD Million)
Table 48 Europe: Agricultural Dyes & Pigments Market Size, By Type, 2013-2020 (KT)
Table 49 Europe: Agricultural Dyes & Pigments Market Size, By Application, 2013-2020 (USD Million)
Table 50 Europe: Agricultural Dyes & Pigments Market Size, By Application, 2013-2020 (KT)
Table 51 France: Agricultural Dyes & Pigments Market Size, By Type, 2013-2020 (USD Million)
Table 52 France: Agricultural Dyes & Pigments Market Size, By Type, 2013-2020 (KT)
Table 53 Germany: Agricultural Dyes & Pigments Market Size, By Type, 2013-2020 (USD Million)
Table 54 Germany: Agricultural Dyes & Pigments Market Size, By Type, 2013-2020 (KT)
Table 55 Russia: Agricultural Dyes & Pigments Market Size, By Type, 2013-2020 (USD Million)
Table 56 Russia: Agricultural Dyes & Pigments Market Size, By Type, 2013-2020 (KT)
Table 57 Rest of Europe: Agricultural Dyes & Pigments Market Size, By Type, 2013-2020 (USD Million)
Table 58 Rest of Europe: Agricultural Dyes & Pigments Market Size, By Type, 2013-2020 (KT)
Table 59 Asia-Pacific: Agricultural Dyes & Pigments Market Size, By Type, 2013-2020 (USD Million)
Table 60 Asia-Pacific: Agricultural Dyes & Pigments Market Size, By Type, 2013-2020 (KT)
Table 61 Asia-Pacific: Agricultural Dyes & Pigments Market Size, By Application, 2013-2020 (USD Million)
Table 62 Asia-Pacific: Agricultural Dyes & Pigments Market Size, By Application, 2013-2020 (KT)
Table 63 China: Agricultural Dyes & Pigments Market Size for Environmental Management, By Type, 2013�2020 (USD Million)
Table 64 China: Agricultural Dyes & Pigments Market Size, By Type, 2013�2020 (KT)
Table 65 India: Agricultural Dyes & Pigments Market Size, By Type, 2013�2020 (USD Million)
Table 66 India: Agricultural Dyes & Pigments Market Size, By Type, 2013�2020 (KT)
Table 67 Australia: Agricultural Dyes & Pigments Market Size, By Type, 2013�2020 (USD Million)
Table 68 Australia: Agricultural Dyes & Pigments Market Size, By Type, 2013�2020 (KT)
Table 69 Rest of Asia-Pacific: Agricultural Dyes & Pigments Market, By Type, 2013�2020 (USD Million)
Table 70 Rest of Asia-Pacific: Agricultural Dyes & Pigments Market Size, By Type, 2013�2020 (KT)
Table 71 Latin America: Agricultural Dyes & Pigments Market Size, By Type, 2013-2020 (USD Million)
Table 72 Latin America: Agricultural Dyes & Pigments Market Size, By Type, 2013-2020 (KT)
Table 73 Latin America: Agricultural Dyes & Pigments Market Size, By Application, 2013-2020 (USD Million)
Table 74 Latin America: Agricultural Dyes & Pigments Market Size, By Application, 2013-2020 (KT)
Table 75 Brazil: Agricultural Dyes & Pigments Market Size, By Type, 2013�2020 (USD Million)
Table 76 Brazil: Agricultural Dyes & Pigments Market Size By Type, 2013�2020 (KT)
Table 77 Argentina: Agricultural Dyes & Pigments Market, By Type, 2013�2020 (USD Million)
Table 78 Argentina: Agricultural Dyes & Pigments Market, By Type, 2013�2020 (KT)
Table 79 Rest of Latin America: Agricultural Dyes & Pigments Market, By Type, 2013�2020 (USD Million)
Table 80 Rest of Latin America: Agricultural Dyes & Pigments Market Size, By Type, 2013�2020 (KT)
Table 81 RoW: Agricultural Dyes & Pigments Market Size, By Type, 2013-2020 (USD Million)
Table 82 RoW: Agricultural Dyes & Pigments Market Size, By Type, 2013-2020 (KT)
Table 83 RoW: Agricultural Dyes & Pigments Market Size, By Application, 2013-2020 (USD Million)
Table 84 RoW: Agricultural Dyes & Pigments Market Size, By Application, 2013-2020 (KT)
Table 85 South Africa: Agricultural Dyes & Pigments Market Size, By Type, 2013�2020 (USD Million)
Table 86 South Africa: Agricultural Dyes & Pigments Market Size For, By Type, 2013�2020 (KT)
Table 87 Other Countries in RoW: Agricultural Dyes & Pigments Market Size, By Type, 2013�2020 (USD Million)
Table 88 Other Countries in RoW: Agricultural Dyes & Pigments Market Size, By Type, 2013�2020 (KT)
Table 89 Expansions, 2015
Table 90 New Product Launches, 2015
Table 91 Acquisitions, 2013�2015
Table 92 Partnerships, Collaborations, Agreements & Joint Ventures, 2014�2015
Table 93 Investments, 2012�2013
Table 94 Expansions, 2010�2015
Table 95 New Product Launches, 2010�2015
Table 96 Acquisitions, 2010�2015
Table 97 Partnerships, Collaborations, Agreements & Joint Ventures, 2010�2015
List of Figures (53 Figures)
Figure 1 Agricultural Dyes & Pigments Market Segmentation
Figure 2 Research Design
Figure 3 U.S. Agricultural Farm Expenditure, 2013 vs 2014 (USD Million)
Figure 4 Fluctuations in Raw Material Prices, 2000 to 2014 (USD Per Mt/BBL)
Figure 5 Public Expenditure on Agricultural Research & Development, By Region
Figure 6 Market Size Estimation Methodology: Bottom-Up Approach
Figure 7 Market Size Estimation Methodology: Top-Down Approach
Figure 8 Agricultural Dyes & Pigments Market, By Type (2015 vs 2020)
Figure 9 Agricultural Dyes & Pigments Market, By Application (2015 vs 2020)
Figure 10 Agricultural Dyes & Pigments Market Trend, By Region, 2014
Figure 11 North America is Projected to Be the Fastest-Growing Market By 2020
Figure 12 Agricultural Dyes & Pigments Market Value is Estimated to Reach USD 1,863.5 Million By 2020
Figure 13 North America Accounted for Major Share in Agricultural Dyes & Pigments Market in 2015
Figure 14 North America is Projected to Grow at the Highest CAGR During the Period 2015-2020
Figure 15 North American Market is Expected to Continue to Grow at an Exponential Rate During the Forecast Period
Figure 16 By Type
Figure 17 By Application
Figure 18 Agricultural Dyes & Pigments: Drivers, Restraints, Opportunities & Challenge
Figure 19 Annual Crop Protection Market Size Analysis, 2011�2016 (USD Million)
Figure 20 Annual Seed Treatment Market Size Analysis, 2011�2016 (USD Million)
Figure 21 Porter�s Five Force Analysis: Agricultural Dyes & Pigments Market
Figure 22 Distribution Channel Plays A Vital Role in the Supply Chain for Agricultural Dyes & Pigments
Figure 23 Value Chain of Agricultural Dyes & Pigments
Figure 24 Agricultural Dyes & Pigments Market, 2015 vs 2020 (USD Million)
Figure 25 Agricultural Dyes Market
Figure 26 Agricultural Pigments Market, 2015 vs 2020 (USD Million)
Figure 27 Agricultural Dyes & Pigments Market Segmentation, By Application
Figure 28 TURF & Ornamental Segment is Projected to Grow at A Highest CAGR for the Period Between 2015-2020
Figure 29 Seed Treatment Market Size, By Type, 2015 vs 2020 (USD Million)
Figure 30 Global Sales of Seed Treatment Applications (% Market Share)
Figure 31 Crop (Agriculture) Seed Market Size, By Type, 2015 vs 2020 (USD Million)
Figure 32 Grass (TURF) Seed Market Size, By Type, 2015 vs 2020 (USD Million)
Figure 33 Fertilizers Market Size, By Type, 2015 vs 2020 (USD Million)
Figure 34 Fertilizers Market Size, By End Use, 2015 vs 2020 (USD Million)
Figure 35 Crop Protection Products Market Size, By Type, 2015 vs 2020 (USD Million)
Figure 36 Geographic Snapshot (2015-2020): Rapidly Growing Markets are Emerging as New Hot Spots
Figure 37 North American Agricultural Dyes & Pigments Market: A Snapshot
Figure 38 European Agricultural Dyes & Pigments Market: A Snapshot
Figure 39 Asia-Pacific Agricultural Dyes & Pigments Market: A Snapshot
Figure 40 Expansions and New Product Launches Were Preferred By Key Agricultural Dyes & Pigments Companies From 2010 to 2015
Figure 41 Expansions Fueled Growth of Agricultural Dyes & Pigments Between 2010 to 2015
Figure 42 Expansions & New Product Launches: the Key Strategies, 2010-2015
Figure 43 Geographic Revenue Mix of Top Five Market Players
Figure 44 BASF SE : Company Snapshot
Figure 45 BASF SE Company: SWOT Analysis
Figure 46 Bayer Cropscience AG Company: Company Snapshot
Figure 47 Bayer Cropscience AG: SWOT Analysis
Figure 48 Clariant International AG : Company Snapshot
Figure 49 Clariant International AG : SWOT Analysis
Figure 50 Croda International PLC: Company Snapshot
Figure 51 Croda International PLC : SWOT Analysis
Figure 52 Incotec Group BV: Company Snapshot
Figure 53 Sun Chemical Corporation: SWOT Analysis


Growth opportunities and latent adjacency in Agricultural Dyes & Pigments Market