
Algaecides Market by Type (Copper Sulfate, Chelated Copper, QAC, Peroxyacetic Acid & Hydrogen Dioxide), Application (Surface Water Treatment, Aquaculture, Sports & Recreational Centers, Agriculture), Form, and Region - Global Forecast to 2022
Market Segmentation
| Report Metrics | Details |
|
Market size available for years |
2016 - 2022 |
|
CAGR % |
6.52 |
Top 10 companies in Algaecides Market


The algaecides market was valued at USD 1.81 Billion in 2015. It is projected to grow at a CAGR of 6.52% from 2016, to reach USD 2.79 Billion by 2022. The base year considered for the study is 2015 and the forecast period is from 2016 to 2022. The objectives of the study are to define, segment, and measure the size of the algaecides market with respect to its type, application, mode of action, form, and region. The report also aims to provide detailed information about the crucial factors influencing the growth of the market, strategical analysis of micro-markets, opportunities for stakeholders, details of competitive landscape, and profile of the key players with respect to their market share and competencies.
This report includes estimations of the market size in terms of value (USD million). Both, top-down and bottom-up approaches have been used to estimate and validate the size of the global algaecides market and to estimate the size of various other dependent submarkets in the overall market. Key players in the market have been identified through secondary research; some of the sources are press releases, annual reports, and financial journals, and paid databases such as Factiva and Bloomberg. All percentage shares, splits, and breakdowns have been determined using secondary sources and verified through primary sources. The figure below shows the breakdown of profiles of industry experts that participated in the primary discussions.
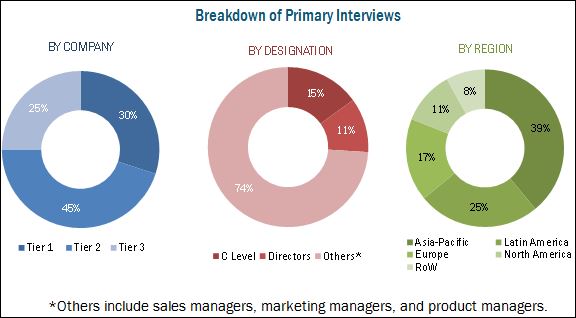
To know about the assumptions considered for the study, download the pdf brochure
The key players that have been profiled in this report include BASF SE (Germany), The Dow Chemical Company (U.S.), Nufarm Limited (Australia), Lonza Group AG (Switzerland), UPL Limited (India), SePRO Corporation (U.S.), Waterco Limited (Australia), BioSafe Systems, LLC (U.S.), Airmax, Inc. (U.S.), and Oreq Corporation (U.S.).
This report is targeted at the existing players in the industry, which are as follows:
- Chemical manufacturers and biotechnological companies
- Chemical traders, suppliers, and distributors
- Public health and professional service providers related to algae control
- Research and development organizations
- Government authorities and agencies related to public health, environment, and agriculture [U.S. Environmental Protection Agency (U.S. EPA)]
“The study answers several questions for stakeholders, primarily which market segments to focus on in next two to five years for prioritizing efforts and investments”.
Get online access to the report on the World's First Market Intelligence Cloud
Request Sample Scope of the Report

On the basis of Type, the market has been segmented as follows:
- Copper sulfate
- Chelated copper
- Quaternary ammonium compounds
- Peroxyacetic acid & hydrogen dioxide
- Dyes and colorants
- Other algaecides & disinfectants (phosphate removers, biologicals, endothall & 2,4-D salts, and glyphosate)
On the basis of Application, the market has been segmented as follows:
- Surface water treatment
- Aquaculture
- Sports & recreational centers
- Agriculture
- Others (industrial water treatment and private households)
On the basis of Form, the market has been segmented as follows:
- Granular crystal
- Liquid
- Pellet
On the basis of Mode of Action, the market has been segmented as follows:
- Selective
- Non-selective
On the basis of Region, the market has been segmented as follows:
- North America
- Europe
- Asia-Pacific
- Latin America
- Rest of the World (RoW)
Available Customizations
With the given market data, MarketsandMarkets offers customizations according to the company’s specific scientific needs.
The following customization options are available for the report:
Product Analysis
- Product matrix, which gives a detailed comparison of the product portfolio of each company
Geographic Analysis
- of the Rest of Asia-Pacific algaecides market into South Korea, Thailand, Indonesia, and Vietnam
- Further breakdown of the Rest of Europe algaecides market into Spain, the Netherlands, and Greece
- Further breakdown of the Rest of Latin America algaecides market into Chile, Colombia, and Venezuela
- Further breakdown of algaecides market of other countries of the RoW region into Saudi Arabia, Egypt, Iran, and Israel
Company Information
- Detailed analyses and profiling of additional market players (up to five)
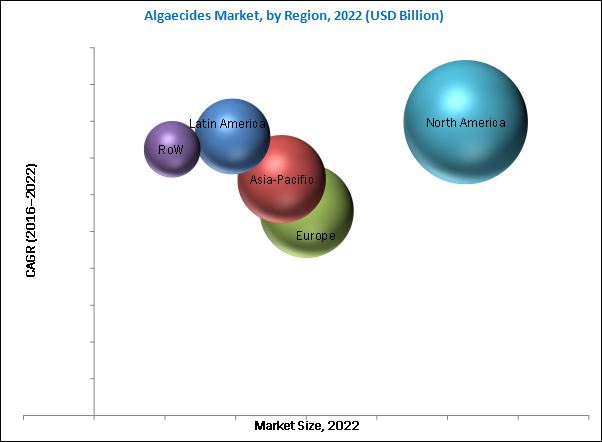
The algaecides market is projected to grow at a CAGR of 6.52% from 2016 to 2022, to reach a projected value of USD 2.79 Billion by 2022. Algaecide products and water treatment services for algal control have been gaining significance from the last decade due to the uncontrolled growth of algal blooms in freshwater lakes and marine coastlines & estuaries. Toxins produced as a result of algal blooms are considered to be dangerous to humans, marine, and freshwater environments. Hence, various preventive and control measures for the treatment of algae are driving the growth of the algaecides market globally.
The application of algaecides is the largest in aquaculture because of the organized development of aquaculture in both, freshwater and marine areas for maintaining water quality and increased incidence of algal bloom in the North American and Latin American regions which affects the fish and mussel farmers in the region. The larger demand for copper sulfate is attributed to its effectiveness against all species of algae and its increasing usage in wastewater treatment. Granular algaecides, on the basis of form, accounted for the largest market share in 2015 owing to its higher dissolution and penetration into the algal cells and easier handling process. In 2015, on the basis of mode of action, the non-selective algaecides segment dominated the market, due to the high preference of copper sulfate and quaternary ammonium compounds to control a wide range of algal species.
North America accounted for the largest regional market share in 2015 and is projected to grow at the highest CAGR for the next six years. The strong emphasis on controlling environmental pollution in North America, especially the U.S. is expected to play an important role in the demand for algaecides along with other preventive measures.
Regulatory control on the usage of certain compounds in different countries limited the range of algaecides available for the formulators to develop. The approval of local authorities is required for the application of algaecides on the waste water discharged in public water bodies in order to ascertain that the active ingredients utilized are not sensitive to non-target species, which limits the use of algaecides.
The algaecides market is a fragmented market with a large number of domestic manufacturers, formulators, and suppliers. Easy availability of inexpensive raw materials allows the entry of many small-scale manufacturers and to compete for market position. Off-patent chemicals are mainly utilized for algaecide formulation and limited research activities are conducted with respect to algaecides, except for some key players. Lonza Group (Switzerland) is one of the key players in the algaecides market. The major strategy adopted by the company is acquisitions, for increasing their presence in high-demand markets of the U.S., Europe, and Latin America. Strategic acquisitions have helped the company in strengthening its portfolio of approved active ingredients in both, established and emerging markets.
To speak to our analyst for a discussion on the above findings, click Speak to Analyst
Table of Contents
1 Introduction (Page No. - 15)
1.1 Objectives of the Study
1.2 Market Definition
1.3 Study Scope
1.4 Periodization Considered
1.5 Currency Considered
1.6 Stakeholders
2 Research Methodology (Page No. - 18)
2.1 Research Data
2.1.1 Secondary Data
2.1.1.1 Key Data From Secondary Sources
2.1.2 Primary Data
2.1.2.1 Key Data From Primary Sources
2.1.2.2 Key Industry Insights
2.1.2.3 Breakdown of Primary Interviews
2.2 Market Size Estimation
2.2.1 Top-Down Approach
2.2.2 Bottom-Up Approach
2.3 Market Breakdown & Data Triangulation
2.4 Research Assumptions & Limitations
2.4.1 Assumptions
2.4.2 Limitations
3 Executive Summary (Page No. - 28)
4 Premium Insights (Page No. - 33)
4.1 Attractive Opportunities in Algaecides Market
4.2 Algaecides Market, Key Formulation Types
4.3 Top Applications for Algaecides in the Americas
4.4 Algaecides Market: Key Countries
4.5 Life Cycle Analysis, By Region
5 Market Overview (Page No. - 39)
5.1 Introduction
5.2 Evolution
5.3 Market Segmentation
5.3.1 By Type
5.3.2 By Application
5.3.3 By Mode of Action
5.3.4 By Form
5.3.5 By Region
5.4 Macroeconomic Indicators
5.4.1 Agricultural Gdp
5.4.2 Increasing Fertilizer Consumption
5.4.3 Export-Import Scenario
5.5 Market Dynamics
5.5.1 Drivers
5.5.1.1 High Efficiency and Ease of Use
5.5.1.2 Increasing Industrialization and the Resultant Pollution Levels
5.5.2 Restraints
5.5.2.1 Regulatory Issues and Aquatic Pesticide Monitoring
5.5.2.2 Operating Constraints
5.5.3 Opportunities
5.5.3.1 Addressing Environmental Concerns: Water Quality Protection and Management
5.5.3.2 Strong Progress in New and Emerging Markets (Asia-Pacific)
5.5.3.3 Recreation and Aesthetic Value Associated With Algaecide Demand
5.5.4 Challenges
5.5.4.1 Environmental and Technological Constraints
5.5.4.2 Non-Selective Nature of Algaecide Chemicals
5.6 Supply Chain Framework
5.6.1 Chemical Manufacturers
5.6.2 Government Regulatory Authorities
5.6.3 End Users
5.6.4 Key Influencers
5.7 Regulatory Framework
5.7.1 Introduction
5.7.2 North America
5.7.2.1 U.S.
5.7.2.2 Canada
5.7.3 Europe
5.7.4 Asia-Pacific
5.7.4.1 Australia
5.7.4.2 China
5.7.4.3 Japan
5.7.4.4 New Zealand
5.8 Patent Analysis
6 Algaecides Market, By Type (Page No. - 63)
6.1 Introduction
6.2 Copper Sulfate
6.3 Quaternary Ammonium Compounds
6.4 Chelated Copper
6.5 Peroxyacetic Acid & Hydrogen Dioxide
6.6 Dyes & Colorants
6.7 Other Algaecides & Disinfectants
7 Algaecides Market, By Application (Page No. - 75)
7.1 Introduction
7.2 Surface Water Treatment
7.3 Aquaculture
7.4 Sports & Recreational Centers
7.5 Agriculture
7.6 Other Applications
8 Algaecides Market, By Form (Page No. - 82)
8.1 Introduction
8.2 Granular Crystal
8.3 Liquid
8.4 Pellet
9 Algaecides Market, By Mode of Action (Page No. - 89)
9.1 Introduction
9.2 Non-Selective Algaecides
9.3 Selective Algaecides
10 Algaecides Market, By Region (Page No. - 96)
10.1 Introduction
10.2 North America
10.2.1 U.S.
10.2.2 Canada
10.2.3 Mexico
10.3 Europe
10.3.1 Germany
10.3.2 France
10.3.3 U.K.
10.3.4 Italy
10.3.5 Rest of Europe
10.4 Asia-Pacific
10.4.1 China
10.4.2 Australia
10.4.3 Japan
10.4.4 India
10.4.5 Rest of Asia-Pacific
10.5 Latin America
10.5.1 Brazil
10.5.2 Argentina
10.5.3 Rest of Latin America
10.6 Rest of the World
10.6.1 South Africa
10.6.2 Others in RoW
11 Competitive Landscape (Page No. - 137)
11.1 Overview
11.2 Market Environment
11.3 Competitive Situation & Trends
11.3.1 Share of Key Strategies, 2011-2016
11.3.2 Acquisitions
11.3.3 Expansions
11.3.4 Agreements
11.3.5 New Product Launches
12 Company Profiles (Page No. - 143)
(Company at A Glance, Recent Financials, Products & Services, Strategies & Insights, & Recent Developments)*
12.1 Introduction
12.2 BASF SE
12.3 Nufarm Limited
12.4 Lonza Group AG
12.5 UPL Limited
12.6 Waterco Limited
12.7 Sepro Corporation
12.8 The DOW Chemical Company
12.9 Biosafe Systems, LLC
12.10 Airmax, Inc.
12.11 Oreq Corporation
*Details on Company at A Glance, Recent Financials, Products & Services, Strategies & Insights, & Recent Developments Might Not Be Captured in Case of Unlisted Companies.
13 Appendix (Page No. - 169)
13.1 Industry Insights
13.2 Discussion Guide
13.3 Knowledge Store: Marketsandmarkets’ Subscription Portal
13.4 Introducing RT: Real-Time Market Intelligence
13.5 Available Customizations
13.6 Related Reports
13.7 Author Details
List of Tables (89 Tables)
Table 1 California Registered Aquatic Herbicides and Algaecides
Table 2 Specific Herbicide Compounds With Aquatic Use Label
Table 3 Permits and Regulations Pertaining to Use of Chemicals for Controlling Plants and Algae in Water Bodies
Table 4 List of Major Patents in Algaecides, 2012-2016
Table 5 Algaecides Market Size, By Type, 2014–2022 (USD Million)
Table 6 Copper Sulfate Algaecides Market Size, By Region, 2014–2022 (USD Million)
Table 7 Quaternary Ammonium Compounds Market Size, By Region, 2014–2022 (USD Million)
Table 8 Chelated Copper Market Size, By Region, 2014–2022 (USD Million)
Table 9 Peroxyacetic Acid & Hydrogen Dioxide Market Size, By Region, 2014–2022 (USD Million)
Table 10 Dyes & Colorants Market Size, By Region, 2014–2022 (USD Million)
Table 11 Dyes & Colorants Market Size, By Subtype, 2014–2022 (USD Million)
Table 12 Other Algaecides & Disinfectants Market Size, By Region, 2014–2022 (USD Million)
Table 13 Algaecides Market Size, By Application, 2014–2022 (USD Million)
Table 14 Surface Water Treatment Market Size, By Region, 2014–2022 (USD Million)
Table 15 Aquaculture Market Size, By Region, 2014–2022 (USD Million)
Table 16 Suggested Chemical Standards for Swimming Pools
Table 17 Sports & Recreational Centers Market Size, By Region, 2014–2022 (USD Million)
Table 18 Algaecides Market Size in Agriculture, By Subtype, 2014–2022 (USD Million)
Table 19 Agricultural Applications Market Size, By Region, 2014–2022 (USD Million)
Table 20 Other Applications Market Size, By Region, 2014–2022 (USD Million)
Table 21 Algaecides Market Size, By Form, 2014–2022 (USD Million)
Table 22 Important Brand Names of Different Granular Algaecides
Table 23 Granular Algaecides Market Size, By Region, 2014–2022 (USD Million)
Table 24 Important Brand Names of Different Liquid Algaecides
Table 25 Liquid Algaecides Market Size, By Region, 2014–2022 (USD Million)
Table 26 Pelleted Algaecides Market Size, By Region, 2014–2022 (USD Million)
Table 27 Aquatic Herbicides With Active Ingredients & Trade Names
Table 28 Selective Aquacide Products vs Non-Selective Aquacide Products
Table 29 Algaecides Market Size, By Mode of Action, 2014–2022 (USD Million)
Table 30 Non-Selective Algaecides Market Size, By Region, 2014–2022 (USD Million)
Table 31 Selective Algaecides Market Size, By Region, 2014–2022 (USD Million)
Table 32 Algaecides Market Size, By Region, 2014–2022 (USD Million)
Table 33 North America: Algaecides Market Size, By Country, 2014–2022 (USD Million)
Table 34 North America: Market Size, By Type, 2014–2022 (USD Million)
Table 35 North America: Market Size, By Application, 2014–2022 (USD Million)
Table 36 U.S.: Algaecides Market Size, By Type, 2014–2022 (USD Million)
Table 37 U.S.: Market Size, By Application, 2014–2022 (USD Million)
Table 38 Canada: Algaecides Market Size, By Type, 2014–2022 (USD Million)
Table 39 Canada: Market Size, By Application, 2014–2022 (USD Million)
Table 40 Mexico: Algaecides Market Size, By Type, 2014–2022 (USD Million)
Table 41 Mexico: Market Size, By Application, 2014–2022 (USD Million)
Table 42 Europe: Algaecides Market Size, By Country, 2014–2022 (USD Million)
Table 43 Europe: Market Size, By Type, 2014–2022 (USD Million)
Table 44 Europe: Market Size, By Application, 2014–2022 (USD Million)
Table 45 Germany: Algaecides Market Size, By Type, 2014–2022 (USD Million)
Table 46 Germany: Market Size, By Application, 2014–2022 (USD Million)
Table 47 France: Algaecides Market Size, By Type, 2014–2022 (USD Million)
Table 48 France: Market Size, By Application, 2014–2022 (USD Million)
Table 49 U.K.: Algaecides Market Size, By Type, 2014–2022 (USD Million)
Table 50 U.K.: Market Size, By Application, 2014–2022 (USD Million)
Table 51 Italy: Algaecides Market Size, By Type, 2014–2022 (USD Million)
Table 52 Italy: Market Size, By Application, 2014–2022 (USD Million)
Table 53 Rest of Europe: Algaecides Market Size, By Type, 2014–2022 (USD Million)
Table 54 Rest of Europe: Market Size, By Application, 2014–2022 (USD Million)
Table 55 Asia-Pacific: Algaecides Market Size, By Country, 2014–2022 (USD Million)
Table 56 Asia-Pacific: Market Size, By Type, 2014–2022 (USD Million)
Table 57 Asia-Pacific: Market Size, By Application, 2014–2022 (USD Million)
Table 58 China: Algaecides Market Size, By Type, 2014–2022 (USD Million)
Table 59 China: Market Size, By Application, 2014–2022 (USD Million)
Table 60 Australia: Algaecides Market Size, By Type, 2014–2022 (USD Million)
Table 61 Australia: Market Size, By Application, 2014–2022 (USD Million)
Table 62 Japan: Algaecides Market Size, By Type, 2014–2022 (USD Million)
Table 63 Japan: Market Size, By Application, 2014–2022 (USD Million)
Table 64 India: Algaecides Market Size, By Type, 2014–2022 (USD Million)
Table 65 India: Market Size, By Application, 2014–2022 (USD Million)
Table 66 Rest of Asia-Pacific: Algaecides Market Size, By Type, 2014–2022 (USD Million)
Table 67 Rest of Asia-Pacific: Market Size, By Application, 2014–2022 (USD Million)
Table 68 Algaecide Products Available in Latin America
Table 69 Latin America: Algaecides Market Size, By Country, 2014–2022 (USD Million)
Table 70 Latin America: Market Size, By Type, 2014–2022 (USD Million)
Table 71 Latin America: Market Size, By Application, 2014–2022 (USD Million)
Table 72 Brazil: Algaecides Market Size, By Type, 2014–2022 (USD Million)
Table 73 Brazil: Market Size, By Application, 2014–2022 (USD Million)
Table 74 Argentina: Algaecides Market Size, By Type, 2014–2022 (USD Million)
Table 75 Argentina: Market Size, By Application, 2014–2022 (USD Million)
Table 76 Rest of Latin America: Algaecides Market Size, By Type, 2014–2022 (USD Million)
Table 77 Rest of Latin America: Market Size, By Application, 2014–2022 (USD Million)
Table 78 RoW: Algaecides Market Size, By Country, 2014–2022 (USD Million)
Table 79 RoW: Market Size, By Type, 2014–2022 (USD Million)
Table 80 RoW: Market Size, By Application, 2014–2022 (USD Million)
Table 81 South Africa: Algaecides Market Size, By Type, 2014–2022 (USD Million)
Table 82 South Africa: Market Size, By Application, 2014–2022 (USD Million)
Table 83 Others in RoW: Algaecides Market Size, By Type, 2014–2022 (USD Million)
Table 84 Others in RoW: Market Size, By Application, 2014–2022 (USD Million)
Table 85 Algaecides Market: Top 4 Company Ranking, 2015
Table 86 Acquisitions, 2011–2015
Table 87 Expansions, 2011–2016
Table 88 Agreements, 2013–2014
Table 89 New Product Launches, 2015–2016
List of Figures (64 Figures)
Figure 1 Algaecides Market Segmentation
Figure 2 Research Design: Algaecides Market
Figure 3 Breakdown of Primary Interviews: By Company Type, Designation & Region
Figure 4 Market Size Estimation Methodology: Top-Down Approach
Figure 5 Market Size Estimation Methodology: Bottom-Up Approach
Figure 6 Data Triangulation
Figure 7 Overview of Algaecides Market Segmentation
Figure 8 Algaecides Market Size, By Type, 2016 vs 2022
Figure 9 Algaecides Market Size, By Application, 2016 vs 2022
Figure 10 North America is Projected to Be the Fastest-Growing Region for Algaecides During the Forecast Period
Figure 11 Immediate Need to Control Environmental Damage Caused By Algal Blooms Would Drive the Market During the Forecast Period
Figure 12 Strong Demand Projected for Cost-Effective and Efficient Algaecide Formulations, 2016-2022
Figure 13 Significant Growth of Algaecides in Both Commercial & Pubic Health Purposes, 2015
Figure 14 Strong Demand for Algaecides in the Americas in 2015
Figure 15 Algaecides: Life Cycle Analysis, 2016
Figure 16 Algaecides Market Evolution
Figure 17 Algaecides Market, By Type
Figure 18 Market, By Application
Figure 19 Market, By Mode of Action
Figure 20 Market, By Form
Figure 21 Market, By Region
Figure 22 Agricultural GDP (%): Key Markets, 2010-2014
Figure 23 Fertilizer Consumption: Key Markets, 2010-2013
Figure 24 Phosphate Fertilizer Supply, By Region, 2014-2018
Figure 25 Import Comparison of Important Active Ingredients, 2015
Figure 26 Export Comparison of Important Active Ingredients, 2015
Figure 27 Algaecides Market: Drivers, Restraints, Opportunities, and Challenges
Figure 28 Supply Chain Framework: Algaecides Market
Figure 29 Number of Patents Approved for Algaecides, 2012-2016
Figure 30 Geographical Analysis: Algaecides Patent Approval, 2012-2016
Figure 31 Algaecides Market Size, By Type, 2016 vs 2022
Figure 32 Copper Sulfate Market Size, By Region, 2016 vs 2022
Figure 33 Quaternary Ammonium Compounds Market Size, By Region, 2016 vs 2022
Figure 34 Chelated Copper Market Size, By Region, 2016 vs 2022
Figure 35 Peroxyacetic Acid & Hydrogen Dioxide Market Size, By Region, 2016 vs 2022
Figure 36 Dyes & Colorants Market Size, By Region, 2016 vs 2022
Figure 37 Other Algaecides & Disinfectants Market Size, By Region, 2016 vs 2022
Figure 38 Aquaculture Segment is Projected to Hold the Largest Market Share By 2022
Figure 39 Granular Algaecides Market Size, By Form, 2016 vs 2022 (USD Million)
Figure 40 Granular Algaecides Market Size, By Region, 2016 vs 2022 (USD Million)
Figure 41 Liquid Algaecides Market Size, By Region, 2016 vs 2022 (USD Million)
Figure 42 Pelleted Algaecides Market Size, By Region, 2016 vs 2022 (USD Million)
Figure 43 Algaecides Market Size, By Mode of Action, 2016 vs 2022 (USD Million)
Figure 44 Non-Selective Algaecides Market Size, By Region, 2016 vs 2022 (USD Million)
Figure 45 Selective Algaecides Market Size, By Region, 2016 vs 2022 (USD Million)
Figure 46 Algaecides Market: Geographic Snapshot (2016–2022)
Figure 47 North America: Algaecides Market Snapshot
Figure 48 Europe: Algaecides Market Snapshot
Figure 49 Asia-Pacific: Algaecides Market Snapshot
Figure 50 Latin America: Algaecides Market Snapshot
Figure 51 Acquisitions Were Preferred By Algaecide Companies in the Last Six Years
Figure 52 Strategic Developments Adopted By Profiled Companies, January 2011 to September 2016
Figure 53 Geographical Revenue Mix of Key Market Players
Figure 54 BASF SE: Company Snapshot
Figure 55 BASF SE: SWOT Analysis
Figure 56 Nufarm Limited: Company Snapshot
Figure 57 Nufarm Limited: SWOT Analysis
Figure 58 Lonza Group AG: Company Snapshot
Figure 59 Lonza Group AG: SWOT Analysis
Figure 60 UPL Limited: Company Snapshot
Figure 61 UPL Limited: SWOT Analysis
Figure 62 Waterco Limited: Company Snapshot
Figure 63 Waterco Limited: SWOT Analysis
Figure 64 The DOW Chemical Company: Company Snapshot


Growth opportunities and latent adjacency in Algaecides Market