Aluminum Composite Panels Market by Base Coating Type (PE, PVDF), Type (Fire-resistant, Antibacterial), Application (Building & Construction, Advertising, and Transportation), Composition (Core material, Metal skin), and Region - Global Forecast to 2022


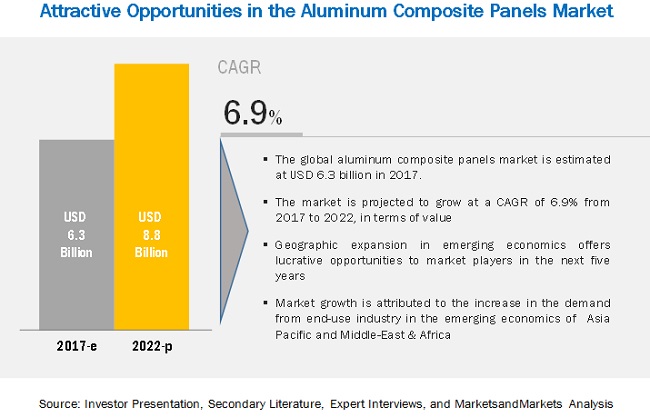
[163 Pages Report] MarketsandMarkets forecasts the aluminum composite panels market to grow from USD 6.3 billion in 2017 to USD 8.8 billion by 2022, at a CAGR of 6.9% during the forecast period. The aluminum composite panels market is witnessing high growth, owing to factors such as increase in industrial and commercial activities, growth in demand from end-use industries, and increase in popularity of anti-toxic and antibacterial panels� coupled with benefits associated with aluminum composite panels, such as durability and reduced sound transmission; protect the surface from UV-sunlight, heavy rain, wind, humidity, and harmful bacteria & microbes. Increased urbanization and growth of the construction industry have led to an increase in demand for aluminum composite panels, particularly in the emerging economies of Asia Pacific and South America.
By application industry building & construction - the largest application industry of aluminum composite panels
Building & construction is estimated to be the largest application industry of aluminum composite panels. The aluminum composite panels market is driven by the increasing standardization in architecture that increased the necessity of installation of aluminum composite panels in new constructions and due to the superior quality of durability, fire resistance, anti-bacterial, and weather proof properties that aluminum composite panels offer. Emerging markets, such as the Asia Pacific region, have contributed to an increase in the application of aluminum composite panels in building & construction. High repairing cost if broken or dented is the restraining factors for the aluminum composite panels market.
�Fire-resistant segment, by type, projected to grow at the highest CAGR during the forecast period.�
The fire-resistant segment, by type, is projected to grow at the highest CAGR between 2017 and 2022. The dominant market position of the fire-resistant aluminum composite panels segment can be attributed to its fire repellent property that prevents fire accidents in the residential or commercial sectors. The fire-resistant aluminum composite panel has a growing demand, owing to its high preference in residential and non-residential sectors. These panels are fire resistant, provide barrier against bacteria and microbes, and are dust-proof and ideal to minimize static-electrical charges. These factors have helped expand the market for aluminum composite panels in recent years
�Asia Pacific to gain maximum traction during the forecast period.�
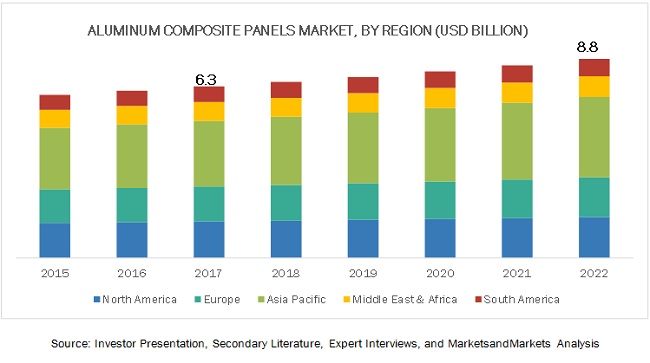
The Asia Pacific region is projected to be the fastest-growing market during the forecast period, followed by South America. In Asia Pacific, China is the largest consumer for aluminum composite panels, followed by Japan. China, with its growing building & construction industry, is expected to drive the aluminum composite panels market. Japan, with its growing inclination toward convenient and safe building materials, is expected to drive the aluminum composite panels market in the Asia Pacific region.
Market Dynamics
Driver: Growth in demand from end-use industries
Aluminum composite panels have various applications in transportation, building & construction, and advertising boards. Owing to the various properties including lightness, resistance to compression, fire resistance, non-combustibility, non-toxic fumes, easy assembly, time- and cost-effectiveness, and acoustic insulation, these panels are widely used in transportation.
Rise in demand for high-performance aluminum composite panels and standardization in the building & construction industry led to the development of the installation of aluminum composite panels. Optimal fire, weather, and chemical resistance and lightweight features of aluminum composite panels coupled with the emerging international building codes that have challenged the construction market to be design-oriented with sustainability and energy efficiency are the key factors influencing the growth.
The major characteristics of aluminum composite panels are also influencing the growth of the market persistently, such as coating in aluminum composite panels, which helps to enhance the appearance of the internal & external walls and provide easy maintenance with high durability. Its application in the exposed area of buildings helps to protect against external climatic conditions and retain its color and gloss for a long period. Polyvinylidene difluoride (PVDF) and polyethylene (PE) are the most preferred coating materials in the aluminum composite panels market.
The industrial growth after the economic slowdown has given rise to new constructions, both commercial and non-commercial. According to the global construction 2030 report by Global Construction Perspectives and Oxford Economics, the global construction industry is expected to reach USD 8 trillion by 2030. Construction of factories, manufacturing plants, stadiums, and offices has increased. This would directly influence the need for sustainable decorative building construction solutions in these structures due to which an increase in the demand for aluminum composite panels is observed.
According to the same source, the construction industry has been growing at a rate of 10% for the past few years in the Middle Eastern countries such as Saudi Arabia, UAE, and Qatar. The Asia Pacific region is projected to witness the highest number of new constructions between 2017 and 2022. The construction spending growth during this period for China is expected to be 7.3%, for India it is expected to be 7%, while for Vietnam it is expected to be 6.8% of the global construction spending. The �Make in India� program introduced by the Government of India promotes new construction projects, mostly industrial and commercial in the country. The sub-prime crisis in the US caused a recession in the construction industry. However, the industry has recovered and is growing at a moderate pace. The global construction industry contributes around one-tenth of the global GDP, according to Oxford Economics.
Restraint: High repairing cost if broken or dent
Regular maintenance of aluminum composite panels is required to maintain rigidity and increase the sustainability & durability of the panel. Proper cleaning is also essential to remove the accumulation of dust and prevent any organic growth.
These panels also help in maintaining the appearance of the building. However, if are broken or dented, it is difficult to repair the damaged part without affecting the aesthetic qualities of the aluminum composite panel. Aluminum composite panels can easily be dented if not properly installed. This may also cause damage to the original structure of the panel. Hence, the cost and time associated with repairing could be a major challenge faced by aluminum composite panel manufacturers. However, new technologies such as lamination with premade adhesive films and extrusion lamination prevent such causes; the cost associated with these technologies is quite high, thereby posing a challenge.
Opportunity: Industrial expansions in emerging economies
Emerging economies have been focusing on rapid industrialization over the last few decades. Countries such as China, India, Indonesia, South Africa, Brazil, and Argentina are transforming their economies from being agricultural-based to being based on manufacturing and other industries. With the emergence of new industries, the need for industrial construction is also increasing; this is creating scope for aluminum composite panels.
Aluminum composite panels are generally used in curtain walls, decorative renovation for story-added old buildings, advertisement boards, display platforms & signboards, wallboards, and ceilings for tunnels. The growth of these industries depends on various macroeconomic factors such as GDP growth, employment rate, and standard of living. Economic developments coupled with easy availability of labor and raw materials, particularly in China, majorly drive the continuous expansion of production facilities. As aluminum composite panels are used in almost every industry, their demand is projected to grow significantly with the expansion of facilities. This growth is not only limited to China and the US, but also supported to the UAE, Germany, India, and Japan.
Challenge: High Price of raw materialS
The growth of the aluminum composite panels market is restricted by volatility in the supply and prices of the core materials such as (PE), aluminum metal, and other coating materials. Raw materials of aluminum composite panels are expensive as compared to other construction material, wherein the cost of manufacturing these products is also high. Fluctuating crude oil prices and foreign currency fluctuations have resulted in higher raw material costs. This puts an added pressure on the manufacturers of aluminum composite panels.
The initial capital investment required for establishing production, smelting, refining, and metal recovery facilities is high. Smelters used for converting bauxite to aluminum are expensive. According to Metal World, the aluminum industry is power intensive and consumes around 13,000�15,000 power units per ton.
According to the same source, the aluminum industry is highly capital-intensive; around USD 1.2 billion is required to establish a viable Greenfield project. These costs include the capital required for the processing facility, warehouse, or plant & equipment. The aluminum industry is also labor- and energy-intensive. The energy required in the aluminum industry accounts for around 25% of the production cost.
Get online access to the report on the World's First Market Intelligence Cloud
- Easy to Download Historical Data & Forecast Numbers
- Company Analysis Dashboard for high growth potential opportunities
- Research Analyst Access for customization & queries
- Competitor Analysis with Interactive dashboard
- Latest News, Updates & Trend analysis
Request Sample Scope of the Report
Get online access to the report on the World's First Market Intelligence Cloud
- Easy to Download Historical Data & Forecast Numbers
- Company Analysis Dashboard for high growth potential opportunities
- Research Analyst Access for customization & queries
- Competitor Analysis with Interactive dashboard
- Latest News, Updates & Trend analysis

|
Report Metric |
Details |
|
Market size available for years |
2015�2022 |
|
Base year considered |
2016 |
|
Forecast period |
2017�2022 |
|
Forecast units |
Billion (USD) |
|
Segments covered |
Aluminum composite panels market by base coating type (PE & PVDF), Type (Fire-resistant, antibacterial), Application (Building & Construction, Advertising, and Transportation), Composition (Core Material, Metal Skin), and Region - Global Forecast to 2022 |
|
Geographies covered |
North America, Europe, APAC, MEA, and South America |
|
Companies covered |
Arconic, Yaret Industrial Group, Mitsubishi Chemical, 3A Composites, Alubond U.S.A., Alumax Industrial, Shanghai Huayuan New Composite Materials, Changshu Kaidi Decoration Material, Guangzhou Xinghe Aluminum Composite Panel, and Jyi Shyang Industrial, and 15 others. |
The research report categorizes the Aluminum composite panels to forecast the revenues and analyze the trends in each of the following sub-segments:
Aluminum composite panels by Coating Type
- Polyvinylidene Difluoride
- Polyethylene
- Polyester
- Laminating coating
- Oxide Film
Aluminum composite panels by Type
- Fire-resistant
- Antibacterial
- Antistatic
Aluminum composite panels by Composition
- Surface Coating
- Metal Skin
- Core Material
- Rear Skin
Aluminum composite panels by Vehicle Type
- Passenger cars
- Light Commercial Vehicles
Aluminum composite panels by Application
- Building & construction
- Advertising
- Automotive
- Transportation
Aluminum composite panels by Region
- North America
- Europe
- Asia Pacific
- South America
- Middle East & Africa
Key Market Players
Arconic, Yaret Industrial Group, Mitsubishi Chemical, 3A Composites, Alubond U.S.A., Alumax Industrial, Shanghai Huayuan New Composite Materials, Changshu Kaidi Decoration Material, Guangzhou Xinghe Aluminum Composite Panel, and Jyi Shyang Industrial, and 15 others.
Recent Developments
- In December 2017, Arconic divested its Latin America Extrusions (LAE) business to a subsidiary of Hydro Extruded Solutions AS (Norway). This will enable the company to streamline its product portfolio.
- In July 2017, 3A Composites acquired Athlone Extrusions (Ireland). This acquisition would help the company to strengthen its market in the transport & industry business in Europe.
- In March 2016, Alubond U.S.A. launched new A2 grade fire-resistant panels. The company launched this product to enhance its technology offering and for fire safety.
- In August 2016, Alubond U.S.A. invested USD 13.6 million for its new production plant in the UAE for A2 fire-resistant panels. This has helped the company to increase its production capacity and maintain its position in the aluminum composite market in the Middle East
- In June 2014, Guangzhou Xinghe ACP launched a new product line that included various aluminum composite products�exterior wall materials, fireproof aluminum composite panels, mirror aluminum composite panels, and wall plastic panels. This was launched with the aim to strengthen the company�s product portfolio by providing a wide range of products to its customers.
Critical questions the report answers:
- Where will all these developments take the industry in the long term?
- What are the upcoming trends for the Aluminum composite panels market?
- Which segment provides the most opportunity for growth?
- Who are the leading vendors operating in this market?
- What are the opportunities for new market entrants?
To speak to our analyst for a discussion on the above findings, click Speak to Analyst
Table of Contents
1 Introduction
1.1 Objectives of the Study
1.2 Market Definition
1.3 Scope of the Study
1.3.1 Years Considered for the Study
1.4 Currency
1.5 Units Considered
1.6 Stakeholders
2 Research Methodology
2.1 Research Data
2.1.1 Secondary Data
2.1.1.1 Key Data From Secondary Sources
2.1.2 Primary Data
2.1.2.1 Key Data From Primary Sources
2.1.2.2 Key Industry Insight
2.1.2.3 Breakdown of Primaries
2.2 Market Size Estimation
2.2.1 Bottom-Up Approach
2.2.2 Top-Down Approach
2.3 Data Triangulation
2.4 Assumptions
2.5 Limitations
3 Executive Summary
4 Premium Insights
4.1 Attractive Opportunities in Aluminum Composite Panels Market
4.2 Aluminum Composite Panels Market, By Type
4.3 Asia Pacific Aluminium Composite Panels Market, By Application and Country
4.4 Aluminum Composite Panels Market: Geographic Snapshot
5 Market Overview
5.1 Introduction
5.2 Market Dynamics
5.2.1 Drivers
5.2.1.1 Growth in Demand From End-Use Industries
5.2.2 Restraints
5.2.2.1 High Repairing Cost If Broken Or Dented
5.2.3 Opportunities
5.2.3.1 Industrial Expansion in Emerging Economies
5.2.4 Challenges
5.2.4.1 High Prices of Raw Materials
5.3 Porter�s Five Forces Analysis
5.3.1 Threat of New Entrants
5.3.2 Threat of Substitutes
5.3.3 Bargaining Power of Buyers
5.3.4 Bargaining Power of Suppliers
5.3.5 Intensity of Competitive Rivalry
6 Aluminum Composite Panels Market, By Base Coating Type
6.1 Introduction
6.2 Polyvinylidene Difluoride
6.2.1 Market Estimates and Forecasts, 2015 - 2022 (USD Million)
6.2.2 Market Estimates and Forecasts, By Region 2015 - 2022 (USD Million)
6.3 Polyethylene
6.3.1 Market Estimates and Forecasts, 2015 - 2022 (USD Million)
6.3.2 Market Estimates and Forecasts, By Region 2015 - 2022 (USD Million)
6.4 Polyster
6.4.1 Market Estimates and Forecasts, 2015 - 2022 (USD Million)
6.4.2 Market Estimates and Forecasts, By Region 2015 - 2022 (USD Million)
6.5 Laminating Coating
6.5.1 Market Estimates and Forecasts, 2015 - 2022 (USD Million)
6.5.2 Market Estimates and Forecasts, By Region 2015 - 2022 (USD Million)
6.6 Oxide Film
6.6.1 Market Estimates and Forecasts, 2015 - 2022 (USD Million)
6.6.2 Market Estimates and Forecasts, By Region 2015 - 2022 (USD Million)
7 Aluminum Composite Panels Market, By Type
7.1 Introduction
7.1.1 Key Market Trend
7.1.2 Market Size and Forecast
7.2 Fire-Resistant
7.2.1 Market Estimates and Forecasts, 2015 - 2022 (USD Million)
7.2.2 Market Estimates and Forecasts, By Region 2015 - 2022 (USD Million)
7.3 Antibacterial
7.3.1 Market Estimates and Forecasts, 2015 - 2022 (USD Million)
7.3.2 Market Estimates and Forecasts, By Region 2015 - 2022 (USD Million)
7.4 Antistatic
7.4.1 Market Estimates and Forecasts, 2015 - 2022 (USD Million)
7.4.2 Market Estimates and Forecasts, By Region 2015 - 2022 (USD Million)
8 Aluminum Composite Panels Market, By Composition
8.1 Introduction
8.1.1 Key Market Trend
8.1.2 Market Size and Forecast
8.2 Surface Coating
8.2.1 Market Estimates and Forecasts, 2015 - 2022 (USD Million)
8.2.2 Market Estimates and Forecasts, By Region 2015 - 2022 (USD Million)
8.3 Metal Skin
8.3.1 Market Estimates and Forecasts, 2015 - 2022 (USD Million)
8.3.2 Market Estimates and Forecasts, By Region 2015 - 2022 (USD Million)
8.4 Core Material
8.4.1 Market Estimates and Forecasts, 2015 - 2022 (USD Million)
8.4.2 Market Estimates and Forecasts, By Region 2015 - 2022 (USD Million)
8.5 Rear Skin
8.5.1 Market Estimates and Forecasts, 2015 - 2022 (USD Million)
8.5.2 Market Estimates and Forecasts, By Region 2015 - 2022 (USD Million)
9 Aluminum Composite Panels Market, By Application
9.1 Introduction
9.1.1 Key Market Trend
9.1.2 Market Size and Forecast
9.2 Building & Construction
9.2.1 Market Estimates and Forecasts, 2015 - 2022 (USD Million)
9.2.2 Market Estimates and Forecasts, By Region 2015 - 2022 (USD Million)
9.3 Advertising
9.3.1 Market Estimates and Forecasts, 2015 - 2022 (USD Million)
9.3.2 Market Estimates and Forecasts, By Region 2015 - 2022 (USD Million)
9.4 Transportation
9.4.1 Market Estimates and Forecasts, 2015 - 2022 (USD Million)
9.4.2 Market Estimates and Forecasts, By Region 2015 - 2022 (USD Million)
9.5 Automotive
9.5.1 Market Estimates and Forecasts, 2015 - 2022 (USD Million)
9.5.2 Market Estimates and Forecasts, By Region 2015 - 2022 (USD Million)
10 Aluminum Composite Panels Market, By Vehicle Type
10.1 Introduction
10.1.1 Key Market Trend
10.1.2 Market Size and Forecast
10.2 Passenger Cars
10.2.1 Market Estimates and Forecasts, 2015 - 2022 (USD Million)
10.2.2 Market Estimates and Forecasts, By Region 2015 - 2022 (USD Million)
10.3 Light Commercial Vehicles
10.3.1 Market Estimates and Forecasts, 2015 - 2022 (USD Million)
10.3.2 Market Estimates and Forecasts, By Region 2015 - 2022 (USD Million)
11 Aluminum Composite Panels Market, By Region
11.1 Introduction
11.2 North America
11.2.1 North America: Aluminum Composite Pannels Market,By Country
11.2.2 North America: Aluminum Composite Pannels Market,By Type
11.2.3 North America: Aluminum Composite Pannels Market,By Application
11.2.4 US
11.2.4.1 US: Aluminum Composite Pannels Market, By Type
11.2.4.2 US: Aluminum Composite Pannels Market, By Application
11.2.5 Canada
11.2.5.1 Canada: Aluminum Composite Pannels Market, By Type
11.2.5.2 Canada: Aluminum Composite Pannels Market, By Application
11.2.6 Mexico
11.2.6.1 Mexico: Aluminum Composite Pannels Market, By Type
11.2.6.2 Mexico: Aluminum Composite Pannels Market, By Application
11.3 Europe
11.3.1 Europe: Aluminum Composite Pannels Market, By Country
11.3.2 Europe: Aluminum Composite Pannels Market,By Type
11.3.3 Europe: Aluminum Composite Pannels Market,By Application
11.3.4 UK
11.3.4.1 UK: Aluminum Composite Pannels Market, By Type
11.3.4.2 UK: Aluminum Composite Pannels Market, By Application
11.3.5 Russia
11.3.5.1 Russia: Aluminum Composite Pannels Market, By Type
11.3.5.2 Russia: Aluminum Composite Pannels Market, By Application
11.3.6 Germany
11.3.6.1 Germany: Aluminum Composite Pannels Market, By Type
11.3.6.2 Germany: Aluminum Composite Pannels Market, By Application
11.3.7 France
11.3.7.1 France: Aluminum Composite Pannels Market, By Type
11.3.7.2 France: Aluminum Composite Pannels Market, By Application
11.3.8 Spain
11.3.8.1 Spain: Aluminum Composite Pannels Market, By Type
11.3.8.2 Spain: Aluminum Composite Pannels Market, By Application
11.3.9 Italy
11.3.9.1 Italy: Aluminum Composite Pannels Market, By Type
11.3.9.2 Italy Application
11.3.10 Rest of Europe
11.3.10.1 Rest of Europe: Aluminum Composite Pannels Market, By Type
11.3.10.2 Rest of Europe: Aluminum Composite Pannels Market, By Application
11.4 Asia Pacific
11.4.1 Asia Pacific: Aluminum Composite Pannels Market, By Country
11.4.2 Asia Pcific: Aluminum Composite Pannels Market, By Type
11.4.3 Asia Pacific: Aluminum Composite Pannels Market, By Application
11.4.4 China
11.4.4.1 Cina: Aluminum Composite Pannels Market, By Type
11.4.4.2 China: Aluminum Composite Pannels Market, By Application
11.4.5 India
11.4.5.1 India: Aluminum Composite Pannels Market, By Type
11.4.5.2 India: Aluminum Composite Pannels Market, By Application
11.4.6 Japan
11.4.6.1 Japan: Aluminum Composite Pannels Market, By Type
11.4.6.2 Japan: Aluminum Composite Pannels Market, By Application
11.4.7 Australia
11.4.7.1 Australia: Aluminum Composite Pannels Market, By Type
11.4.7.2 Australia: Aluminum Composite Pannels Market, By Application
11.4.8 South Korea
11.4.8.1 South Korea: Aluminum Composite Pannels Market, By Type
11.4.8.2 South Korea: Aluminum Composite Pannels Market, By Application
11.4.9 Rest of Asia Pacific
11.4.9.1 Rest of Asia Pacific: Aluminum Composite Pannels Market, By Type
11.4.9.2 Rest of Asia Pacific: Aluminum Composite Pannels Market, By: Aluminum Composite Pannels Market, By Application
11.5 Middle East & Africa
11.5.1 Middle East & Africa: Aluminum Composite Pannels Market, By Country
11.5.2 Middle East & Africa: Aluminum Composite Pannels Market, By Type
11.5.3 Middle East & Africa: Aluminum Composite Pannels Market, By Application
11.5.4 Turkey
11.5.4.1 Turkey: Aluminum Composite Pannels Market, By Type
11.5.4.2 Turkey: Aluminum Composite Pannels Market, By Application
11.5.5 UAE
11.5.5.1 UAE: Aluminum Composite Pannels Market, By Type
11.5.5.2 UAE: Aluminum Composite Pannels Market, By Application
11.5.6 Saudi Arabia
11.5.6.1 Saudi Arabia: Aluminum Composite Pannels Market, By Type
11.5.6.2 Saudi Arabia: Aluminum Composite Pannels Market, By Application
11.5.7 South Africa
11.5.7.1 South Africa: Aluminum Composite Pannels Market, By Type
11.5.7.2 South Africa: Aluminum Composite Pannels Market, By Application
11.5.8 Rest of Middle East & Africa
11.5.8.1 Rest of Middle East & Africa: Aluminum Composite Pannels Market, By Type
11.5.8.2 Rest of Middle East & Africa: Aluminum Composite Pannels Market, By Application
11.6 South America
11.6.1 South America: Aluminum Composite Pannels Market, By Country
11.6.2 South America: Aluminum Composite Pannels Market, By Type
11.6.3 South America: Aluminum Composite Pannels Market, By Application
11.6.4 Brazil
11.6.4.1 Brazil: Aluminum Composite Pannels Market, By Type
11.6.4.2 Brazil: Aluminum Composite Pannels Market, By Application
11.6.5 Argentina
11.6.5.1 Argentina: Aluminum Composite Pannels Market, By Type
11.6.5.2 Argentina: Aluminum Composite Pannels Market, By Application
11.6.6 Rest of South America
11.6.6.1 Rest of South America: Aluminum Composite Pannels Market, By Type
11.6.6.2 Rest of South America: Aluminum Composite Pannels Market, By Application
12 Competitive Landscape
12.1 Overview
12.2 Market Ranking
12.3 Competitive Scenario
12.3.1 New Product Launches
12.3.2 Acquisitions
12.3.3 Expansions, Divesture & Investments
13 Company Profiles
(Business Overview, Products Offered, Recent Developments, MnM View, SWOT Analysis)*
13.1 Arconic
13.1.1 Business Overview
13.1.2 Products Offered
13.1.3 Recent Developments
13.1.4 SWOT Analysis
13.1.5 MnM View
13.2 Yaret Industrial Group
13.2.1 Business Overview
13.2.2 Products Offered
13.2.3 Recent Developments
13.2.4 SWOT Analysis
13.2.5 MnM View
13.3 3A Composites
13.3.1 Business Overview
13.3.2 Products Offered
13.3.3 Recent Developments
13.3.4 SWOT Analysis
13.3.5 MnM View
13.4 Alubond U.S.A.
13.4.1 Business Overview
13.4.2 Products Offered
13.4.3 Recent Developments
13.4.4 SWOT Analysis
13.4.5 MnM View
13.5 Alumax Industrial
13.5.1 Business Overview
13.5.2 Products Offered
13.5.3 Recent Developments
13.5.4 SWOT Analysis
13.5.5 MnM View
13.6 Shanghai Huayuan New Composite Materials
13.6.1 Business Overview
13.6.2 Products Offered
13.6.3 Recent Developments
13.6.4 SWOT Analysis
13.6.5 MnM View
13.7 Changshu Kaidi Decoration Material
13.7.1 Business Overview
13.7.2 Products Offered
13.7.3 Recent Developments
13.7.4 SWOT Analysis
13.7.5 MnM View
13.8 Guangzhou Xinghe Acp
13.8.1 Business Overview
13.8.2 Products Offered
13.8.3 Recent Developments
13.8.4 SWOT Analysis
13.8.5 MnM View
13.9 JYI Shyang Industrial
13.9.1 Business Overview
13.9.2 Products Offered
13.9.3 Recent Developments
13.9.4 SWOT Analysis
13.9.5 MnM View
13.10 Mitsubishi Chemical (Mitsubishi Chemical Corporation)
13.10.1 Business Overview
13.10.2 Products Offered
13.10.3 Recent Developments
13.10.4 SWOT Analysis
13.10.5 MnM View
*Business Overview, Products Offered, Recent Developments, MnM View, SWOT Analysis Might Not Be Captured in Case of Unlisted Companies.
13.11 Other Key Players
13.11.1 Msenco Metal
13.11.2 Guangzhou Jixinxiang Decorative Building Materials
13.11.3 Jiangyin Litai Ornamental Materials
13.11.5 Alucoil
13.11.6 Alstrong Enterprises India
13.11.7 Maxbond
13.11.8 Alstone
13.11.9 Taizhou Kingertai Decoration Material
13.11.10 Constellium
13.11.11 Laminators
13.11.12 Aludecor
13.11.13 Shanghai Jixiang Industry
13.11.14 Goldstar Group
13.11.15 Guangdong Bolliya Metal Building Materials
14 Appendix
14.1 Discussion Guide
14.2 Knowledge Store: Marketsandmarkets� Subscription Portal
14.3 Introducing RT: Real-Time Market Intelligence
14.4 Available Customizations
14.5 Related Reports
14.6 Author Details
List of Tables (146 Tables)
Table 1 Construction Output, By Country, 2016
Table 2 North America: Construction Spending, By Country, 2014�2021 (USD Billion)
Table 3 Europe: Construction Spending, By Country, 2014�2021 (USD Billion)
Table 4 Asia Pacific: Construction Spending, By Country, 2014�2021 (USD Billion)
Table 5 Middle East & Africa: Construction Spending, By Country, 2014�2021 (USD Billion)
Table 6 South America: Construction Spending, By Country, 2014�2021 (USD Billion)
Table 7 Aluminum Composite Panels Market Size, By Base Coating Type, 2015�2022 (USD Million)
Table 8 Aluminum Composite Panels Market Size, By Base Coating Type, 2015�2022 (Million Square Meters)
Table 9 Aluminum Composite Panels Market, By Type, 2015�2022 (USD Million)
Table 10 Aluminum Composite Panels Market, By Type, 2015�2022 (Million Square Meter)
Table 11 Aluminum Composite Panels Market Size, By Composition, 2015�2022 (USD Million)
Table 12 Aluminum Composite Panels Market, By Composition, 2015�2022 (Million Kg)
Table 13 Aluminum Composite Panels Market Size, By Application, 2015�2022 (USD Million)
Table 14 Aluminum Composite Panels Market Size, By Application, 2015�2022 (Million Square Meters)
Table 15 Aluminum Composite Panels Market Size, By Region, 2015�2022 (USD Million)
Table 16 Aluminum Composite Panels Market Size, By Region, 2015�2022 (Million Square Meters)
Table 17 North America: Aluminum Composite Panels Market Size, By Country, 2015�2022 (USD Million)
Table 18 North America: Aluminum Composite Panels Market Size, By Country, 2015�2022 (Million Square Meters)
Table 19 North America: Aluminum Composite Panels Market Size, Type, 2015�2022 (USD Million)
Table 20 North America: Aluminum Composite Panels Market Size, By Type, 2015�2022 (Million Square Meters)
Table 21 North America: Aluminum Composite Panels Market Size, By Application, 2015�2022 (USD Million)
Table 22 North America: Aluminum Composite Panels Market Size, By Application, 2015�2022 (Million Square Meters)
Table 23 US: Aluminum Composite Panels Market Size, By Type, 2015�2022 (USD Million)
Table 24 US: Aluminum Composite Panels Market Size, By Type, 2015�2022 (Million Square Meters)
Table 25 US: Aluminum Composite Panels Market Size, By Application, 2015�2022 (USD Million)
Table 26 US: Aluminum Composite Panels Market Size, By Application, 2015�2022 (Million Square Meters)
Table 27 Canada: Aluminum Composite Panels Market Size, By Type, 2015�2022 (USD Million)
Table 28 Canada: Aluminum Composite Panels Market Size, By Type, 2015�2022 (Million Square Meters)
Table 29 Canada: Aluminum Composite Panels Market Size, By Application, 2015�2022 (USD Million)
Table 30 Canada: Aluminum Composite Panels Market Size, By Application, 2015�2022 (Million Square Meters)
Table 31 Mexico: Aluminum Composite Panels Market Size, By Type, 2015�2022 (USD Million)
Table 32 Mexico: Aluminum Composite Panels Market Size, By Type, 2015�2022 (Million Square Meters)
Table 33 Mexico: Aluminum Composite Panels Market Size, By Application, 2015�2022 (USD Million)
Table 34 Mexico: Aluminum Composite Panels Market Size, By Application, 2015�2022 (Million Square Meters)
Table 35 Europe: Aluminum Composite Panels Market Size, By Country, 2015�2022 (USD Million)
Table 36 Europe: Aluminum Composite Panels Market Size, By Country, 2015�2022 (Million Square Meter)
Table 37 Europe: Aluminum Composite Panels Market Size, By Type, 2015�2022 (USD Million)
Table 38 Europe: Aluminum Composite Panels Market Size, By Type, 2015�2022 (Million Square Meter)
Table 39 Europe: Aluminum Composite Panels Market Size, By Application, 2015�2022 (USD Million)
Table 40 Europe: Aluminum Composite Panels Market Size, By Application, 2015�2022 (Million Square Meter)
Table 41 UK: Aluminum Composite Panels Market Size, By Type, 2015�2022 (USD Million)
Table 42 UK: Aluminum Composite Panels Market Size, By Type, 2015�2022 (Million Square Meter)
Table 43 UK: Aluminum Composite Panels Market, By Application, 2015�2022 (USD Million)
Table 44 UK: Aluminum Composite Panels Market Size, By Application, 2015�2022 (Million Square Meter)
Table 45 Russia: Aluminum Composite Panels Market Size, By Type, 2015�2022 (USD Million)
Table 46 Russia: Aluminum Composite Panels Market Size, By Type, 2015�2022 (Million Square Meter)
Table 47 Russia: Aluminum Composite Panels Market Size, By Application, 2015�2022 (USD Million)
Table 48 Russia: Aluminum Composite Panels Market Size, By Application, 2015�2022 (Million Square Meter)
Table 49 Germany: Aluminum Composite Panels Market Size, By Type, 2015�2022 (USD Million)
Table 50 Germany: Aluminum Composite Panels Market Size, By Type, 2015�2022 (Million Square Meter)
Table 51 Germany: Aluminum Composite Panels Market Size, By Application, 2015�2022 (USD Million)
Table 52 Germany: Aluminum Composite Panels Market Size, By Application, 2015�2022 (Million Square Meter)
Table 53 France: Aluminum Composite Panels Market Size, By Type, 2015�2022 (USD Million)
Table 54 France: Aluminum Composite Panels Market Size, By Type, 2015�2022 (Million Square Meter)
Table 55 France: Aluminum Composite Panels Market Size, By Application, 2015�2022 (USD Million)
Table 56 France: Aluminum Composite Panel Market Size, By Application, 2015�2022 (Million Square Meter)
Table 57 Spain: Aluminum Composite Panels Market Size, By Type, 2015�2022 (USD Million)
Table 58 Spain: Aluminum Composite Panels Market Size, By Type, 2015�2022 (Million Square Meter)
Table 59 Spain: Aluminum Composite Panels Market Size, By Application, 2015�2022 (USD Million)
Table 60 Spain: Aluminum Composite Panels Market Size, By Application, 2015�2022 (Million Square Meter)
Table 61 Italy: Aluminum Composite Panels Market Size, By Type, 2015�2022 (USD Million)
Table 62 Italy: Aluminum Composite Panels Market Size, By Type, 2015�2022 (Million Square Meter)
Table 63 Italy: Aluminum Composite Panels Market Size, By Application, 2015�2022 (USD Million)
Table 64 Italy: Aluminum Composite Panels Market Size, By Application, 2015�2022 (Million Square Meter)
Table 65 Rest of Europe: Aluminum Composite Panels Market Size, By Type, 2015�2022 (USD Million)
Table 66 Rest of Europe: Aluminum Composite Panels Market Size, By Type, 2015�2022 (Million Square Meter)
Table 67 Rest of Europe: Aluminum Composite Panels Market Size, By Application, 2015�2022 (USD Million)
Table 68 Rest of Europe: Aluminum Composite Panels Market Size, By Application, 2015�2022 (Million Square Meter)
Table 69 Asia Pacific: Aluminum Composite Panels Market Size, By Country, 2015�2022 (USD Million)
Table 70 Asia Pacific: Aluminum Composite Panels Market Size, By Country, 2015�2022 (Million Square Meters)
Table 71 Asia Pacific: Aluminum Composite Panels Market Size, By Type, 2015�2022 (USD Million)
Table 72 Asia Pacific: Aluminum Composite Panels Market Size, By Type, 2015�2022 (Million Square Meters)
Table 73 Asia Pacific: Aluminum Composite Panels Market Size, By Application, 2015�2022 (USD Million)
Table 74 Asia Pacific: Aluminum Composite Panels Market Size, By Application, 2015�2022 (Million Square Meters)
Table 75 China: Aluminum Composite Panels Market Size, By Type, 2015�2022 (USD Million)
Table 76 China: Aluminum Composite Panels Market Size, By Type, 2015�2022 (Million Square Meters)
Table 77 China: Aluminum Composite Panels Market Size, By Application, 2015�2022 (USD Million)
Table 78 China: Aluminum Composite Panels Market Size, By Application, 2015�2022 (Million Square Meters)
Table 79 India: Aluminum Composite Panels Market Size, By Type, 2015�2022 (USD Million)
Table 80 India: Aluminum Composite Panels Market Size, By Type, 2015�2022 (Million Square Meters)
Table 81 India: Aluminum Composite Panels Market Size, By Application, 2015�2022 (USD Million)
Table 82 India: Aluminum Composite Panels Market Size, By Application, 2015�2022 (Million Square Meters)
Table 83 Japan: Aluminum Composite Panels Market Size, By Type, 2015�2022 (USD Million)
Table 84 Japan: Aluminum Composite Panels Market Size, By Type, 2015�2022 (Million Square Meters)
Table 85 Japan: Aluminum Composite Panels Market Size, By Application, 2015�2022 (USD Million)
Table 86 Japan: Aluminum Composite Panels Market Size, By Application, 2015�2022 (Million Square Meters)
Table 87 Australia: Aluminum Composite Panels Market Size, By Type, 2015�2022 (USD Million)
Table 88 Australia: Aluminum Composite Panels Market Size, By Type, 2015�2022 (Million Square Meters)
Table 89 Australia: Aluminum Composite Panels Market Size, By Application, 2015�2022 (USD Million)
Table 90 Australia: Aluminum Composite Panels Market Size, By Application, 2015�2022 (Million Square Meters)
Table 91 South Korea: Aluminum Composite Panels Market Size, By Type, 2015�2022 (USD Million)
Table 92 South Korea: Aluminum Composite Panels Market Size, By Type, 2015�2022 (Million Square Meters)
Table 93 South Korea: Aluminum Composite Panels Market Size, By Application, 2015�2022 (USD Million)
Table 94 South Korea: Aluminum Composite Panels Market Size, By Application, 2015�2022 (Million Square Meters)
Table 95 Rest of Asia Pacific: Aluminum Composite Panels Market Size, By Type, 2015�2022 (USD Million)
Table 96 Rest of Asia Pacific: Aluminum Composite Panels Market Size, By Type, 2015�2022 (Million Square Meters)
Table 97 Rest of Asia Pacific: Aluminum Composite Panels Market Size, By Application, 2015�2022 (USD Million)
Table 98 Rest of Asia Pacific: Aluminum Composite Panels Market Size, By Application, 2015�2022 (Million Square Meters)
Table 99 Middle East & Africa: Aluminum Composite Panels Market Size, By Country, 2015�2022 (USD Million)
Table 100 Middle East & Africa: Aluminum Composite Panels Market Size, By Country, 2015�2022 (Million Square Meter)
Table 101 Middle East & Africa: Aluminum Composite Panels Market Size, By Type, 2015�2022 (USD Million)
Table 102 Middle East & Africa: Aluminum Composite Panels Market Size, By Type, 2015�2022 (Million Square Meter)
Table 103 Middle East & Africa: Aluminum Composite Panels Market Size, By Application, 2015�2022 (USD Million)
Table 104 Middle East & Africa: Aluminum Composite Panels Market Size, By Application, 2015�2022 (Million Square Meter)
Table 105 Turkey: Aluminum Composite Panels Market Size, By Type, 2015�2022 (USD Million)
Table 106 Turkey: Aluminum Composite Panels Market Size, By Type, 2015�2022 (Million Square Meter)
Table 107 Turkey: Aluminum Composite Panels Market Size, By Application, 2015�2022 (USD Million)
Table 108 Turkey: Aluminum Composite Panels Market Size, By Application, 2015�2022 (Million Square Meter)
Table 109 UAE: Aluminum Composite Panels Market Size, By Type, 2015�2022 (USD Million)
Table 110 UAE: Aluminum Composite Panels Market Size, By Type, 2015�2022 (Million Square Meter)
Table 111 UAE: Aluminum Composite Panels Market Size, By Application, 2015�2022 (USD Million)
Table 112 UAE: Aluminum Composite Panels Market Size, By Application, 2015�2022 (Million Square Meter)
Table 113 Saudi Arabia: Aluminum Composite Panels Market Size, By Type, 2015�2022 (USD Million)
Table 114 Saudi Arabia: Aluminum Composite Panels Market Size, By Type, 2015�2022 (Million Square Meter)
Table 115 Saudi Arabia: Aluminum Composite Panels Market Size, By Application, 2015�2022 (USD Million)
Table 116 Saudi Arabia: Aluminum Composite Panels Market Size, By Application, 2015�2022 (Million Square Meter)
Table 117 South Africa: Aluminum Composite Panels Market Size, By Type, 2015�2022 (USD Million)
Table 118 South Africa: Aluminum Composite Panels Market Size, By Type, 2015�2022 (Million Square Meter)
Table 119 South Africa: Aluminum Composite Panels Market Size, By Application, 2015�2022 (USD Million)
Table 120 South Africa: Aluminum Composite Panels Market Size, By Application, 2015�2022 (Million Square Meter)
Table 121 Rest of the Middle East & Africa: Aluminum Composite Panels Market Size, By Type, 2015�2022 (USD Million)
Table 122 Rest of the Middle East & Africa: Aluminum Composite Panels Market Size, By Type, 2015�2022 (Million Square Meter)
Table 123 Rest of the Middle East & Africa: Aluminum Composite Panels Market Size, By Application, 2015�2022 (USD Million)
Table 124 Rest of the Middle East & Africa: Aluminum Composite Panels Market Size, By Application, 2015�2022 (Million Square Meter)
Table 125 South America: Aluminum Composite Panels Market Size, By Country, 2015�2022 (USD Million)
Table 126 South America: Aluminum Composite Panels Market Size, By Country, 2015�2022 (Million Square Meters)
Table 127 South America: Aluminum Composite Panels Market Size, By Type, 2015�2022 (USD Million)
Table 128 South America: Aluminum Composite Panels Market Size, By Type, 2015�2022 (Million Square Meters)
Table 129 South America: Aluminum Composite Panels Market Size, By Application, 2015�2022 (USD Million)
Table 130 South America: Aluminum Composite Panels Market Size, By Application, 2015�2022 (Million Square Meters)
Table 131 Brazil: Aluminum Composite Panels Market Size, By Type, 2015�2022 (USD Million)
Table 132 Brazil: Aluminum Composite Panels Market Size, By Type, 2015�2022 (Million Square Meters)
Table 133 Brazil: Aluminum Composite Panels Market Size, By Application, 2015�2022 (USD Million)
Table 134 Brazil: Aluminum Composite Panels Market Size, By Application, 2015�2022 (Million Square Meters)
Table 135 Argentina: Aluminum Composite Panels Market Size, By Type, 2015�2022 (USD Million)
Table 136 Argentina: Aluminum Composite Panels Market Size, By Type, 2015�2022 (Million Square Meters)
Table 137 Argentina: Aluminum Composite Panels Market Size, By Application, 2015�2022 (USD Million)
Table 138 Argentina: Aluminum Composite Panels Market Size, By Application, 2015�2022 (Million Square Meters)
Table 139 Rest of South America: Aluminum Composite Panels Market Size, By Type, 2015�2022 (USD Million)
Table 140 Rest of South America: Aluminum Composite Panels Market Size, By Type, 2015�2022 (Million Square Meters)
Table 141 Rest of South America: Aluminum Composite Panels Market Size, By Application, 2015�2022 (USD Million)
Table 142 Rest of South America: Aluminum Composite Panels Market Size, By Application, 2015�2022 (Million Square Meters)
Table 143 Market Ranking of Key Players, 2016
Table 144 New Product Launches, 2014�2017
Table 145 Acquisitions, 2014�2017
Table 146 Expansions, Divestures & Investments, 2014�2017
List of Figures (30 Figures)
Figure 1 Aluminum Composite Panels Market: Segmentation
Figure 2 Aluminum Composite Panels Market, By Region
Figure 3 Aluminum Composite Panels Market: Research Design
Figure 4 Aluminum Composite Panels Market: Data Triangulations
Figure 5 Fire-Resistant Panels are Projected to Remain the Largest Type Through 2022
Figure 6 PVDF is Estimated to Account for the Largest Share in the Aluminum Composite Panels Market Through 2022
Figure 7 Building & Construction Application is to Lead the Market for Aluminum Composite Panels Through 2022
Figure 8 The Core Material Segment is Projected to Dominate the Aluminum Composite Panels Market Through 2022
Figure 9 Asia Pacific Dominated the Aluminum Composite Panels Market in 2016
Figure 10 Building & Construction to Drive the Aluminum Composite Panels Market During the Forecast Period
Figure 11 Fire-Resistant Segment, By Type, to Grow at the Highest Rate During the Forecast Period
Figure 12 The Building & Construction Segment Captured the Largest Share in the Asia Pacific Market, in 2016
Figure 13 India to Be Emerging Hotspot in Global Aluminum Composite Panels Market During Forecast Period
Figure 14 Drivers, Restraints, Opportunities, and Challenges in the Aluminum Composite Panels Market
Figure 15 Porter�s Five Forces Analysis
Figure 16 Trends of Residential and Non-Residential Construction Industries in North America
Figure 17 PVDF is Projected to Register the Highest Growth Rate Through 2022
Figure 18 Fire-Resistant Aluminum Composite Panels Segment to Dominate the Market Through 2022
Figure 19 Core Material is Projected to Register the Highest Growth Rate Through 2022
Figure 20 Building & Construction is Projected to Record the Highest Demand for Aluminum Composite Panels Through 2022
Figure 21 Geographic Snapshot (2017�2022): India is Projected to Grow at the Highest Rate, in Terms of Value
Figure 22 European Aluminum Composite Panels Market Snapshot: UK to Be the Fastest-Growing Market From 2017 to 2022
Figure 23 Asia Pacific Aluminum Composite Panels Market Snapshot: India is Projected to Be the Fastest-Growing Market Between 2017 & 2022
Figure 24 Companies Adopted New Product Launches as Key Growth Strategies Between 2014 and 2017
Figure 25 2014 Was the Most Active Year for Companies in the Aluminum Composite Panels Market
Figure 26 Arconic: Company Snapshot
Figure 27 Arconic Inc.: SWOT Analysis
Figure 28 Yaret Industrial Group: SWOT Analysis
Figure 29 Mitsubishi Chemical: Company Snapshot
Figure 30 Mitsubishi Chemical: SWOT Analysis


Growth opportunities and latent adjacency in Aluminum Composite Panels Market