Fatty Amines Market by Type (Primary, Secondary, and Tertiary), End Use (Agrochemicals, Oilfield Chemicals, Chemical Processing, Water Treatment), Function (Emulsifiers, Floatation Agents, Dispersants, Chemical Intermediates), Region - Global Forecast to 2024


Fatty Amines Market
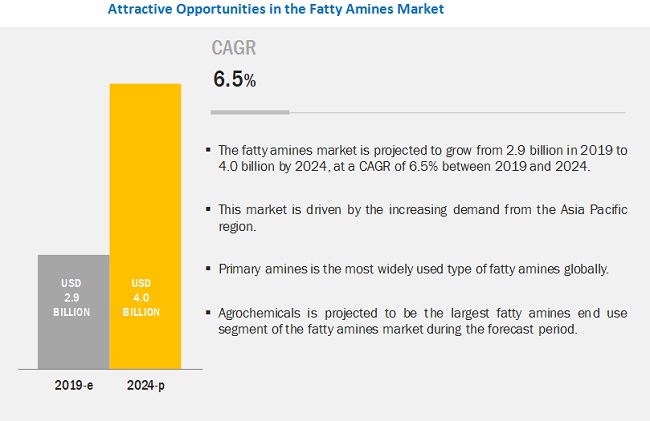
The global fatty amines market was valued at USD 2.9 billion in 2019 and is projected to reach USD 4.0 billion by 2024, growing at 6.5% cagr during the forecast period. The growing demand for agrochemicals in the agriculture industry is driving the growth of the market. The acquisitions, as well as plant and distribution channel expansions made by many prominent players in the fatty amines industry, are the key factors driving the growth of the market across the globe. Factors such as changing technology within the additives industry, driven by cost, low VOC, and other legislation, are expected to upsurge the demand for bio-based, environment-friendly additives in the paints & coatings industry, which in turn is expected to upsurge the fatty amines market, thus acting as an opportunity for the worldwide growth of the market.
Based on type, the tertiary fatty amines segment is projected to grow at the highest CAGR in terms of both, value and volume from 2019 to 2024.
Based on type, the tertiary fatty amines segment is projected to grow at the highest CAGR in terms of both, value and volume during the forecast period. Tertiary fatty amines, along with their derivatives such as the corresponding quaternary ammonium compounds, have wide-ranging applications, such as fabric softeners, surfactants, drilling muds, asphalt emulsifiers, and disinfectants/bactericides. The growth in this market is mainly attributed to the wide-ranging applications of tertiary amines.
Based on end use, the agrochemicals segment is projected to dominate the fatty amines market from 2019 to 2024 in terms of both, value and volume.
Based on end use, the fatty amines market has been segmented into agrochemicals, oilfield chemicals, chemical processing, water treatment, asphalt additives, personal care, and others. The other end uses in fatty amines include paints & coatings, household, and building construction. The agrochemicals end use segment is projected to lead the market during the forecast period in terms of both, value and volume. The growth of this segment can be attributed to the increase in the global demand for nutritious and high-quality food and the limited availability of arable land—this is driving the demand for agrochemicals, thus propelling the demand for the agrochemicals end use segment of the fatty amines market.
Based on function, the emulsifiers segment is projected to dominate the fatty amines market from 2019 to 2024 in terms of both, value and volume.
Based on function, the emulsifiers segment is projected to lead the market during the forecast period in terms of both, value and volume. The growth of this segment can be attributed to the extensive use of fatty amines as emulsifiers in various end uses, such as agrochemicals, chemical processing, personal care, and household.
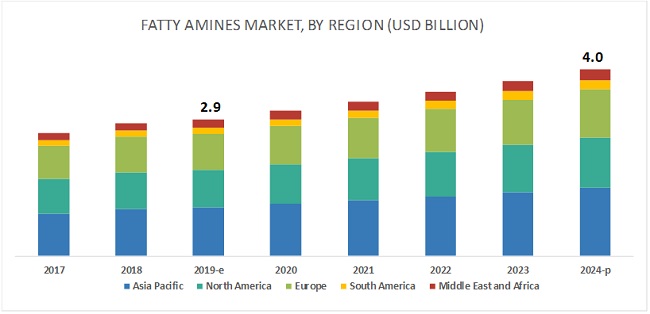
The Asia Pacific region is projected to lead the fatty amines market during the forecast period in terms of both, value and volume.
The Asia Pacific region is projected to lead the fatty amines market from 2019 to 2024 in terms of both, value and volume. The demand for fatty amines is increasing in Asia Pacific owing to the rising focus of the governments of countries like China, Japan, and Thailand on wastewater treatment infrastructure. Also, the growing demand for personal care and beauty products is set to fuel the demand for fatty amines. The market in this region is also projected to continue its dominance in terms of both, value and volume from 2019 to 2024, owing to the rising pressure on the agriculture sector in the Asia Pacific region.
Fatty Amines Market Players
Kao Corporation (Japan), Nouryon (Netherlands), Arkema S.A. (France), Lonza Group Ltd (Switzerland), Solvay SA (Belgium), Evonik Industries AG (Germany), Huntsman Corporation (US), Volant-Chem Corp. (China), Global Amines Company Pte. Ltd. (Singapore), India Glycols Limited (India), Indo Amines Limited (India), Procter & Gamble Co (US), ERCA SPA (Italy), Qida Chemical Co., Limited (China), Wuhan Obayer Science Co, Ltd. (China), and Ecogreen Oleochemicals GmbH (Germany) are some of the leading players operating in the fatty amines market. These players have adopted the strategies of expansions, acquisitions, divestments, collaborations, and joint ventures to enhance their position in the market.
Fatty Amines Market Report Scope
|
Report Metric |
Details |
|
Market Size Value in 2019 |
USD 2.9 billion |
|
Revenue Forecast in 2024 |
USD 4.0 billion |
|
CAGR |
6.5% |
|
Market Size Available for Years |
2017–2024 |
|
Base Year Considered |
2018 |
|
Forecast Period |
2019–2024 |
|
Forecast Units |
Value (USD Million) and Volume (KT and Tons) |
|
Segments Covered |
Type, End Use, Function, and Region |
|
Geographies Covered |
Asia Pacific, North America, Europe, Middle East & Africa, and South America |
|
Companies Covered |
Kao Corporation (Japan), Arkema S.A. (France), Lonza Group Ltd (Switzerland), Nouryon (Netherlands), Solvay SA (Belgium), Evonik Industries AG (Germany), Huntsman Corporation (US), Volant-Chem Corp. (China) |
This research report categorizes the fatty amines market based on type, end use, function, and region.
Based on Type:
- Primary
- Secondary
- Tertiary
Based on End-Use:
- Agrochemicals
- Oilfield Chemicals
- Chemical Processing
- Water Treatment
- Asphalt Additives
- Personal Care
-
Others
- Paints & Coatings
- Household
- Building Construction
Based on Function:
- Emulsifiers
- Floatation Agents
- Anti-caking Agents
- Dispersants
- Corrosion Inhibitors
- Chemical Intermediates
-
Others
- Epoxy Curing Agents
- Fabric Softeners
- Pigment Wetting Agents
- Germicides
- Antiseptic Agents
Based on Region:
- Asia Pacific
- North America
- Europe
- Middle East & Africa
- South America
Key Questions Addressed by the Report
- How are the developments undertaken by various companies expected to affect the fatty amines market in the mid- to long-term?
- What are the upcoming industry end uses of fatty amines?
- What is the impact of changes in government policies on the fatty amines market?
- What is the estimated size of the fatty amines market in 2019?
- What are the different functions of fatty amines?
To speak to our analyst for a discussion on the above findings, click Speak to Analyst
Table of Contents
1 Introduction (Page No. - 18)
1.1 Objectives of the Study
1.2 Market Definition
1.3 Scope of the Study
1.3.1 Years Considered for the Study
1.4 Currency Considered
1.4.1 Package Size
1.5 Stakeholders
2 Research Methodology (Page No. - 21)
2.1 Research Data
2.1.1 Secondary Data
2.1.1.1 Key Secondary Sources
2.1.2 Primary Data
2.1.2.1 Key Data From Primary Sources
2.1.2.2 Key Industry Insights
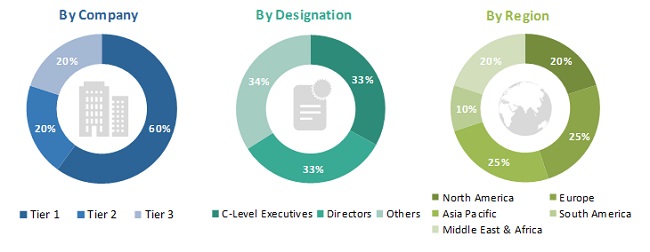
2.1.2.3 Breakdown of Primary Interviews
2.2 Market Size Estimation
2.2.1 Primary and Secondary Research
2.3 Data Triangulation
2.4 Research Assumptions and Limitations
2.4.1 Limitations
3 Executive Summary (Page No. - 29)
4 Premium Insights (Page No. - 33)
4.1 Attractive Opportunities in the Fatty Amines Market
4.2 Asia Pacific Fatty Amines Market, By Type
4.3 Fatty Amines Market, By Type
4.4 Fatty Amines Market, By End Use
4.5 Fatty Amines Market, By Function
4.6 Fatty Amines Market Growth
5 Market Overview (Page No. - 36)
5.1 Introduction
5.2 Market Segmentation
5.3 Market Dynamics
5.3.1 Drivers
5.3.1.1 Increasing Demand From the Agriculture Sector
5.3.1.2 Growing GDP in Asia Pacific LED By Rising Industrialization
5.3.2 Restraints
5.3.2.1 Complex Production Process
5.3.3 Opportunities
5.3.3.1 Rising Demand for Bio-Based Coating Additives
5.3.4 Challenges
5.3.4.1 Limited Availability of Manufacturing Technology
5.3.4.2 Environmental Concerns Regarding Ammonia as A By-Product
6 Industry Trends (Page No. - 43)
6.1 Introduction
6.2 Porter’s Five Forces Analysis
6.2.1 Bargaining Power of Suppliers
6.2.2 Threat of Substitutes
6.2.3 Bargaining Power of Buyers
6.2.4 Threat of New Entrants
6.2.5 Rivalry Among Existing Competitors
7 Fatty Amines Market, By Type (Page No. - 46)
7.1 Introduction
7.2 Primary
7.3 Secondary
7.4 Tertiary
8 Fatty Amines Market, By End Use (Page No. - 52)
8.1 Introduction
8.2 Agrochemicals
8.3 Oilfield Chemicals
8.4 Chemical Processing
8.5 Water Treatment
8.6 Asphalt Additives
8.7 Personal Care
8.8 Others
9 Fatty Amines Market, By Function (Page No. - 62)
9.1 Introduction
9.2 Emulsifiers
9.3 Floatation Agents
9.4 Anti-Caking Agents
9.5 Dispersants
9.6 Corrosion Inhibitors
9.7 Chemical Intermediates
9.8 Others
10 Fatty Amines Market, By Region (Page No. - 65)
10.1 Introduction
10.2 Asia Pacific
10.2.1 China
10.2.2 Japan
10.2.3 India
10.2.4 South Korea
10.2.5 Thailand
10.2.6 Malaysia
10.2.7 Rest of Asia Pacific
10.3 North America
10.3.1 US
10.3.2 Canada
10.3.3 Mexico
10.4 Europe
10.4.1 Germany
10.4.1.1 Germany is the Largest Consumer of Fatty Amines in Europe
10.4.2 France
10.4.2.1 By End Use, the Agrochemicals Segment Dominated the Fatty Amines Market in France in 2018
10.4.3 Russia
10.4.3.1 Intensive Use of Agrochemicals is Driving the Fatty Amines Market in Russia
10.4.4 UK
10.4.4.1 The UK Will have the Highest CAGR in Europe, in Terms of Value
10.4.5 Turkey
10.4.5.1 By Type, Primary Fatty Amines Dominated the Market in Turkey in 2018
10.4.6 Italy
10.4.6.1 By Type, Tertiary Fatty Amines are Projected to Grow at the Highest Rate in Italy
10.4.7 Rest of Europe
10.5 Middle East & Africa
10.5.1 Saudi Arabia
10.5.1.1 Saudi Arabia is the Largest Consumer of Fatty Amines in the Middle East & Africa
10.5.2 South Africa
10.5.2.1 By Type, Tertiary Fatty Amines to have the Highest CAGR in South Africa
10.5.3 Egypt
10.5.3.1 By End Use, Agrochemicals is Projected to Dominate During the Forecast Period in Egypt
10.5.4 Rest of Middle East & Africa
10.5.4.1 Growth of Industrial Sector to Drive the Market in the Rest of Middle East & Africa
10.6 South America
10.6.1 Brazil
10.6.2 Argentina
10.6.3 Colombia
10.6.4 Rest of South America
11 Competitive Landscape (Page No. - 123)
11.1 Overview
11.2 Competitive Landscape Mapping, 2019
11.2.1 Visionary Leaders
11.2.2 Innovators
11.2.3 Dynamic Differentiators
11.2.4 Emerging Companies
11.3 Competitive Benchmarking
11.3.1 Strength of Product Portfolio
11.3.2 Business Strategy Excellence
11.4 Market Ranking of Key Players
11.5 Competitive Scenario
11.5.1 Expansions
11.5.2 Acquisitions
11.5.3 Divestments
11.5.4 Collaborations
11.5.5 Joint Ventures
12 Company Profiles (Page No. - 134)
(Business Overview, Products Offered, Recent Developments, SWOT Analysis, MnM View)*
12.1 Arkema S.A.
12.2 Ecogreen Oleochemicals GmbH
12.3 ERCA SPA
12.4 Evonik Industries AG
12.5 Global Amines Company Pte. LTD.
12.6 Huntsman Corporation
12.7 India Glycols Limited
12.8 Indo Amines Limited
12.9 KAO Corporation
12.10 Lonza Group LTD
12.11 Nouryon
12.12 Procter & Gamble Co
12.13 Qida Chemical Co., Limited
12.14 Solvay SA
12.15 Volant-Chem Corp.
12.16 Wuhan Obayer Science Co, LTD.
12.17 Other Companies
12.17.1 Albemarle Corporation
12.17.2 BASF SE
12.17.3 Eastman Chemical Company
12.17.4 Harcros
12.17.5 Innospec Inc.
12.17.6 Isfahan Copolymer Co. (Icc)
12.17.7 Klk Oleo
12.17.8 Oxiteno
12.17.9 Rimpro India
12.17.10 Sabo S.P.A.
12.17.11 Shandong Dafeng Biotechnology Co., LTD.
12.17.12 Shandong Fusite Oil Technology Co., LTD.
12.17.13 Temix Oleo Srl
12.17.14 Tenghui Oil & Fat Chemical Co., LTD.
12.17.15 Venus Ethoxyethers Pvt. LTD.
*Details on Business Overview, Products Offered, Recent Developments, SWOT Analysis, MnM View Might Not Be Captured in Case of Unlisted Companies.
13 Appendix (Page No. - 171)
13.1 Discussion Guide
13.2 Knowledge Store: Marketsandmarkets Subscription Portal
13.3 Available Customizations
13.4 Related Reports
13.5 Author Details
List of Tables (176 Tables)
Table 1 Fatty Amines Market
Table 2 Fatty Amines Market, By Type
Table 3 Fatty Amines Market, By End Use
Table 4 Fatty Amines Market, By Function
Table 5 GDP Growth of Key Countries in Asia Pacific
Table 6 Industrial Growth Rate of Key Countries in Asia Pacific, 2018
Table 7 Fatty Amines Market Size, By Type, 2017–2024 (USD Million)
Table 8 Fatty Amines Market Size, By Type, 2017–2024 (KT)
Table 9 Primary Amines Market Size, By Region, 2017–2024 (USD Million)
Table 10 Primary Amines Market Size, By Region, 2017–2024 (Tons)
Table 11 Secondary Amines Market Size, By Region, 2017–2024 (USD Million)
Table 12 Secondary Amines Market Size, By Region, 2017–2024 (Tons)
Table 13 Tertiary Amines Market Size, By Region, 2017–2024 (USD Million)
Table 14 Tertiary Amines Market Size, By Region, 2017–2024 (Tons)
Table 15 Fatty Amines Market Size, By End Use, 2017–2024 (USD Million)
Table 16 Fatty Amines Market Size, By End Use, 2017–2024 (KT)
Table 17 Agrochemicals: Fatty Amines Market Size, By Region, 2017–2024 (USD Million)
Table 18 Agrochemicals: Fatty Amines Market Size, By Region, 2017–2024 (Tons)
Table 19 Oilfield Chemicals: Fatty Amines Market Size, By Region, 2017–2024 (USD Million)
Table 20 Oilfield Chemicals: Fatty Amines Market Size, By Region, 2017–2024 (Tons)
Table 21 Chemical Processing: Fatty Amines Market Size, By Region, 2017–2024 (USD Million)
Table 22 Chemical Processing: Fatty Amines Market Size, By Region, 2017–2024 (KT)
Table 23 Water Treatment: Fatty Amines Market Size, By Region, 2017–2024 (USD Million)
Table 24 Water Treatment: Fatty Amines Market Size, By Region, 2017–2024 (KT)
Table 25 Asphalt Additives: Fatty Amines Market Size, By Region, 2017–2024 (USD Million)
Table 26 Asphalt Additives: Fatty Amines Market Size, By Region, 2017–2024 (Tons)
Table 27 Personal Care: Fatty Amines Market Size, By Region, 2017–2024 (USD Million)
Table 28 Personal Care: Fatty Amines Market Size, By Region, 2017–2024 (Tons)
Table 29 Others: Fatty Amines Market Size, By Region, 2017–2024 (USD Million)
Table 30 Others: Fatty Amines Market Size, By Region, 2017–2024 (Tons)
Table 31 Fatty Amines Market Size, By Function, 2017–2024 (USD Million)
Table 32 Fatty Amines Market Size, By Function, 2017–2024 (KT)
Table 33 Fatty Amines Market Size, By Region, 2017–2024 (USD Million)
Table 34 Fatty Amines Market Size, By Region, 2017–2024 (KT)
Table 35 Fatty Amines Market Size, By End Use, 2017–2024 (USD Million)
Table 36 Fatty Amines Market Size, By End Use, 2017–2024 (KT)
Table 37 Fatty Amines Market Size, By Type, 2017–2024 (USD Million)
Table 38 Fatty Amines Market Size, By Type, 2017–2024 (KT)
Table 39 Fatty Amines Market Size, By Function, 2017–2024 (USD Million)
Table 40 Fatty Amines Market Size, By Function, 2017–2024 (KT)
Table 41 Asia Pacific: Fatty Amines Market Size, By Country, 2017–2024 (USD Million)
Table 42 Asia Pacific: Fatty Amines Market Size, By Country, 2017–2024 (Tons)
Table 43 Asia Pacific: Fatty Amines Market Size, By Type, 2017–2024 (USD Million)
Table 44 Asia Pacific: Fatty Amines Market Size, By Type, 2017–2024 (Tons)
Table 45 Asia Pacific: Fatty Amines Market Size, By End Use, 2017–2024 (USD Million)
Table 46 Asia Pacific: Fatty Amines Market Size, By End Use, 2017–2024 (Tons)
Table 47 China: Fatty Amines Market Size, By Type, 2017–2024 (USD Million)
Table 48 China: Fatty Amines Market Size, By Type, 2017–2024 (Tons)
Table 49 China: Fatty Amines Market Size, By End Use, 2017–2024 (USD Million)
Table 50 China: Fatty Amines Market Size, By End Use, 2017–2024 (Tons)
Table 51 Japan: Fatty Amines Market Size, By Type, 2017–2024 (USD Million)
Table 52 Japan: Fatty Amines Market Size, By Type, 2017–2024 (Tons)
Table 53 Japan: Fatty Amines Market Size, By End Use, 2017–2024 (USD Million)
Table 54 Japan: Fatty Amines Market Size, By End Use, 2017–2024 (Tons)
Table 55 India: Fatty Amines Market Size, By Type, 2017–2024 (USD Million)
Table 56 India: Fatty Amines Market Size, By Type, 2017–2024 (Tons)
Table 57 India: Fatty Amines Market Size, By End Use, 2017–2024 (USD Million)
Table 58 India: Fatty Amines Market Size, By End Use, 2017–2024 (Tons)
Table 59 South Korea: Fatty Amines Market Size, By Type, 2017–2024 (USD Million)
Table 60 South Korea: Fatty Amines Market Size, By Type, 2017–2024 (Tons)
Table 61 South Korea: Fatty Amines Market Size, By End Use, 2017–2024 (USD Million)
Table 62 South Korea: Fatty Amines Market Size, By End Use, 2017–2024 (Tons)
Table 63 Thailand: Fatty Amines Market Size, By Type 2017–2024 (USD Million)
Table 64 Thailand: Fatty Amines Market Size, By Type, 2017–2024 (Tons)
Table 65 Thailand: Fatty Amines Market Size, By End Use, 2017–2024 (USD Million)
Table 66 Thailand: Fatty Amines Market Size, By End Use, 2017–2024 (Tons)
Table 67 Malaysia: Fatty Amines Market Size, By Type, 2017–2024 (USD Million)
Table 68 Malaysia: Fatty Amines Market Size, By Type, 2017–2024 (Tons)
Table 69 Malaysia: Fatty Amines Market Size, By End Use, 2017–2024 (USD Million)
Table 70 Malaysia: Fatty Amines Market Size, By End Use, 2017–2024 (Tons)
Table 71 Rest of Asia Pacific: Fatty Amines Market Size, By Type, 2017–2024 (USD Million)
Table 72 Rest of Asia Pacific: Fatty Amines Market Size, By Type, 2017–2024 (Tons)
Table 73 Rest of Asia Pacific: Fatty Amines Market Size, By End Use, 2017–2024 (USD Million)
Table 74 Rest of Asia Pacific: Fatty Amines Market Size, By End Use, 2017–2024 (Tons)
Table 75 North America: Fatty Amines Market Size, By Country, 2017–2024 (USD Million)
Table 76 North America: Fatty Amines Market Size, By Country, 2017–2024 (Tons)
Table 77 North America: Fatty Amines Market Size, By Type, 2017–2024 (USD Million)
Table 78 North America Fatty Amines Market, By Type, 2017–2024 (Tons)
Table 79 North America Fatty Amines Market Size, By End Use, 2017–2024 (USD Million)
Table 80 North America Fatty Amines Market Size, By End Use, 2017–2024 (Tons)
Table 81 World and US Pesticide Expenditures at the Producer Level, By Pesticide Type, 2012 Estimates
Table 82 US: Fatty Amines Market Size, By Type, 2017–2024 (USD Million)
Table 83 US: Fatty Amines Market Size, By Type, 2017–2024 (Tons)
Table 84 US: Fatty Amines Market Size, By End Use, 2017–2024 (USD Million)
Table 85 US: Fatty Amines Market Size, By End Use, 2017–2024 (Tons)
Table 86 Canada: Fatty Amines Market Size, By Type, 2017–2024 (USD Million)
Table 87 Canada: Fatty Amines Market Size, By Type, 2017–2024 (Tons)
Table 88 Canada: Fatty Amines Market Size, By End Use, 2017–2024 (USD Million)
Table 89 Canada: Fatty Amines Market Size, By End Use, 2017–2024 (Tons)
Table 90 Mexico: Fatty Amines Market Size, By Type, 2017–2024 (USD Million)
Table 91 Mexico: Fatty Amines Market, By Type, 2017–2024 (Tons)
Table 92 Mexico: Fatty Amines Market, By End Use, 2017–2024 (USD Million)
Table 93 Mexico: Fatty Amines Market, By End Use, 2017–2024 (Tons)
Table 94 Europe: Fatty Amines Market Size, By Country, 2017—2024 (USD Million)
Table 95 Europe: Fatty Amines Market Size, By Country, 2017—2024 (Tons)
Table 96 Europe: Fatty Amines Market Size, By Type, 2017—2024 (USD Million)
Table 97 Europe: Fatty Amines Market Size, By Type, 2017—2024 (Tons)
Table 98 Europe: Fatty Amines Market Size, By End Use, 2017–2024 (USD Million)
Table 99 Europe: Fatty Amines Market Size, By End Use, 2017—2024 (Tons)
Table 100 Germany: Fatty Amines Market Size, By Type, 2017—2024 (USD Million)
Table 101 Germany: Fatty Amines Market Size, By Type, 2017—2024 (Tons)
Table 102 Germany: Fatty Amines Market Size, By End Use, 2017–2024 (USD Million)
Table 103 Germany: Fatty Amines Market Size, By End Use, 2017—2024 (Tons)
Table 104 France: Fatty Amines Market Size, By Type, 2017—2024 (USD Million)
Table 105 France: Fatty Amines Market Size, By Type, 2017—2024 (Tons)
Table 106 France: Fatty Amines Market Size, By End Use, 2017–2024 (USD Million)
Table 107 France: Fatty Amines Market Size, By End Use, 2017—2024 (Tons)
Table 108 Russia: Fatty Amines Market Size, By Type, 2017—2024 (USD Million)
Table 109 Russia: Fatty Amines Market Size, By Type, 2017—2024 (Tons)
Table 110 Russia: Fatty Amines Market Size, By End Use, 2017–2024 (USD Million)
Table 111 Russia: Fatty Amines Market Size, By End Use, 2017—2024 (Tons)
Table 112 UK: Fatty Amines Market Size, By Type, 2017—2024 (USD Million)
Table 113 UK: Fatty Amines Market Size, By Type, 2017—2024 (Tons)
Table 114 UK: Fatty Amines Market Size, By End Use, 2017–2024 (USD Million)
Table 115 UK: Fatty Amines Market Size, By End Use, 2017—2024 (Tons)
Table 116 Turkey: Fatty Amines Market Size, By Type, 2017—2024 (USD Million)
Table 117 Turkey: Fatty Amines Market Size, By Type, 2017—2024 (Tons)
Table 118 Turkey: Fatty Amines Market Size, By End Use, 2017–2024 (USD Million)
Table 119 Turkey: Fatty Amines Market Size, By End Use, 2017—2024 (Tons)
Table 120 Italy: Fatty Amines Market Size, By Type, 2017—2024 (USD Million)
Table 121 Italy: Fatty Amines Market Size, By Type, 2017—2024 (Tons)
Table 122 Italy: Fatty Amines Market Size, By End Use, 2017–2024 (USD Million)
Table 123 Italy: Fatty Amines Market Size, By End Use, 2017—2024 (Tons)
Table 124 Rest of Europe: Fatty Amines Market Size, By Type, 2017—2024 (USD Million)
Table 125 Rest of Europe: Fatty Amines Market Size, By Type, 2017—2024 (Tons)
Table 126 Rest of Europe: Fatty Amines Market Size, By End Use, 2017–2024 (USD Million)
Table 127 Rest of Europe: Fatty Amines Market Size, By End Use, 2017—2024 (Tons)
Table 128 Middle East & Africa: Fatty Amines Market Size, By Country, 2017–2024 (USD Million)
Table 129 Middle East & Africa: Fatty Amines Market Size, By Country, 2017–2024 (Tons)
Table 130 Middle East & Africa: Fatty Amines Market Size, By Type, 2017–2024 (USD Million)
Table 131 Middle East & Africa: Fatty Amines Market Size, By Type, 2017–2024 (Tons)
Table 132 Middle East & Africa: Fatty Amines Market Size, By End Use, 2017–2024 (USD Million)
Table 133 Middle East & Africa: Fatty Amines Market Size, By End Use, 2017–2024 (Tons)
Table 134 Saudi Arabia: Fatty Amines Market Size, By Type, 2017–2024 (USD Million)
Table 135 Saudi Arabia: Fatty Amines Market Size, By Type, 2017–2024 (Tons)
Table 136 Saudi Arabia: Fatty Amines Market Size, By End Use, 2017–2024 (USD Million)
Table 137 Saudi Arabia: Fatty Amines Market Size, By End Use, 2017–2024 (Tons)
Table 138 South Africa: Fatty Amines Market Size, By Type, 2017–2024 (USD Million)
Table 139 South Africa: Fatty Amines Market Size, By Type, 2017–2024 (Tons)
Table 140 South Africa: Fatty Amines Market Size, By End Use, 2017–2024 (USD Million)
Table 141 South Africa: Fatty Amines Market Size, By End Use, 2017–2024 (Tons)
Table 142 Egypt: Fatty Amines Market Size, By Type, 2017–2024 (USD Million)
Table 143 Egypt: Fatty Amines Market Size, By Type, 2017–2024 (Tons)
Table 144 Egypt: Fatty Amines Market Size, By End Use, 2017–2024 (USD Million)
Table 145 Egypt: Fatty Amines Market Size, By End Use, 2017–2024 (Tons)
Table 146 Rest of Middle East & Africa: Fatty Amines Market Size, By Type, 2017–2024 (USD Million)
Table 147 Rest of Middle East & Africa: Fatty Amines Market Size, By Type, 2017–2024 (Tons)
Table 148 Rest of Middle East & Africa: Fatty Amines Market Size, By End Use, 2017–2024 (USD Million)
Table 149 Rest of Middle East & Africa: Fatty Amines Market Size, By End Use, 2017–2024 (Tons)
Table 150 South America: Fatty Amines Market Size, By Country, 2017–2024 (USD Million)
Table 151 South America: Fatty Amines Market Size, By Country, 2017-2024 (Tons)
Table 152 South America: Fatty Amines Market Size, By End Use, 2017-2024 (USD Million)
Table 153 South America: Fatty Amines Market Size, By End Use, 2017-2024 (Tons)
Table 154 South America: Fatty Amines Market Size, By Type, 2017-2024 (USD Million)
Table 155 South America: Fatty Amines Market Size, By Type, 2017-2024 (Tons)
Table 156 Brazil: Fatty Amines Market Size, By End Use, 2017-2024 (USD Million)
Table 157 Brazil: Fatty Amines Market Size, By End Use, 2017-2024 (Tons)
Table 158 Brazil: Fatty Amines Market, By Type, 2017-2024 (USD Million)
Table 159 Brazil: Fatty Amines Market, By Type, 2017-2024 (Tons)
Table 160 Argentina: Fatty Amines Market Size, By End Use, 2017–2024 (USD Million)
Table 161 Argentina: Fatty Amines Market Size, By End Use, 2017–2024 (Tons)
Table 162 Argentina: Fatty Amines Market Size, By Type, 2017–2024 (USD Million)
Table 163 Argentina: Fatty Amines Market Size, By Type, 2017–2024 (Tons)
Table 164 Colombia: Fatty Amines Composites Market Size, By Type, 2017–2024 (USD Million)
Table 165 Colombia: Fatty Amines Composites Market Size, By Type, 2017–2024 (Tons)
Table 166 Colombia: Fatty Amines Market Size, By End Use, 2017–2024 (USD Million)
Table 167 Colombia: Fatty Amines Market Size, By End Use, 2017–2024 (Tons)
Table 168 Rest of South America: Fatty Amines Market Size, By Type, 2017–2024 (USD Million)
Table 169 Rest of South America: Fatty Amines Market Size, By Type, 2017–2024 (Tons)
Table 170 Rest of South America: Fatty Amines Market Size, By End Use, 2017–2024 (USD Million)
Table 171 Rest of South America: Fatty Amines Market Size, By End Use, 2017–2024 (Tons)
Table 172 Expansions, 2016–2019
Table 173 Acquisitions, 2016–2019
Table 174 Divestments, 2016–2019
Table 175 Collaborations, 2016–2019
Table 176 Joint Ventures, 2016–2019
List of Figures (38 Figures)
Figure 1 Fatty Amines: Market Segmentation
Figure 2 Fatty Amines Market: Research Design
Figure 3 Market Size Estimation
Figure 4 Market Size Estimation: By End Use
Figure 5 Forecast Number Calculation
Figure 6 Data Triangulation
Figure 7 Tertiary Amines are Projected to have the Highest CAGR During the Forecast Period, in Terms of Value
Figure 8 Agrochemicals Segment Projected to Lead the Fatty Amines Market During Forecast Period, in Terms of Value
Figure 9 Emulsifiers Segment Projected to Lead the Fatty Amines Market During Forecast Period, in Terms of Value
Figure 10 Asia Pacific Estimated to Account for the Largest Share of the Fatty Amines Market in 2019
Figure 11 The Fatty Amines Market is Projected to Witness Sluggish Growth During the Forecast Period
Figure 12 Primary Fatty Amines and China Estimated to Dominate the Asia Pacific Fatty Amines Market in 2019, By Volume
Figure 13 Primary Fatty Amines is Projected to Lead the Fatty Amines Market During the Forecast Period, By Volume
Figure 14 Agrochemicals Segment is Projected to Lead the Fatty Amines Market During the Forecast Period, By Volume
Figure 15 Emulsifiers Segment is Projected to Lead the Fatty Amines Market During the Forecast Period, By Volume
Figure 16 Asia Pacific is Projected to Dominate the Fatty Amines Market During the Forecast Period, By Volume
Figure 17 Fatty Amines Market, By Region
Figure 18 Drivers, Restraints, Opportunities, and Challenges of the Fatty Amines Market
Figure 19 Overview of Global Fatty Acid Capacity and Production (Million Tonnes), (2014-2022)
Figure 20 Fatty Amines Market: Porter’s Five Forces Analysis
Figure 21 Primary Amines Segment Projected to Dominate Fatty Amines Market During Forecast Period
Figure 22 Agrochemicals to Dominate the Fatty Amines Market Between 2019 and 2024
Figure 23 Asia Pacific to Be the Largest Market for Fatty Amines During the Forecast Period
Figure 24 Asia Pacific Fatty Amines Market Snapshot
Figure 25 North America: Market Snapshot
Figure 26 Europe Fatty Amines Market Snapshot
Figure 27 Companies Adopted Both Organic and Inorganic Growth Strategies Between 2016 and December 2019
Figure 28 Fatty Amines Market: Competitive Landscape Mapping, 2020
Figure 29 Arkema S.A.: Company Snapshot
Figure 30 Evonik Industries AG: Company Snapshot
Figure 31 Huntsman Corporation: Company Snapshot
Figure 32 India Glycols Limited: Company Snapshot
Figure 33 Indo Amines Limited: Company Snapshot
Figure 34 KAO Corporation: Company Snapshot
Figure 35 Lonza Group LTD: Company Snapshot
Figure 36 Nouryon: Company Snapshot
Figure 37 Procter & Gamble Co: Company Snapshot
Figure 38 Solvay SA: Company Snapshot
The study involved four major activities in estimating the current size of the fatty amines market. Exhaustive secondary research was done to collect information on the fatty amines market, its peer markets, and its parent market. The next step was to validate these findings, assumptions, and sizing with the industry experts across the fatty amines value chain through primary research. Both top-down and bottom-up approaches were employed to estimate the complete market size. Thereafter, market breakdown and data triangulation were used to estimate the market size of the segments and subsegments of the fatty amines market.
Secondary Research
As part of the secondary research process, various secondary sources such as Hoovers, Bloomberg, BusinessWeek, and Dun & Bradstreet have been referred to for identifying and collecting information for this study. These secondary sources included annual reports, press releases & investor presentations of companies, white papers, certified publications, articles by recognized authors, authenticated directories, and databases.
Secondary research was mainly conducted to obtain key information about the supply chain of the industry, the monetary chain of the market, total pool of players, and market classification and segmentation according to industry trends to the bottom-most level, regional markets, and key developments undertaken from both market- and technology-oriented perspectives.
Primary Research
The fatty amines market comprises several stakeholders, such as raw material suppliers, processors, end-product manufacturers, and regulatory organizations in the supply chain.
As part of the primary research process, various primary sources from both supply and demand sides were interviewed to obtain qualitative and quantitative information for this report on the fatty amines market. Primary sources from the supply side included industry experts such as Chief Executive Officers (CEOs), vice presidents, marketing directors, technology and innovation directors, and related key executives from various key companies and organizations operating in the fatty amines market. Primary sources from the demand side included directors, marketing heads, and purchase managers from various end-use industries. Following is the breakdown of the primary respondents.
To know about the assumptions considered for the study, download the pdf brochure
Market Size Estimation
Both top-down and bottom-up approaches were used to estimate and validate the total size of the fatty amines market. These methods were also used extensively to estimate the size of the various segments and subsegments of the market. The research methodology used to estimate the market size includes the following:
- The key players in the industry and markets were identified through extensive secondary research.
- The industry’s supply chain and market size, in terms of value and volume, have been determined through primary and secondary research processes.
- All percentage shares, splits, and breakdowns have been determined using secondary sources and verified through primary sources.
Data Triangulation
After arriving at the overall market size—using the market size estimation processes as explained above—the market was split into several segments and subsegments. In order to complete the overall market engineering process and arrive at the exact statistics of each market segment and subsegment, data triangulation and market breakdown procedures were employed, wherever applicable. The data was triangulated by studying various factors and trends from both, the demand and supply sides. In addition to this, the market size was validated using both top-down and bottom-up approaches.
Report Objectives
- To analyze and forecast the size of the global fatty amines market in terms of value and volume
- To define, segment, and estimate the global fatty amines market by type, end use, function, and region
- To project the size of the market segments in terms of volume and value with respect to five main regions; namely, Asia Pacific, North America, Europe, Middle East & Africa, and South America
- To provide detailed information regarding the crucial factors that influence the growth of the market (drivers, restraints, opportunities, and challenges)
- To analyze opportunities for stakeholders in the fatty amines market and provide a competitive landscape of the market
- To analyze competitive developments, such as new product launches, acquisitions, investments, expansions, partnerships, agreements, joint ventures, collaborations, contracts, and others in the fatty amines market
- To strategically profile key players and comprehensively analyze their market share and core competencies
Available Customizations
With the given market data, MarketsandMarkets offers customizations according to the company’s specific needs.
The following customization options are available for the report:
Regional Analysis
- Further breakdown of the North America, Europe, and Asia Pacific fatty amines market
Product Analysis
- Product matrix, which gives a detailed comparison of the product portfolios of competing companies
Company Information
- Detailed analysis and profiles of additional market players (up to five)


Growth opportunities and latent adjacency in Fatty Amines Market
Need report on Fatty Amines Market by Region