Asia-Pacific Air Quality Control Systems Market by Technology (Flue Gas Desulphurization(FGD), Electrostatic Precipitators, Fabric Filters, Nitrogen Oxide Control Systems, Scrubbers and Mercury Control Systems), by Application (Power Generation, Cement Manufacturing, Iron & Steel, Chemicals, Others), by Country - Trends and Forecasts till 2019


It is important to maintain air quality as the presence of toxic pollutants in air is harmful for health. These toxic pollutants also, include emissions from industries like power generation, cement manufacturing, chemical processing, and oil& gas refining among others. It is necessary to reduce these exhaust gases from industries. Air quality control systems are used to treat such gases and pollutants and help to release cleaner air.
In most of the developing economies in Asia such as India, Thailand, and Vietnam; exhaust gases and toxic particulate pollutants are released into the atmosphere directly, without proper treatment. However, this scenario is rapidly changing as increased environmental awareness is reflected in stringent industrial emission regulations and a dedicated approach on the part of industry to better environmental performance and meet customer expectations.
The Asia-Pacific air quality control systems (AQCS) market is segmented on the basis of the technology type and includes flue gas desulphurization (FGD), electrostatic precipitators (ESP), fabric Filters, Nitrogen Oxides (NOX) control systems, scrubbers, and mercury control systems. The market is further segmented on the basis of countries such as Australia & New Zealand, China, India, Indonesia, Japan, Malaysia, Philippines, South Korea, Thailand, and Vietnam. End use application for each technology is also analyzed in the report. The Asia-Pacific market is segmented as per applications such as power generation, cement manufacturing, iron & steel, and chemicals among others. Each segment has been analyzed with respect to its market and growth trends along with, future prospects. The data has been analyzed from 2012 to 2019, and all quantitative data regarding segmentation is mentioned in terms of value ($Million).
China expected to hold the maximum share of the AQCS market, in Asia-Pacific
The Asia-Pacific air quality control systems market is expected to cross $45.94 billion by 2019, growing at a CAGR of 6.7%, from 2014 to 2019. In terms of market size, China stood first followed by Japan, India, and South Korea in 2013. Increasing number of coal-fired power plants and cement manufacturing industries have increased the emission of exhaust gases and toxic pollutants, creating a huge demand for air quality control systems in major countries like China and India. Between 2014 and 2019, China is expected to witness the growth at a CAGR of 6.6%, to reach $35.55 billion by 2019, up from $22.65 billion in 2013.
Asia-Pacific Air Quality Control Systems: Market Share (Value), by Country, 2013
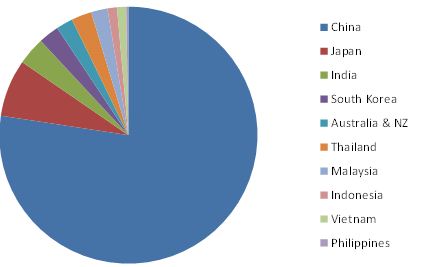
Source: Expert Interviews and MarketsandMarkets Analysis
The Asia-Pacific air quality control systems market is also analyzed with respect to Porter's Five Forces model. Different market forces such as suppliers� power, buyers� power, degree of competition, threat of substitutes, and threat of new entrants are analyzed with respect to the air quality control equipment industry. The report also provides a competitive landscape of major market players in Asia-Pacific that includes developments, mergers & acquisition, expansion and investments, agreements and contracts, new technologies developments, and others. A number of these developments are pertaining to the key industry players that suggest the growth strategy of these companies as well as of the overall industry.
The report also provides a comprehensive review of major market drivers, restraints, opportunities, challenges, winning imperatives, and key burning issues in the Asia-Pacific air quality control systems market. Key players in the industry are profiled in detail with their recent developments. Some of these include companies such as Alstom (France), Babcock & Wilcox Company (U.S.), Foster Wheeler (U.S.), Mitsubishi Hitachi Power Systems America (Japan), Hamon RC (U.S.), and Siemens Energy (Germany) among others.
Customer Interested in this report also can view
-
Air Quality Control Systems Market by Technology (Flue Gas Desulfurization (FGD), Electrostatic Precipitators, Nitrogen Oxide (NOx) Control Systems, Scrubber & Mercury Control Systems) & Geography - Global Trends and Forecasts to 2019
The Asia-Pacific air quality control systems market is expected to cross more than $40 billion by 2019, with a projected CAGR of 6.7%, signifying a high demand for air quality control systems in both developed and developing countries in Asia-Pacific.
The Asia-Pacific air quality control systems market is at various stages of development. The market opportunities for different type of technologies are diverse across Asia-Pacific regions. In emerging economies such as China and India, the market is tied to rapid industrialization and urbanization activities. Government and regulatory bodies in these regions are implementing stringent regulations to effectively, reduce the emission from these industries.
Power generation: Biggest market by Application
The Power generation industry market accounted for the largest share of the total Asia-Pacific air quality control systems market, in 2013. Coal is the largest source of energy for generation of electricity in Asia-Pacific. The large scale use of coal pollutes the environment with toxins creating global warming. Air quality control systems are capable of drastically reducing air pollution emissions from coal-fired power plants, in turn creating huge demand for these systems.
Asia-Pacifc Air Quality Control Systems: Market Share (Value), by Applications, 2013
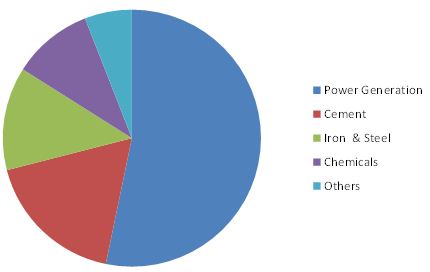
Source: MarketsandMarkets Analysis
The major air quality control systems companies in Asia-Pacific include Alstom (France), Babcock & Wilcox Company (U.S.), Foster Wheeler (U.S.), Mitsubishi Hitachi Power systems America (Japan), Hamon RC (U.S.), and Siemens Energy (Germany).
Innovative equipment and new product launch led companies to get more contracts
The leading companies in the air quality control systems market focus on the growth of their technologies and air quality equipment. Innovative technologies enable companies to gain contracts and agreements with the key objective of serving various industry sectors, by having a wide geographical presence. The top companies have been able to acquire a majority of contracts from the end user industries.
Table of Contents
1 Introduction (Page No.- 13)
1.1 Objectives of the Study
1.2 Study Scope
1.2.1 Market Definitions
1.2.2 Geographic Scope
1.2.3 Year
1.3 Markets Covered
1.4 Stakeholders
1.4.1 Assumptions
2 Research Methodology (Page No.- 18)
2.1 Market Size Estimation
2.1.1 Market Crackdown Based on Primary Interviews
2.2 Market Share Estimation
2.2.1 Key Data From Secondary Sources
2.2.2 Key From Primary Sources
2.2.2.1 Key Industry Insights
3 Executive Summary (Page No.- 22)
4 Premium Insights (Page No.- 24)
4.1 Asia-Pacific Dominates the Global AQCS Market
4.2 Asia-Pacific AQCS Market Overview
4.2.1 Fabric Filters Lead the Total Asia-Pacific AQCS Market
4.3 Particulate Control Systems Dominate the Asia-Pacific AQCS Market
4.4 China: the Growing Market in the Upcoming Years for AQCS
4.5 Stringent Emission Regulations in the Next Five Years Will Increase the Demand for AQCS in Asia-Pacific
4.6 India, Thailand and Vietnam to Be Emerging Markets for AQCS in Asia-Pacific
5 Market Overview (Page No.- 29)
5.1 Introduction
5.2 Process Chain Analysis
5.3 Market Dynamics
5.3.1 Drivers
5.3.1.1 Social Policies of Different Governments to Reduce Air Pollution
5.3.1.2 Stringent Air Pollution Control Regulations
5.3.1.3 Growth in Coal and Gas-Fired Power Plants
5.3.1.4 Growth in Cement Industry
5.3.2 Restraints
5.3.2.1 Emergence of Alternate and Renewable Sources of Energy
5.3.2.2 Unfavorable Economic Conditions
5.3.2.3 Increasing Attention in Asia Pacific Region on Gasoline Selective Desulphurization ( GSD) is Decelerating the Air Quality Control Systems Market
5.4 Opportunity
5.4.1 Increase in the Number of Coal-Fired Power Plants in China and India
5.4.1.1 Introduction of Mercury & Air Toxic Standards
5.5 Challenge
5.5.1 Increasing Events of Economic Downturn Can Be A Key Challenge for AQCS Market of Asia Pacific
5.6 Burning Issue
5.6.1 Commercial Deployment of Post-Combustion Carbon Capture Equipment
5.7 Winning Imperative
5.7.1 Manufacturing Cost-Effective & Innovative Equipment
6 Industry Trends (Page No.- 40)
6.1 Value Chain Analysis
6.1.1 AQCS Equipment Manufacturers
6.1.2 Service Providers
6.2 Porter�s Analysis
6.2.1 Threat of Substitutes
6.2.2 Threat of New Entrants
6.2.3 Bargaining Power of Buyers
6.2.4 Bargaining Power of Suppliers
6.2.5 Degree of Competition
7 Air Quality Control Systems Market, By Country (Page No.- 44)
7.1 Introduction
7.2 Global Air Quality Control Systems Market, By Geography
7.3 Asia-Pacific AQCS Market, By Country
7.4 Emission Control
7.4.1 India
7.4.2 China
7.4.3 Japan
7.4.4 Malaysia
7.4.5 Australia
7.4.6 Vietnam
7.4.7 Philippines
7.4.8 Indonesia
7.4.9 Thailand
7.4.10 New Zealand
7.4.11 South Korea
8 Air Quality Control Systems Market, By Application (Page No.- 64)
8.1 Introduction
8.1.1 Power Generation Industry
8.1.2 Cement Industry
8.1.3 Iron & Steel Industry
8.1.4 Chemical Industry
8.1.5 Other Industries
8.2 Asia-Pacific AQCS Marketsize, By Application, 2012-2019)
9 Asia-Pacific Air Quality Control Systems Market, By Technology (Page No.- 69)
9.1 Introduction
9.2 AQCS Market, By Technology
9.3 Asia-Pacific AQCS Market, By Technology
9.4 Flue Gas Desulphurization (FGD) Systems
9.4.1 Overview
9.4.2 FGD Systems, By Country
9.4.3 Asia-Pacific FGD Market, By Type
9.4.3.1 China FGD Market, By Type
9.4.3.2 Japan FGD Market, By Type
9.4.3.3 India FGD Market, By Type
9.4.3.4 South Korea FGD Market, By Type
9.4.3.5 Australia & New Zealand FGD Market, By Type
9.4.3.6 Malaysia FGD Market, By Type
9.4.3.7 Indonesia FGD Market, By Type
9.4.3.8 Vietnam FGD Market, By Type
9.4.3.9 Philippines FGD Market, By Type
9.4.4 FGD Systems, By Application
9.5 Electrostatic Precipitators (Esp)
9.5.1 Overview
9.5.2 Esp, By Type
9.5.3 Dry Esp
9.5.3.1 Overview
9.5.3.2 Dry Esp Systems, By Country
9.5.3.3 Dry Esp Systems, By Application
9.5.4 Wet Esp
9.5.4.1 Overview
9.5.4.2 Wet Esp Systems, By Country
9.5.4.3 Wet Esp Systems, By Application
9.6 Fabric Filters
9.6.1 Overview
9.6.2 Fabric Filters, By Country
9.6.3 Fabric Filters, By Application
9.7 Nitrogen Control Systems (NOX)
9.7.1 Overview
9.7.2 NOX Control Systems, By Country
9.7.3 NOX Control Systems, By Type
9.7.3.1 China NOX Control Systems, By Type
9.7.3.2 Japan NOX Control Systems, By Type
9.7.3.3 India NOX Control Systems, By Type
9.7.3.4 South Korea NOX Control Systems, By Type
9.7.3.5 Australia & New Zealand NOX Control Systems, By Type
9.7.3.6 Thailand NOX Control Systems, By Type
9.7.3.7 Malaysia NOX Control Systems, By Type
9.7.3.8 Indonesia NOX Control Systems, By Type
9.7.3.9 Vietnam NOX Control Systems, By Type
9.7.3.10 Philippines NOX Control Systems, By Type
9.7.4 NOX Control Systems, By Application
9.8 Scrubbers
9.8.1 Overview
9.8.2 Scrubbers, By Country
9.8.3 Scrubbers, By Application
9.9 Mercury Control Systems
9.9.1 Overview
9.9.2 Mercury Control Systems, By Country
9.9.3 Mercury Control Systems, By Application
10 Competitive Landscape (Page No.- 94)
10.1 Overview
10.2 Growth Strategies in the AQCS Market
10.2.1 New Contracts & Agreements Lead the Way
10.3 Competitive Situation & Trends
10.3.1 Market Share Analysis
10.3.2 Contracts & Agreements: 2010�2014
10.3.3 Mergers & Acquisitions: 2010 � 2014
10.3.4 New Product Launches: 2010-2014
10.4 Others: 2010-2014
11 Company Profiles (Page No.- 104)
11.1 Introduction
11.2 Mitsubishi Hitachi Power Systems, Ltd.
11.2.1 Business Overview
11.2.2 Products & Services
11.2.3 Key Strategy
11.2.4 Recent Developments
11.2.5 SWOT Analysis
11.2.6 MNM View
11.3 Thermax Ltd.
11.3.1 Business Overview
11.3.2 Products & Services
11.3.3 Key Strategy
11.3.4 Recent Developments
11.4 Hamon Corporation
11.4.1 Business Overview
11.4.2 Products & Services
11.4.3 Key Strategy
11.4.4 Recent Developments
11.5 Gea Bischoff
11.5.1 Business Overview
11.5.2 Products & Technologies
11.5.3 Key Strategy
11.5.4 Recent Developments
11.5.5 SWOT Analysis
11.5.6 MNM View
11.6 Foster Wheeler AG
11.6.1 Business Overview
11.6.2 Products & Services
11.6.3 Key Strategy
11.6.4 Recent Developments
11.6.5 SWOT Analysis
11.6.6 MNM View
11.7 Kc Cottrell Co Ltd.
11.7.1 Business Overview
11.7.2 Products & Services
11.7.3 Key Strategy
11.7.4 Recent Developments
11.8 Babcock & Wilcox Co.
11.8.1 Business Overview
11.8.2 Products & Services
11.8.3 Key Strategy
11.8.4 Recent Developments
11.8.5 SWOT Analysis
11.8.6 MNM View
11.9 Siemens AG
11.9.1 Business Overview
11.9.2 Products & Services
11.9.3 Key Strategy
11.9.4 Recent Developments
11.9.5 SWOT Analysis
11.9.6 MNM View
11.10 Alstom SA
11.10.1 Business Overview
11.10.2 Products & Services
11.10.3 Key Strategy
11.10.4 Recent Developments
11.10.5 SWOT Analysis
11.10.6 MNM View
11.11 Ducon Technologies Inc.
11.11.1 Business Overview
11.11.2 Products & Services
11.11.3 Key Strategy
11.11.4 Recent Developments
11.12 Fujian Longking Co.,Ltd.
11.12.1 Business Overview
11.12.2 Products & Services
11.12.3 Key Strategy
11.12.4 Recent Developments
12 Appendix (Page No.- 138)
12.1 Discussion Guide
12.2 Introducing RT: Real Time Market Intelligence
12.3 Available Customizations
12.4 Related Reports
List of Tables (77 Tables)
Table 1 Harmful Effects of Compounds
Table 2 Impact of Major Drivers of Air Quality Control System and Services Market
Table 3 Countries That Have Or Are Developing Air Quality Standards
Table 4 Impact of Restraints on the Industrial Flue Gas Treatment Systems & Services Market
Table 5 AQCS Market Size, By Region, 2012-2019 ($Million)
Table 6 Asia-Pacific: AQCS Market Size By Country, 2012-2019 ($Million)
Table 7 Coal-Fired Power Plants: Particulate Emission Limit
Table 8 Boilers Using Agricultural Waste: Particulate Emission Limit
Table 9 Thermal Power Plants: Sox Emission Limit
Table 10 Cement Plants: Particulate Emission Limit
Table 11 Iron and Steel Plants: Particulate Matter Emission Limits
Table 12 Sulphuric Acid Plants: Emission Limits
Table 13 Sulphuric Acid Plants, By Steam Generation Capacity: Emission Limits
Table 14 Petroleum Oil Refinery: Emission Limits
Table 15 Fcc Regenerators: Emission Limits
Table 16 Sulphuric Acid Plants: Emission Limits
Table 17 Nitric Acid Plants: Emission Limits
Table 18 Thermal Power Plants: Emission Limits
Table 19 Iron and Steel Industry: Emission Limits
Table 20 Cement Industry: Emission Limits
Table 21 Toxic Substances: Emission Limits
Table 22 Specific Substances Emission Facilities & Designated Substances Control Standard Relating to Dioxins
Table 23 The Following Table Shows the Existing Enterprise Concentration Limit Emission of Air Pollution for Sintering Machines in Iron and Steel Industry.Iron and Steel Industry: Emission Limits
Table 24 Thermal Industry: Emission Limits
Table 25 Iron and Steel Industry: Emission Limits
Table 26 Oil and Gas Industry: Emission Limits
Table 27 Non-Metallic (Mineral) Industry (All Sizes): Emission Limits
Table 28 Thermal Industry: Emission Limits
Table 29 Thermal Industry: Emission Limits
Table 30 Industrial Processes: Emission Limits
Table 31 Oil and Gas Industry: Emission Limits
Table 32 Oil and Gas Industry: Emission Limits
Table 33 Thermal Industry: Emission Limits
Table 34 Air Quality Standards : Emission Limits
Table 35 Thermal Industry : Emission Limits
Table 36 Pollutants Generating Stages in The Cement Industry
Table 37 Asia-Pacific Air Quality Control Systems Market Size,By Application, 2012-2019 ($Million)
Table 38 AQCS Market Size, By Technology, 2012- 2019 ($Million)
Table 39 Asia Pacific: AQCS Market Size By Technology, 2012-2019 ($Million)
Table 40 Asia-Pacific: FGD Systems, Market Size, By Country, 2012-2019 ($Million)
Table 41 FGD Systems: Wet Vs Dry
Table 42 Asia-Pacific: FGD Systems Market Size, By Type, 2012-2019 ($Million)
Table 43 China: FGD Systems Market Size, By Type, 2012-2019 ($Million)
Table 44 Japan: FGD Systems Market Size, By Type, 2012-2019 ($Million)
Table 45 India: FGD Systems Market Size, By Type, 2012-2019 ($Million)
Table 46 South Korea: FGD Systems Market Size , By Type, 2012-2019 ($Million)
Table 47 Australia & New Zealand: FGD Systems Market Size , By Type, 2012-2019 ($Million)
Table 48 Thailand: FGD Systems Market Size, By Type, 2012-2019 ($Million)
Table 49 Malasia: FGD Systems Market Size, By Type, 2012-2019 ($Million)
Table 50 Indonesia: FGD Systems Market Size, By Type, 2012-2019 ($Million)
Table 51 Vietnam: FGD Systems Market Size , By Type, 2012-2019 ($Million)
Table 52 Philippines: FGD Systems Market Size, By Type, 2012-2019 ($Million)
Table 53 Asia-Pacific: FGD Systems Market Size, By Application, 2012-2019 ($Million)
Table 54 Asia-Pacific: Esp Market Size , By Type, 2012-2019 ($Million)
Table 55 Asia-Pacific: Dry Esp Market Size, By Country, 2012-2019 ($Million)
Table 56 Asia-Pacific: Dry Esp Market Size, By Application, 2012-2019 ($Million)
Table 57 Asia-Pacific: Wet Esp Market Size , By Country, 2012-2019 ($Million)
Table 58 Asia-Pacific: Wet Esp Market Size , By Application, 2012-2019 ($Million)
Table 59 Asia-Pacific: Fabric Filters Market Size, By Country, 2012-2019 ($Million)
Table 60 Asia-Pacific: Fabric Filters Market Size, By Application, 2012-2019 ($Million)
Table 61 Asia-Pacific: NOX Control Systems Market Size, By Country, 2012-2019 ($Million)
Table 62 Asia-Pacific: NOX Control Systems Market Size, By Type, 2012-2019 ($Million)
Table 63 China: NOX Control Systems, Market Size, By Type, 2012-2019 ($Million)
Table 64 Japan: NOX Control Systems Market Size, By Type, 2012-2019 ($Million)
Table 65 India: NOX Control Systems Market Size, By Type, 2012-2019 ($Million)
Table 66 South Korea: NOX Control Systems Market Size, By Type, 2012-2019 ($Million)
Table 67 Australia & New Zealand: NOX Control Systems Market Size, By Type, 2012-2019 ($Million)
Table 68 Thailand: NOX Control Systems Market Size, By Type, 2012-2019 ($Million)
Table 69 Malaysia: NOX Control Systems Market Size, By Type, 2012-2019 ($Million)
Table 70 Indonesia: NOX Control Systems Market Size, By Type, 2012-2019 ($Million)
Table 71 Vietnam: NOX Control Systems Market Size By Type, 2012-2019 ($Million)
Table 72 Philippines: NOX Control Systems Market Size, By Type, 2012-2019 ($Million)
Table 73 Asia-Pacific: NOX Control Systems Market Size, By Application, 2012-2019 ($Million)
Table 74 Asia-Pacific: Scrubbers Market Size, By Country, 2012-2019 ($Million)
Table 75 Asia-Pacific: Scrubbers Market Size, By Application, 2012-2019 ($Million)
Table 76 Asia-Pacific: Mercury Control Systems Market Size, By Country, 2012-2019 ($Million)
Table 77 Asia-Pacific: Mercury Control Systems Market Size, By Application, 2012-2019 ($Million)
List of Figures (37 Figures)
Figure 1 Air Quality Control Systems Technologies Covered in the Report
Figure 2 Asia-Pacific Air Quality Control Systems Market: Research Methodology
Figure 3 Market Size Estimation Methodology: Bottom-Up Approach
Figure 4 Market Size Estimation Methodology: Top-Down Approach
Figure 5 Market Crackdown Based on Primary Interviews: By Company Type, Designation, & Region
Figure 6 Asia-Pacific AQCS Market (Share), By Technology, 2013 ($Million)
Figure 7 Global AQCS: Market Share (Value) Comparison, 2014 & 2019
Figure 8 Asia Pacific AQCS Market Overview, 2013
Figure 9 APAC AQCS: Market Share (Value) Comparison, 2014 & 2019
Figure 10 China: China AQCS Market ($Million), 2014-2019
Figure 11 Global AQCS Scenario: Technology Overview, 2013
Figure 12 Asia-Pacific Air Quality Control Systems Market Country Share Analysis, 2013
Figure 13 Asia-Pacific AQCS Market Segmentation
Figure 14 Process Chain of Industrial Flue Gas Treatment Systems & Services
Figure 15 Market Dynamics for Asia-Pacific AQCS Market
Figure 16 Fuel Used for Energy Purposes Globally: 2013 Vs 2035
Figure 17 Annual Cement Production (Volume), By Country, 2011-2019 (Mt)
Figure 18 Global Power Generation forecasts (Volume): 2011-2040
Figure 19 AQCS Value Chain Analysis
Figure 20 Porter�s Five forces Analysis
Figure 21 Asia-Pacific Air Quality Control Systems, By Country Cagr Overview, Between 2014-2019
Figure 22 Asia-Pacific Leads the Global AQCS Market, in 2013
Figure 23 Chinese AQCS Market Holds A Lion Share Comapred to Other Asia-Pacific Countries
Figure 24 Asia-Pacific AQCS Market, By Country Market Share(Value), 2013
Figure 25 Power Generation Industry Leads the AQCS Market in Asia-Pacificasia-Pacific AQCS, By Application Overview
Figure 26 Asia-Pacific Market Size, By Application, in 2013
Figure 27 Asia-Pacific: AQCS Market Size, By Technology, 2013 ($Million)
Figure 28 Asia-Pacific: FGD Systems Market Share (Value), By Type, 2013
Figure 29 Asia-Pacific: FGD Systems Market Share (Value), By Application, 2013
Figure 30 Cement Industry Lead the Asia-Pacific Fabric Filters Market By Application, 2013
Figure 31 Coal-Fired Power Generation is the Leading Industry to Use NOX Control Systems
Figure 32 Asia-Pacific:Scrubbers Market Share (Value), By Application, 2013
Figure 33 Power Generation Industry Uses Most of the Mercury Control Systems in Asia-Pacific
Figure 34 Companies Adopted Contract & Agreement As the Key Growth Strategy
Figure 35 AQCS Market Share (Volume), By Growth Strategy, 2010-2014
Figure 36 AQCS Market Share Analysis of Top Companies, By Development, 2010-2014 96
Figure 37 Battle for Market Share: New Product Launches Leading to New Contracts & Agreements


Growth opportunities and latent adjacency in Asia-Pacific Air Quality Control Systems Market