Asia-Pacific Nuclear Medicine/Radiopharmaceuticals & Stable Isotopes Market [SPECT/PET Radioisotopes (Technetium, F-18)], [Beta/Alpha Radiation Therapy (I131, Y-90)], [Applications (Cancer/Oncology, Cardiac)] & (Deuterium, C-13) � Forecast to 2017


The radiopharmaceuticals market in the Asia-Pacific region was valued at $500.8 million in 2012; it is poised to reach $824.9million in 2017 at a CAGR of 10.5%.
The market is broadly classified into two segments, namely, diagnostic and therapeutic; the former dominated with about 80.7% share in 2012. Radioisotopes in the diagnostic market are categorized as SPECT and PET. Technetium 99m (Tc-99m) dominated the SPECT radioisotope market in 2012, followed by thallium�201(Tl-201), gallium�67 (Ga-67), and iodine-123 (I-123). SPECT is majorly used in cardiology-related diagnosis; it is poised to grow at a CAGR of 10.2% from 2012 to 2017. The PET radioisotopes market is dominated by fluoride-18 (F-18), followed by rubidium-82 (Rb-82).
Segments in the therapeutic market are beta emitters, brachytherapy isotopes, and alpha emitters. Quantitative information about alpha emitters has not been arrived at, as they have not been commercialized; recent clinical studies have, however, showcased immense potential of alpha isotopes in therapies. Beta emitters contribute the highest to the therapy market, dominated by iodine�131(I-131), which is poised to grow at a CAGR of 7.7% from 2012 to 2017. The Asia-Pacific market is driven by its applications for thyroid cancer, hyperthyroidism, and non-Hodgkin�s lymphoma. Significant isotopes in the brachytherapy market are cesium-131(Cs-131), iodine-125 (I-125), palladium-103 (Pd-103), and iridium-192 (Ir-192).
Radiopharmaceuticals in neurological applications such as Alzheimer�s disease, Parkinson�s disease, and dementia are boosting the growth of the Asia-Pacific nuclear medicine market. Upcoming radioisotopes such as Ra-223 (Alpharadin) and Ga-68 possess huge potential for clinical applications. The nuclear disaster at Fukushima nuclear plants in 2011 had a major impact on radioisotope production in Japan, which is the largest consumer market in the Asia-Pacific region. The Asia-Pacific region is insulated from the global crisis in Mo-99 supply since the production is based on local nuclear plants and OPAL reactor of ANSTO. ANSTO is deemed as the future solution to compensate global Mo-99 demand.
Major players in the radiopharmaceuticals market are Nihon Medi-Physics Co., Ltd. (Japan), Covidien PLC (U.S.), Fujifilm Corporation (Japan), ANSTO (Australia), and IBA S.A (Belgium).
The Asia-Pacific stable isotopes market is dominated by deuterium (D2), oxygen-18 (O-18), carbon-13 (C-13), and nitrogen-15 (N-15). Research, pharmaceuticals, diagnostic and therapy, and industries are major applications. The Asia-Pacific stable isotopes market was estimated at $56.1 million in 2012 and is expected to cross $100.0 million by 2017 at a CAGR of 12.6%.
The stable isotopes market was led by two players - Cambridge Isotope Laboratories (CIL) (U.S.) and Sigma Aldrich (U.S.) in 2012.
Get online access to the report on the World's First Market Intelligence Cloud
Request Sample Scope of the Report

The radioisotope and stable isotope markets have been segmented according to the type of isotope, and applications. Both these markets are broken down into segments and sub-segments, providing exhaustive value analysis for the years 2010, 2011, 2012, and forecast to 2017. Each market is comprehensively analyzed at a granular level by country (Japan, China, India, South Korea, Malaysia, Indonesia, Australia, New Zealand, and Rest of Asia) to provide in-depth information on the Asia-Pacific scenario.
Asia-Pacific Radiopharmaceuticals Market
- Diagnostic
- SPECT
- Tc-99m
- Tl-201
- Ga-67
- I-123
- Others
- PET
- F-18
- Rb-82
- Others
- SPECT
- Therapy
- Beta emitters
- I-131
- Sm-153
- Re-186
- Y-90
- Lu-177
- Others
- Alpha emitters
- Brachytherapy
- Cs-131
- I-125
- Pd-103
- Ir-192
- Others
Asia-Pacific Enriched Stable Isotopes Market
- Beta emitters
- Deuterium
- Oxygen-18
- Carbon-13
- Nitrogen-15
- Others
Radiopharmaceutical and Stable Isotope Markets, By Country
- Japan
- China
- India
- South Korea
- Malaysia
- Indonesia
- Australia
- New Zealand
- Rest of Asia
Customer Interested in this report also can view
-
Nuclear Medicine/Radiopharmaceuticals Market [SPECT/PET Radioisotopes (Technetium, F-18)], [Beta/Alpha radiation therapy (I131, Y-90)], [Applications (Cancer/Oncology, Cardiac)] & Stable Isotopes (Deuterium, C-13) - Global Trends & Forecast to 2017
-
European Nuclear Medicine/Radiopharmaceuticals Market [SPECT/PET Radioisotopes (Technetium, F-18)], [Beta/Alpha radiation therapy (I131, Y-90)], [Applications (Cancer/Oncology, Cardiac)] & Stable Isotopes (Deuterium, C-13) - Global Trends & Forecast to 2017
-
North American Nuclear Medicine/Radiopharmaceuticals Market [SPECT/PET Radioisotopes (Technetium, F-18)], [Beta/Alpha radiation therapy (I131, Y-90)], [Applications (Cancer/Oncology, Cardiac)] & Stable Isotopes (Deuterium, C-13) - Global Trends & Forecast to 2017
Radiopharmaceuticals are drugs that contain radionuclide-emitting ionizing radiation and are used for disease diagnosis and treatment. They provide better understanding of the diseases, as they provide anatomical as well as functional information about organs. Radiopharmaceuticals are also used in the nuclear imaging field as tracers. They are mostly used for diagnosis with the use of gamma cameras for imaging techniques such as in SPECT and PET. The medical application of radioisotopes is being driven by the increasing patient population and new and effective radioisotopes.The most commonly used isotopes for diagnosis are Tc-99m and Tl-201 for SPECT and F-18 for PET.
The radiopharmaceuticals market is broadly classified into two segments, namely, diagnostic and therapeutic; the former dominated with about 80% share in 2012. Radioisotopes in the diagnostic market are categorized as SPECT and PET. Technetium 99m (Tc-99m) dominated the SPECT radioisotope market in 2012, followed by thallium�201(Tl-201), gallium�67 (Ga-67) and iodine-123 (I-123). SPECT is majorly used in the diagnosis of cardiac diseases; it is poised to grow at a CAGR of about 10.2% from 2012 to 2017. The PET radioisotopes market is majorly dominated by fluorine-18 (F-18).
Segments in the therapeutic market are beta emitters, brachytherapy isotopes, and alpha emitters. Quantitative information about alpha emitters has not been arrived at, as they have not been commercialized; recent clinical studies have, however, showcased immense potential of alpha isotopes in therapies. Beta emitters contribute the highest to the therapy market, dominated by iodine�131(I-131), which is poised to grow at a CAGR of 7.7% from 2012 to 2017. The market is driven by its applications for thyroid cancer, hyperthyroidism, and non-Hodgkin�s lymphoma. Significant isotopes in the brachytherapy market are cesium-131(Cs-131), iodine-125 (I-125), palladium-103 (Pd-103), and iridium-192 (Ir-192). Japan is the major market for brachytherapy in terms of market share, followed by China.
The therapy market is predominantly driven by its oncologic applications. Since conventional treatment procedures of cancer, surgery and chemotherapy have significant side-effects, radioisotopes are being preferred by medical practitioners due to minimum or no side-effects. The radiopharmaceutical therapy market is expected to grow significantly with the launch of the much-desired Alpharadin (Ra-223) in the near future. This isotope has tremendous potential to take up the market share of beta emitters and brachytherapy.
Japan accounted for the largest market share of the Asia-Pacific nuclear medicine market, followed by China in 2012. Major players in the radiopharmaceuticals market are ANSTO (Australia), Nihon Medi Physics Co., Ltd. (Japan), Fujifilm Corporation (Japan), Covidien, PLC(Ireland), GE Healthcare (U.K.), IBA Group (Belgium), Lantheus Medical Imaging, Inc. (U.S.), and Siemens Healthcare (PETNET Solution Australia); Nihon Medi Physics dominated the market with around half the share in 2012.
The stable isotopes market is dominated by carbon-13 (C-13),deuterium (D2), oxygen-18 (O-18), and nitrogen-15 (N-15). It has major applications in research, pharmaceuticals, diagnostic and therapy, and the industrial sector. The diagnostic and therapy market accounted for the largest share of the stable isotopes market. The Asia-Pacific stable isotopes market was valued at $56.1million in 2012; it is estimated to grow at a CAGR of 12.6% by 2017. The stable isotopes market was led by two players - Cambridge Isotope Laboratories (CIL) and Sigma Aldrich - in 2012; they jointly contributed more than 80% to the Asia-Pacific revenue.
Radiopharmaceuticals Market Share Analysis, By Key Player (2012)
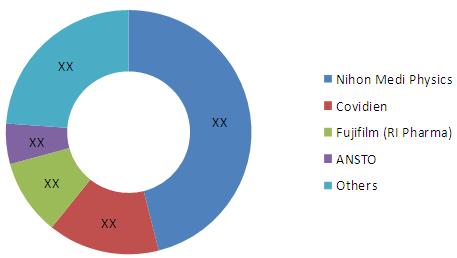
Table Of Contents
1 Introduction (Page No. - 27)
1.1 Key Take-Aways
1.2 Report Description
1.3 Markets Covered
1.4 Stakeholders
1.5 Research Methodology
1.5.1 Market Size
1.5.2 Market Share
1.5.3 Key Data Points From Secondary Sources
1.5.4 Key Data Points From Primary Sources
1.5.5 Assumptions
2 Executive Summary (Page No. - 35)
3 Market Overview (Page No. - 40)
3.1 Introduction
3.2 Definition Of Radiopharmaceuticals
3.3 Market Segmentation
3.3.1 Radiopharmaceuticals
3.3.2 Stable Isotopes
3.4 Market Dynamics
3.4.1 Drivers
3.4.1.1 Increasing Incidence Of Cancer And Cardiac Ailments Boosts The Demand
For Radiopharmaceuticals
3.4.1.2 Increasing Use Of Spect And Pet Scans Results In Rise Of Radiopharmaceutical Usage
3.4.1.3 Rising Awareness Of Radiopharmaceuticals To Spur Growth
3.4.1.4 Ready Availability Of Radiopharmaceuticals From Cyclotrons To Goad The Growth
3.4.2 Restraints
3.4.2.1 Shorter Half-Life Of Radiopharmaceuticals Restricts The Usage
3.4.2.2 High Capital To Limit The Buying Of Scanners
3.4.2.3 Competition From Conventional Diagnostic Procedures
3.4.3 Opportunities
3.4.3.1 Potential Radioisotopes In The Pipeline
3.4.3.2 Alpha Radioimmunotherapy-Based Targeted Cancer Treatment
3.4.3.3 Cyclotron-Based Production
3.4.3.4 Neurological Applications
3.4.4 Threat
3.4.4.1 Japanese Reactors Inefficient To Compensate The Domestic Nuclear Demand
3.5 Winning Imperatives
3.5.1 Investments On New Radioisotopes And Novel Applications
3.5.2 Shift Towards Leu-Based Mo-99 Production
3.6 Burning Issues
3.6.1 High Cost Of Pet Cameras
3.6.2 Fukushima Nuclear Disaster
3.7 Opal - A Sustainable Solution For Global Crisis In Mo-99 Supply
3.8 Regulatory Affairs
3.8.1 Japan
3.8.1.1 The Pharmaceuticals And Medical Devices Agency (PMDA, Sogo-Kiko)
3.8.2 China
3.8.2.1 China Food And Drug Administration (CFDA) & Office Of Administrative Protection
For Pharmaceuticals(OOAP)
3.8.3 India
3.8.3.1 Board Of Radiation & Isotope Technology (BRIT)
3.8.4 South Korea
3.8.4.1 Korea Institute Of Nuclear Safety (KINS) And Korea Institute Of Nuclear Nonproliferation
And Control(KINAC)
3.8.5 Malaysia
3.8.5.1 Atomic Energy Licensing Board (AELB)
3.8.6 Indonesia
3.8.6.1 Nuclear Energy Regulatory Agency (BAPETEN)
3.8.7 Australia & New Zealand
3.8.7.1 The Australian And New Zealand Society Of Nuclear Medicine (ANZSNM)
3.8.8 Roa
3.8.8.1 Dost (Philippines) & Crpns (Singapore)
3.9 Market Share Analysis
3.9.1 Radiopharmaceuticals Market
3.9.2 Enriched Stable Isotope Market
4 Asia-Pacific Radiopharmaceuticals Market, By Isotope (Page No. - 61)
4.1 Introduction
4.2 Diagnostic Market
4.2.1 Opportunity Matrix
4.2.2 Single-Photon Emission Computed Tomography (SPECT) Radiopharmaceuticals
4.2.2.1 Technetium-99m (Tc-99m)
4.2.2.1.1 Tc-99m To Decide Growth Trend Of Spect Radioisotopes
4.2.2.1.2 Factors Affecting Technetium-99m Market
4.2.2.1.2.1 Technetium Can Combine With 31 Different Carrier Molecules
4.2.2.1.2.2 Sustainable Supply Of Technetium
4.2.2.2 Thallium-201 (TL-201)
4.2.2.2.1 Tl-201 Is A Potential Substitute For Tc-99m
4.2.2.3 Gallium-67 (GA-67)
4.2.2.3.1 Fluorine-18 (PET) Might Seize Ga-67 (SPECT) Market Share In The Near Future
4.2.2.4 Iodine (I-123)
4.2.2.5 Others
4.2.3 Positron-Emission Tomography (PET) Radiopharmaceuticals
4.2.3.1 Fluorine-18
4.2.3.1.1 Fdg
4.2.3.1.2 Florbetapir
4.2.3.1.3 Factors Affecting Fluorine-18 Market
4.2.3.1.3.1 Rise In Pet Procedures Increases Demand For Fdg
4.2.3.1.3.2 High Generation Costs Of Fdg
4.2.3.1.3.3 Need For Speedy & Efficient Transportation
4.2.3.2 Rubidium-82 (RB-82)
4.2.3.3 Others
4.3 Therapeutic Isotopes
4.3.1 Opportunity Matrix
4.3.2 Beta Emitters
4.3.2.1 Iodine-131 (I-131)
4.3.2.2 Yttrium-90 (Y-90)
4.3.2.2.1 Y-90 Market Influenced By Popularity Of Nordion�s Therasphere
4.3.2.3 Samarium-153 (Sm-153)
4.3.2.4 Rhenium-186 (Re-186)
4.3.2.5 Lutetium-177 (LU-177)
4.3.2.5.1 LU-177 Is A Potential Treatment Option For Neuroendocrine Cancer
4.3.2.6 Others
4.3.2.6.1 RE-188 And P-33 Are Notable Promising Isotope
4.3.3 Alpha Emitters
4.3.3.1 Radium-223 (RA-223) & Alpharadin
4.3.3.1.1 Successful Completion Of Phase Iii Trials In Men With Bone
Metastases From CRPC
4.3.3.1.2 First In-Class Alpha Pharmaceutical
4.3.3.1.3 Alpharadin Is Advantageous Over Taxotere, Beta-Therapy And Brachytherapy
4.3.3.1.4 Success Of Alpharadin
4.3.3.1.5 Porter�s Five Forces Analysis
4.3.3.1.6 Swot Analysis
4.3.3.2 Actinium-225 (AC-225)
4.3.3.3 Lead-212 (PB-212)/Bismuth-212 (BI-212)
4.3.3.4 Astatine-211 (AT-211)
4.3.3.5 Radium-224 (RA-224)
4.3.3.6 Thorium-227 (TH-227)
4.3.4 Brachytherapy
4.3.4.1 Cesium-131
4.3.4.2 Iodine-125
4.3.4.3 Palladium-103
4.3.4.4 Iridium-192
4.3.4.5 Others
5 Asia-Pacific Radiopharmaceuticals Market, By Application/Indication (Page No. - 117)
5.1 Introduction
5.2 Diagnostic Application
5.2.1 Spect
5.2.1.1 Cardiology
5.2.1.2 Lymphoma
5.2.1.3 Thyroid
5.2.1.4 Neurology
5.2.1.4.1 Alzheimer�s, Dementia, And Parkinson�s Disease Driving Growth Of The
Neurology Spect Market
5.2.1.5 Others
5.2.2 Pet
5.2.2.1 Oncology
5.2.2.1.1 Fdg F-18 Has Become A Gold Standard For Oncology Diagnosis Using Pet Scan
5.2.2.2 Cardiology
5.2.2.3 Neurology
5.2.2.4 Others
5.3 Therapeutic Application
5.3.1 Thyroid
5.3.2 Bone Metastasis
5.3.3 Lymphoma
5.3.4 Endocrine Tumors
5.3.5 Others
6 Asia-Pacific Enriched Stable Isotopes Market (Page No. - 145)
6.1 Introduction
6.2 Market Overview
6.3 Market Dynamics
6.3.1 Drivers
6.3.1.1 Stable Isotopes Are Natural In Origin & Hence Safe
6.3.1.2 Proteomics & System Biology, Major Factors To Boost The Growth Of Stables
6.3.1.3 Medical Applications Propel Stable Isotopes Market Growth
6.3.2 Restraints
6.3.2.1 Harmful Effects Of High Doses Of Stable Isotopes Affect Market Growth
6.3.2.2 High Cost Of Stables Isotope
6.4 Enriched Stables Market, By Isotope
6.4.1 Deuterium & O-18 Are Promising Isotopes
6.4.2 Carbon-13
6.4.3 Deuterium
6.4.4 Oxygen-18
6.4.5 Nitrogen-15
6.4.6 Other Stable Isotopes
6.5 Enriched Stables Market, By Application
6.5.1 Diagnostic & Therapy
6.5.2 Research
6.5.3 Pharmaceutical
6.5.4 Industrial Sector
7 Geographic Analysis (Page No. - 165)
7.1 Introduction
7.1.1 Apac Showcases Great Scope For Market Development
7.2 Japan
7.2.1 Pet Diagnosis Increased Dramatically After 2002
7.2.2 Japanese Nuclear Market Affected By Fukushima Catastrophe In 2011
7.3 China
7.3.1 Alternative Procedures Hinder Nuclear Medicine Market
7.4 India
7.4.1 Tc-99m And F-18 Fdg, The Most Prominent Radiopharmaceuticals
7.5 South Korea
7.5.1 Nuclear Medicines Market Gained Momentum After Mid-1990s
7.6 Malaysia
7.6.1 Nuclear Medicines Market Showcased A Significant Development During The Post 1970�s Era
7.6.2 Patients Migrating To Neighboring Countries For Nuclear Medicine Services
7.7 Indonesia
7.7.1 Lack Of Skilled Professionals Affects Indonesian Nuclear Medicines Market
7.8 Australia
7.8.1 The Opal Reactor Has The Capacity To Produce Almost Half The Global Tc-99m Demand
7.8.2 Uninterrupted Mo-99 Production By Opal To Boost Tc-99m Usage
7.9 New Zealand
7.9.1 Alternative Procedures Affect Nuclear Medicines Market
7.10 Rest Of Asia (Roa)
8 Competitive Landscape (Page No. - 222)
8.1 Introduction
8.2 Agreements, Partnerships, Collaborations & Joint Ventures
8.3 Products Launch
8.4 Expansions
8.5 Mergers & Acquisitions
8.6 Other Developments
9 Company Profiles (Page No. - 232)
(Overview, Financials, Products & Services, Strategy, & Developments)*
9.1 Bracco Imaging S.P.A.
9.2 Cambridge Isotope Laboratories, Inc.
9.3 Cardinal Health, Inc.
9.4 Covidien, Plc
9.5 Eczacibasi-Monrol
9.6 Fujifilm Holdings Corporation
9.7 Ge Healthcare (Subsidiary Of General Electric Company)
9.8 Iba Group
9.9 Isotec, Inc. (Sigma-Aldrich)
9.10 Lantheus Medical Imaging, Inc.
9.11 Nordion, Inc.
9.12 Ntp Radioisotopes (Pty), Ltd.
9.13 Siemens Healthcare (Subsidiary Of Siemens AG)
9.14 Taiyo Nippon Sanso Corporation
9.15 Urenco Limited
9.16 Rotem Industries, Ltd., Inc.
9.17 Australian Nuclear Association And Technology Organization (ANSTO)
9.18 Board Of Radiation And Isotope Technology (BRIT)
9.19 Institute Of Atomic Energy Polatom Radioisotope Centre
9.20 Institute Of Isotopes Co., Ltd.
9.21 Institute Of Radioelement (IRE)
List Of Tables (146 Tables)
Table 1 Asia-Pacific: Radiopharmaceutical Diagnostic Market,By Technology, 2010 � 2017 ($Million)
Table 2 Asia-Pacific: Radiopharmaceutical Diagnostic Market, By Technology, 2010 � 2017 ($Million)
Table 3 Asia-Pacific: Spect Radiopharmaceuticals Market, By Isotope, 2010 � 2017 ($Million)
Table 4 Asia-Pacific: Spect Radiopharmaceuticals Market, By Country, 2010 � 2017 ($Million)
Table 5 Indications Diagnosed By Tc-99m
Table 6 Asia-Pacific: Tc-99m Market, By Country, 2010 � 2017 ($Million)
Table 7 Asia-Pacific: Tl-201 Market, By Country, 2010 � 2017 ($Million)
Table 8 Asia-Pacific: Ga-67 Market, By Country, 2010 � 2017 ($Million)
Table 9 Asia-Pacific: I-123 Market, By Country, 2010 � 2017 ($Million)
Table 10 Asia-Pacific: Other Radiopharmaceuticals Market, By Country, 2010 � 2017 ($Million)
Table 11 Asia-Pacific: Pet Radiopharmaceuticals Market, By Isotope, 2010 � 2017 ($Million)
Table 12 Asia-Pacific: Pet Radiopharmaceuticals Market, By Country, 2010 � 2017 ($Million)
Table 13 Asia-Pacific: F-18 Market, By Country, 2010 � 2017 ($Million)
Table 14 Asia-Pacific: Rb-82 Market, By Country, 2010 � 2017 ($Million)
Table 15 Asia-Pacific: Other Pet Radiopharmaceuticals Market, By Country, 2010 � 2017 ($Million)
Table 16 Asia-Pacific: Radiopharmaceutical Market, By Therapy, 2010 � 2017 ($Million) 86
Table 17 Asia-Pacific: Beta Emitter Radiopharmaceuticals Market, By Isotope, 2010 � 2017 ($Million)
Table 18 Asia-Pacific: Beta Emitter Radiopharmaceuticals Market, By Country, 2010 � 2017 ($Million)
Table 19 Asia-Pacific: I-131 Market, By Country, 2010 � 2017 ($Million)
Table 20 Asia-Pacific: Y-90 Market, By Country, 2010 � 2017 ($Million)
Table 21 Asia-Pacific: Sm-153 Market, By Country, 2010 � 2017 ($Million)
Table 22 Asia-Pacific: Re-186 Market, By Country, 2010 � 2017 ($Million)
Table 23 Asia-Pacific: Lu-177 Market, By Country, 2010 � 2017 ($Million)
Table 24 Asia-Pacific: Other Beta Emitters Market, By Country, 2010 � 2017 ($Million)
Table 25 Alpha Emitters Vs Beta Emitters
Table 26 Radiopharmaceuticals Characteristics & Dose Delivery Over Time
Table 27 Asia-Pacific: Brachytherapy Market, By Isotope, 2010 � 2017 ($Million)
Table 28 Asia-Pacific: Brachytherapy Market, By Country, 2010 � 2017 ($Million)
Table 29 Asia-Pacific: Cs-131 Market, By Country, 2010 � 2017 ($Million)
Table 30 Asia-Pacific: I-125 Market, By Country, 2010 � 2017 ($Million)
Table 31 Asia-Pacific: Pd-103 Market, By Country, 2010 � 2017 ($Million)
Table 32 Asia-Pacific: Ir-192 Market, By Country, 2010 � 2017 ($Million)
Table 33 Asia-Pacific: Other Brachytherapy Market, By Country, 2010 � 2017 ($Million)
Table 34 Asia-Pacific: Spect Application Market, 2010 � 2017 ($Million)
Table 35 Asia-Pacific: Cardiology Spect Market, By Country, 2010 � 2017 ($Million)
Table 36 Asia-Pacific: Lymphoma Spect Market, By Country, 2010 � 2017 ($Million)
Table 37 Asia-Pacific: Thyroid Spect Market, By Country, 2010 � 2017 ($Million)
Table 38 Asia-Pacific: Neurology Spect Market, By Country, 2010 � 2017 ($Million)
Table 39 Asia-Pacific: Other Spect Applications Market, By Country, 2010 � 2017 ($Million)
Table 40 Asia-Pacific: Pet Application Market, 2010 � 2017 ($Million)
Table 41 Asia-Pacific: Oncology Pet Market, By Country, 2010 � 2017 ($Million)
Table 42 Asia-Pacific: Cardiology Pet Market, By Country, 2010 � 2017 ($Million)
Table 43 Asia-Pacific: Neurology Pet Market, By Country, 2010 � 2017 ($Million)
Table 44 Asia-Pacific: Other Pet Applications Market, By Country, 2010 � 2017 ($Million)
Table 45 Asia-Pacific: Radiopharmaceutical Therapeutic Application Market, 2010 � 2017 ($Million)
Table 46 Asia-Pacific: Radiopharmaceutical Therapeutic Application Market, By Country, 2010 � 2017 ($Million)
Table 47 Asia-Pacific: Radiopharmaceutical Thyroid Application Market, By Country, 2010 � 2017 ($Million)
Table 48 Asia-Pacific: Radiopharmaceutical Bone Metastasis Application Market, By Country, 2010 � 2017 ($Million)
Table 49 Asia-Pacific: Radiopharmaceutical Lymphoma Application Market, By Country, 2010 � 2017 ($Million)
Table 50 Asia-Pacific: Radiopharmaceutical Endocrine Application Market, By Country, 2010 � 2017 ($Million)
Table 51 Asia-Pacific: Radiopharmaceutical Other Applications Market, By Country, 2010 � 2017 ($Million)
Table 52 Asia-Pacific: Stable Isotope Market, 2010 � 2017 ($Million)
Table 53 Asia-Pacific: Stable Isotope Market, By Country, 2010 � 2017 ($Million)
Table 54 Asia-Pacific: Carbon Stable Isotope Market, By Country, 2010 � 2017 ($Million)
Table 55 Asia-Pacific: Deuterium Stable Isotope Market, By Country, 2010 � 2017 ($Million)
Table 56 Asia-Pacific: Oxygen Stable Isotope Market, By Country, 2010 � 2017 ($Million)
Table 57 Asia-Pacific: Nitrogen Stable Isotope Market, By Country, 2010 � 2017 ($Million)
Table 58 Asia-Pacific: Other Stable Isotope Market, By Country, 2010 � 2017 ($Million)
Table 59 Asia-Pacific: Enriched Stable Isotope Market, By Application, 2010 � 2017 ($Million)
Table 60 Asia-Pacific: Stable Isotopes Market For Diagnostic & Therapeutic Applications, By Country, 2010 � 2017 ($Million)
Table 61 Asia-Pacific: Stable Isotopes Market For Research Applications, By Country, 2010 � 2017 ($Million)
Table 62 Asia-Pacific: Stable Isotopes Market For Pharmaceutical Applications, By Country, 2010 � 2017 ($Million)
Table 63 Asia-Pacific: Stable Isotopes Market For Industrial Applications, By Country, 2010 � 2017 ($Million)
Table 64 Asia-Pacific: Radiopharmaceuticals Market, By Country, 2010 � 2017 ($Million)
Table 65 Japan: Spect Radiopharmaceutical Market, 2010 � 2017 ($Million)
Table 66 Japan: Pet Radiopharmaceutical Market, 2010 � 2017 ($Million)
Table 67 Japan: Radiopharmaceutical Market, By Therapy, 2010 � 2017 ($Million)
Table 68 Japan: Beta Emitter Market, By Isotope, 2010 � 2017 ($Million)
Table 69 Japan: Brachytherapy Market, By Isotope, 2010 � 2017 ($Million)
Table 70 Japan: Stable Isotope Market, 2010 � 2017 ($Million)
Table 71 China: Spect Radiopharmaceutical Market, 2010 � 2017 ($Million)
Table 72 China: Pet Radiopharmaceutical Market, 2010 � 2017 ($Million)
Table 73 China: Radiopharmaceutical Market, By Therapy, 2010 � 2017 ($Million)
Table 74 China: Beta Emitter Market, By Isotope, 2010 � 2017 ($Million)
Table 75 China: Brachytherapy Market, By Isotope, 2010 � 2017 ($Million)
Table 76 China: Stable Isotope Market, 2010 � 2017 ($Million)
Table 77 India: Spect Radiopharmaceutical Market, 2010 � 2017 ($Million)
Table 78 India: Pet Radiopharmaceutical Market, 2010 � 2017 ($Million)
Table 79 India: Radiopharmaceutical Market, By Therapy, 2010 � 2017 ($Million)
Table 80 India: Beta Emitter Market, By Isotope, 2010 � 2017 ($Million)
Table 81 India: Brachytherapy Market, By Isotope, 2010 � 2017 ($Million)
Table 82 India: Stable Isotope Market, 2010 � 2017 ($Million)
Table 83 S. Korea: Spect Radiopharmaceutical Market, 2010 � 2017 ($Million)
Table 84 S. Korea: Pet Radiopharmaceutical Market, 2010 � 2017 ($Million)
Table 85 S. Korea: Radiopharmaceutical Market, By Therapy, 2010 � 2017 ($Million)
Table 86 S. Korea: Beta Emitter Market, By Isotope, 2010 � 2017 ($Million)
Table 87 S. Korea: Brachytherapy Market, By Isotope, 2010 � 2017 ($Million)
Table 88 S. Korea: Stable Isotope Market, 2010 � 2017 ($Million)
Table 89 Malaysia: Spect Radiopharmaceutical Market, 2010 � 2017 ($Million)
Table 90 Malaysia: Pet Radiopharmaceutical Market, 2010 � 2017 ($Million)
Table 91 Malaysia: Radiopharmaceutical Market, By Therapy, 2010 � 2017 ($Million)
Table 92 Malaysia: Beta Emitter Market, By Isotope, 2010 � 2017 ($Million)
Table 93 Malaysia: Brachytherapy Market, By Isotope, 2010 � 2017 ($Million)
Table 94 Malaysia: Stable Isotope Market, 2010 � 2017 ($Million)
Table 95 Indonesia: Spect Radiopharmaceutical Market, 2010 � 2017 ($Million)
Table 96 Indonesia: Pet Radiopharmaceutical Market, 2010 � 2017 ($Million)
Table 97 Indonesia: Radiopharmaceutical Market, By Therapy, 2010 � 2017 ($Million)
Table 98 Indonesia: Beta Emitter Market, By Isotope, 2010 � 2017 ($Million)
Table 99 Indonesia: Brachytherapy Market, By Isotope, 2010 � 2017 ($Million)
Table 100 Indonesia: Stable Isotope Market, 2010 � 2017 ($Million)
Table 101 Australia: Spect Radiopharmaceutical Market, 2010 � 2017 ($Million)
Table 102 Australia: Pet Radiopharmaceutical Market, 2010 � 2017 ($Million)
Table 103 Australia: Radiopharmaceutical Market, By Therapy, 2010 � 2017 ($Million)
Table 104 Australia: Beta Emitter Market, By Isotope, 2010 � 2017 ($Million)
Table 105 Australia: Brachytherapy Market, By Isotope, 2010 � 2017 ($Million)
Table 106 Australia: Stable Isotope Market, 2010 � 2017 ($Million)
Table 107 New Zealand: Spect Radiopharmaceutical Market, 2010 � 2017 ($Million)
Table 108 New Zealand: Pet Radiopharmaceutical Market, 2010 � 2017 ($Million)
Table 109 New Zealand: Radiopharmaceutical Market, By Therapy, 2010 � 2017 ($Million)
Table 110 New Zealand: Beta Emitter Market, By Isotope, 2010 � 2017 ($Million)
Table 111 New Zealand: Brachytherapy Market, By Isotope, 2010 � 2017 ($Million)
Table 112 New Zealand: Stable Isotope Market, 2010 � 2017 ($Million)
Table 113 Roa: Spect Radiopharmaceutical Market, 2010 � 2017 ($Million)
Table 114 Roa: Pet Radiopharmaceutical Market, 2010 � 2017 ($Million)
Table 115 Roa: Radiopharmaceutical Market, By Therapy, 2010 � 2017 ($Million)
Table 116 Roa: Beta Emitter Market, By Isotope, 2010 � 2017 ($Million)
Table 117 Roa: Brachytherapy Market, By Isotope, 2010 � 2017 ($Million)
Table 118 Roa: Stable Isotope Market, 2010 � 2017 ($Million) 221
Table 119 Agreements, Partnerships, Collaborations & Joint Ventures, 2010 � 2013
Table 120 Products Launch, 2010 � 2013
Table 121 Expansions, 2010 � 2012
Table 122 Mergers & Acquisitions, 2010 � 2012
Table 123 Other Developments, 2010 � 2012
Table 124 Cambridge Isotope Laboratories Inc.: Total Revenue, By Segment, 2010 � 2012 ($Million)
Table 125 Cambridge Isotope Laboratories Inc.: Total Revenue, By Geography, 2010 � 2012 ($Million)
Table 126 Cardinal Health, Inc.: Total Revenue, By Segment, 2010 � 2012 ($Million)
Table 127 Cardinal Health, Inc.: Total Revenue, By Geography, 2010 � 2012 ($Million)
Table 128 Covidien, Plc: Total Revenue And R&D Expenditure, 2010 � 2012 ($Million)
Table 129 Covidien, Plc: Total Revenue, By Segment, 2010 � 2012 ($Million)
Table 130 Covidien, Plc: Total Revenue, By Geography, 2010 � 2012 ($Million)
Table 131 Fujifilm Holdings Corp: Total Revenue, By Segment, 2010 � 2012 ($Million)
Table 132 Fujifilm Holdings Corp: Total Revenue, By Geography, 2010 � 2012 ($Million)
Table 133 General Electric Company: Total Revenue And R&D Expenses, 2009 � 2011 ($Billion)
Table 134 General Electric Company: Total Revenue, By Segment, 2009 � 2011 ($Billion)
Table 135 General Electric Company: Total Revenue, By Geography, 2009 � 2011 ($Billion)
Table 136 Iba Group: Market Revenue, By Segment, 2009 � 2011 ($Million)
Table 137 Iba Group: Total Revenue, By Geography, 2009 � 2011 ($Million)
Table 138 Isotec Inc.: Total Revenue, By Segment, 2009 � 2011 ($Million)
Table 139 Isotec Inc.: Total Revenue, By Geography, 2009 � 2011 ($Million)
Table 140 Lantheus: Total Revenue, By Segment, 2009 � 2011 ($Million)
Table 141 Lantheus: Total Revenue, By Geography, 2009 � 2011 ($Million)
Table 142 Nordion, Inc.: Total Revenue, By Segment, 2010 � 2012 ($Million)
Table 143 Siemens Ag: Total Revenue And R&D Expenses, 2010 � 2012 ($Million)
Table 144 Siemens Ag: Total Revenue, By Segment, 2010 � 2012 ($Million)
Table 145 Siemens Ag: Total Revenue, By Geography, 2010 � 2012 ($Million)
Table 146 Taiyo Nippon Sanso, Corp.: Total Revenue, By Geography, 2010 � 2012 ($Million)
List Of Figures (27 Figures)
Figure 1 Asia-Pacific: Radiopharmaceuticals Market, By Segment, 2010 � 2017
Figure 2 Asia-Pacific: Radiopharmaceuticals Market, By Country, 2012
Figure 3 Asia-Pacific: Stable Isotopes Market, 2012 � 2017 ($Million)
Figure 4 Radiopharmaceuticals Market Segmentation
Figure 5 Enriched Stable Isotopes Market Segmentation
Figure 6 Market Dynamics
Figure 7 Asia-Pacific: Radiopharmaceuticals Market Share Analysis, By Key Players, 2012
Figure 8 Asia-Pacific: Enriched Stable Isotope Market Share Analysis, By Key Players, 2012
Figure 9 Opportunity Matrix: Asia-Pacific Diagnostic Radiopharmaceuticals Market, 2012
Figure 10 Spect Radiopharmaceuticals Market Share, 2012
Figure 11 Pet Radiopharmaceuticals Market Share, 2012
Figure 12 Opportunity Matrix: Asia-Pacific Therapeutic Radiopharmaceuticals Market, 2012
Figure 13 Ra-223 Decay Chain
Figure 14 Porter�s Five Forces Analysis For Alpharadin
Figure 15 Swot Analysis Of Alpharadin
Figure 16 Asia-Pacific: Diagnostic Radiopharmaceuticals Market, By Indication, 2012
Figure 17 Key Growth Strategies, 2010 � 2013
Figure 18 Cambridge Isotope Laboratories, Inc.: Total Revenue And R&D Expenses, 2010 � 2012 ($Billion)
Figure 19 Cardinal Health, Inc.: Total Revenue, 2010 � 2012 ($Billion)
Figure 20 Covidien, Plc: Radiopharmaceuticals Revenue, 2010 � 2012 ($Billion)
Figure 21 Fujifilm Holdings Corp: Total Revenue And R&D Expenditure, 2010 � 2012 ($Billion)
Figure 22 Iba Group: Total Market Revenue, 2009 � 2011 ($Million)
Figure 23 Isotec Inc.: Total Revenue And R&D Expenses, 2009 � 2011 ($Billion)
Figure 24 Lantheus: Total Revenue And R&D Expenses, 2009 � 2011 ($Million)
Figure 25 Nordion, Inc.: Total Market Revenue, 2010 � 2012 ($Billion)
Figure 26 Taiyo Nippon Sanso, Corp.: Total Revenue And R&D Expenditure, 2010 � 2012 ($Billion)
Figure 27 Urenco Limited: Total Market Revenue, 2009 � 2011 ($Billion)

 Generating Response ...


Growth opportunities and latent adjacency in Asia-Pacific Nuclear Medicine/Radiopharmaceuticals & Stable Isotopes Market