Atomic Spectroscopy Market by Technology (Atomic Absorption Spectroscopy/X-Ray Fluorescence/X-Ray Diffraction/ICP-MS/ICP-OES) & by Application (Food & Beverage Testing/Pharmaceuticals & Biotechnology / Environmental Testing) - Analysis & Global Forecast to 2020


The atomic spectroscopy market is poised to reach USD 5.60 Billion by 2020, growing at a CAGR of 6.0% during the forecast period of 2015 to 2020. The growth of the overall market can be contributed to rising investments, funds, and grants by government bodies worldwide and technological advancements. In addition, growing food safety concerns and stringent regulations have contributed to market growth. In the coming years, the atomic spectroscopy market is expected to witness the highest growth rate in the Asia-Pacific region, with emphasis on India, China, and Japan. The high growth in India and China can be attributed to rising food safety concerns, emerging biotech industry and conferences that act as a platform for companies to showcase their products and establish business relations. North America is expected to account for the largest share of the global atomic spectroscopy market. However, the dearth of trained professionals and high cost of equipment are likely to restrain the growth of the market during the forecast period.
The report segments the market based on technology and applications. The atomic absorption spectroscopy segment is expected to account for the largest share of the market in 2015. However, ICP-MS is expected to grow at highest CAGR due to higher throughput as compared to GFAAS, high linear dynamic range, superior detection capability than ICP-OES, and the ability to obtain isotopic information.
Some of the major players in the global atomic spectroscopy market include Agilent Technologies (U.S.), PerkinElmer (U.S.), Thermo Fisher Scientific (U.S.), and Bruker Corporation (U.S.).
Get online access to the report on the World's First Market Intelligence Cloud
Request Sample Scope of the Report
:

This research report categorizes the atomic spectroscopy market into the following segments:
Atomic spectroscopy Market, by Technology
- Atomic Absorption Spectroscopy
- X-ray Diffraction Spectroscopy
- X-ray Fluorescence Spectroscopy
- Inductively Coupled Plasma- Optical Emission Spectroscopy
- Inductively Coupled Plasma- Mass Spectrometry
- Others (Microwave-induced plasma optical emission spectroscopy, glow discharge optical emission spectroscopy, laser spectroscopy, and X-ray photoelectron spectroscopy )
Atomic spectroscopy Market, by Application
- Pharmaceuticals & Biotechnology
- Geochemical/Mining
- Industrial Chemistry
- Environmental Testing
- Food & Beverage Testing
- Petrochemical
- Others (Academia, forensic laboratories, biomonitoring, agriculture, and nuclear energy)
Atomic spectroscopy Market, by Region
- North America
- U.S.
- Canada
- Europe
- Germany
- U.K.
- Spain
- Italy
- France
- Rest of Europe (RoE)
- Asia-Pacific
- Japan
- China
- India
- Rest of APAC
- Rest of the World (RoW)
Stakeholders of the Atomic Spectroscopy Market
- Manufacturers
- Suppliers/Distributors
- Pharmaceutical Companies
- Biotechnology Companies
- Academic Centers
- Research Institutes
- Venture Capitalists
Available Customizations
With the given market data, MarketsandMarkets offers customizations as per the company�s specific needs. The following customization option is available for the report:
Portfolio Assessment
Product Matrix, which gives a detailed comparison of the product portfolios of the top three companies in the market.
The demand for atomic spectroscopy systems has been on the rise due to the burgeoning requirements of the life sciences and pharmaceutical industries as wells as the substantial demand from the chemical and petrochemical industries. Various regulatory authorities across industries have enforced stringent safety regulations in order to ensure that the products launched in the market adhere to quality specifications. The use of atomic spectroscopy technologies facilitate the compliance with these regulations by enabling the measurement and monitoring of the level of metals in samples.
The global market is segmented on the basis of technology, application, and region. By technology, the market comprises X-Ray Fluorescence Spectroscopy, Atomic Absorption Spectroscopy, X-Ray Diffraction Spectroscopy, Inductively Coupled Plasma Spectroscopy, Inductively Coupled Plasma-Mass Spectroscopy, Elemental Analyzers, and others. Other atomic spectroscopy market includes Microwave-induced plasma optical emission spectroscopy, glow discharge optical emission spectroscopy, laser spectroscopy, and X-ray photoelectron spectroscopy. In 2015, the atomic absorption spectroscopy segment is estimated to account for the largest share of the market and ICP-MS is expected to grow at the highest rate during the forecast period.
On the basis of application, the atomic spectroscopy market is divided food and beverage testing, pharmaceuticals, industrial chemistry, environmental testing, biotechnology, and others. In 2015, the food & beverage segment is expected to account for the largest share of the market and grow at the highest rate.
The key factors expected to spur the growth of the atomic spectroscopy market are increased investments, funding, and grants by government bodies worldwide; ongoing new product launches; technological advancements; increase in the number of conferences, which helps to create awareness of the techniques; and growing concerns for food and drug safety. However, the high cost of equipments and the need for highly trained professionals are likely to restrain the growth of this market.
On the basis of region, this market is categorized into North America, Europe, Asia-Pacific, and the Rest of the World (RoW).
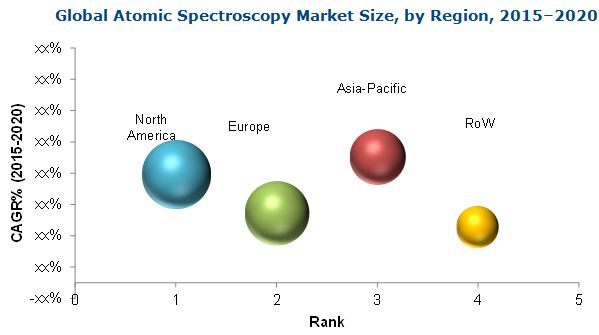
**Note: The size of the bubble chart depicts the market size (USD million) in 2015
Source: U.S. Food and Drug Association (USFDA), World Health Organization (WHO), Centers for Disease Control and Prevention (CDC), The Natural Sciences and Engineering Research Council of Canada (NSERC), Associated Chambers of Commerce and Industry (ASSOCHAM), National Institutes of Health (NIH), Federation of Analytical Chemistry and Spectroscopy Societies, Society for Applied Spectroscopy, Canadian Society for Analytical Sciences and Spectroscopy, Expert Interviews, and MarketsandMarkets Analysis.
The atomic spectroscopy market is expected to reach USD 5. 60 Billion in 2020 from USD 4.18 Billion in 2015 at a CAGR of 6.0%. The market is dominated by North America, followed by Europe, Asia-Pacific, and the Rest of the World (RoW). Asia-Pacific is expected to grow at the fastest rate during the forecast period
The major players in this market include Thermo Fisher Scientific, Inc. (U.S.), PerkinElmer, Inc. (U.S.), Agilent Technologies (U.S.), Bruker Corporation (U.S.), Rigaku Corporation (Japan), and Shimadzu Corporation (Japan) among others.
Table of Contents
1 Introduction (Page No. - 14)
1.1 Objectives of the Study
1.2 Market Definition
1.3 Market Scope
1.3.1 Markets Covered
1.3.2 Years Considered for the Study
1.4 Currency
1.5 Limitations
1.6 Stakeholders
2 Research Methodology (Page No. - 17)
2.1 Research Methodology Steps
2.2 Secondary and Primary Research Methodology
2.2.1 Secondary Research
2.3 Key Data From Secondary Sources
2.3.1 Primary Research
2.3.2 Key Industry Insights
2.4 Key Data From Primary Sources
2.5 Key Insights From Primary Sources
2.6 Market Size Estimation Methodology
2.7 Research Design
2.8 Market Data Validation and Triangulation
2.9 Assumptions for the Study
3 Executive Summary (Page No. - 26)
3.1 Current Scenario
3.2 Future Outlook
3.3 Conclusion
4 Premium Insights (Page No. - 30)
4.1 Market Overview
4.2 Geographical Snapshot
4.3 Market, By Technology (2015 vs. 2020)
4.4 Atomic Spectroscopy Market, By Application (2015 vs. 2020)
5 Market Overview (Page No. - 33)
5.1 Introduction
5.2 Market Segmentation
5.3 Market Dynamics
5.3.1 Drivers
5.3.1.1 Atomic Spectroscopy to Aid in the Drug Safety Process and Medical Research
5.3.1.1.1 Stringent Regulations Related to the Drug Safety Process to Push the Demand for Atomic Absorption Spectroscopy
5.3.1.1.2 Rising Use of X-Ray Fluorescence in Medical Research
5.3.1.2 New International CGMP & CGDP Certification for Pharmaceutical Excipients
5.3.1.3 Growing Food Safety Concerns
5.3.1.4 Increasing Government Investments in Atomic Spectroscopy Technologies
5.3.2 Restraints
5.3.2.1 Lack of Skilled Professionals
5.3.3 Opportunities
5.3.3.1 New Product Launches
5.3.3.2 Requirement to Comply With the Revised Chapter 231 of the U.S. Pharmacopeia to Boost the Demand for ICP-MS Globally
5.3.3.3 Growing Opportunities in Emerging Nations
6 Atomic Spectroscopy Market, By Application (Page No. - 41)
6.1 Introduction
6.2 Food & Beverage Testing
6.3 Petrochemical
6.4 Geochemical/Mining
6.5 Pharmaceuticals & Biotechnology
6.6 Industrial Chemistry
6.7 Environmental Testing
6.8 Other Applications
7 Atomic Spectroscopy Market, By Technology (Page No. - 57)
7.1 Introduction
7.2 Atomic Absorption Spectroscopy (AAS)
7.3 X-Ray Fluorescence (XRF)
7.4 X-Ray Diffraction (XRD)
7.5 Inductively Coupled Plasma-Optical Emission Spectroscopy (ICP-OES)
7.6 Inductively Coupled Plasma�Mass Spectrometry (ICP-MS)
7.7 Elemental Analyzers
7.8 Others
8 Atomic Spectroscopy Market, By Region (Page No. - 71)
8.1 Introduction
8.2 North America
8.2.1 U.S.
8.2.1.1 Favorable Government Funding to Boost the Atomic Spectroscopy Market
8.2.1.2 Atomic Spectroscopy Conferences, Symposia, & Seminars Hosted By the U.S.
8.2.2 Canada
8.2.2.1 Funding for Innovation-Based Research
8.2.2.2 Conferences, Discussions, Symposia, & Seminars Hosted By Canada
8.3 Europe
8.3.1 Germany
8.3.1.1 Funding in Germany
8.3.2 U.K.
8.3.2.1 Increased Investments in Pharmaceutical Development
8.3.2.2 Rising Usage of Atomic Spectroscopy in Food Authenticity Testing
8.3.3 France
8.3.3.1 Growing Pharmaceutical Industry
8.3.4 Spain
8.3.4.1 Scientific Research Driven By Funds and Grants
8.3.5 Italy
8.3.5.1 Growing Biotech and Pharmaceutical Industry in Italy
8.3.6 Rest of Europe (RoE)
8.3.6.1 Investments By Pharmaceutical Players in Russia
8.3.6.2 Upward Trend in Russia�s Pharmaceutical Sector
8.3.6.3 Denmark: A Standout in Life Sciences
8.4 Asia-Pacific
8.4.1 Japan
8.4.1.1 Increasing Food Safety Concern
8.4.1.2 Conferences and Symposia
8.4.2 China
8.4.2.1 Rising Use of Atomic Spectroscopy for Cancer Treatments
8.4.2.2 Emerging Biotech Industry
8.4.3 India
8.4.3.1 Food Safety Concerns on the Rise
8.4.3.2 Soil Health Gaining Importance
8.4.3.3 Conferences, Symposia, and Workshops
8.4.4 Rest of Asia-Pacific
8.4.4.1 Free Trade Agreement Between Korea and the U.S.
8.4.4.2 Growing Infrastructural Development in Vietnam
8.5 Rest of the World (RoW)
8.5.1 Latin America
8.5.1.1 Favorable Biotechnology and Pharmaceutical Environment in Brazil
8.5.1.2 Mexico, A Production Hub for Global Pharmaceutical Companies
8.5.2 Middle East and Africa
8.5.2.1 Rising Usage of Atomic Spectroscopy in African Mining Industry
8.5.2.2 Increasing Focus of Pharmaceutical Companies on Africa
8.5.2.3 Favorable Business Environment for Pharmaceutical and Biotechnology Industries in Saudi Arabia, the UAE
9 Competitive Landscape (Page No. - 108)
9.1 Overview
9.2 Market Share Analysis
9.2.1 Thermo Fisher Scientific, Inc.
9.2.2 Agilent Technologies, Inc.
9.2.3 Perkinelmer, Inc.
9.3 Competitive Situation and Trends
9.3.1 New Product Launches
9.3.2 Expansions
9.3.3 Mergers & Acquisitions
9.3.4 Agreements, Partnerships, Collaborations, and Alliances
10 Company Profiles (Page No. - 116)
10.1 Introduction
10.2 Agilent Technologies, Inc.
10.3 Bruker Corporation
10.4 Thermo Fisher Scientific, Inc.
10.5 Perkinelmer, Inc.
10.6 Rigaku Corporation
10.7 Shimadzu Corporation.
10.8 Analytik Jena AG
10.9 Aurora Biomed
10.10 GBC Scientific Equipment Pty Ltd
10.11 Hitachi High-Technologies Corporation
*Details on Financials, Products & Services, Key Strategy, & Recent Developments Might Not Be Captured in Case of Unlisted Companies.
11 Appendix (Page No. - 140)
11.1 Discussion Guide
11.2 Other Developments, By Company (2012-2015)
11.2.1 Agilent Technologies, Inc.
11.2.2 Rigaku Corporation
11.2.3 Analytik Jena AG
11.2.4 Bruker Corporation
11.2.5 Thermo Fisher Scientific, Inc.
11.2.6 Shimadzu Corporation
11.3 Introducing RT: Real-Time Market Intelligence
11.4 Available Customizations
11.5 Related Reports
List of Tables (78 Tables)
Table 1 New International CGMP & CGDP Certification is Propelling the Growth of the Atomic Spectroscopy Market
Table 2 Lack of Skilled Professionals is Restraining the Growth of the Atomic Spectroscopy Market
Table 3 New Product Launches Offer A Huge Growth Potential for the Atomic Spectroscopy Market
Table 4 Atomic Spectroscopy Market Size, By Application,2013�2020 (USD Million)
Table 5 China to Have the Largest Fish Supply and Food Fish Consumption By 2030
Table 6 Milk & Milk Product Statistics (Thousand Tones, Milk Equivalent)
Table 7 Atomic Spectroscopy Market Size for Food & Beverage Testing, By Region, 2013�2020 (USD Million)
Table 8 Atomic Spectroscopy Market Size for Food & Beverage Testing, By Country, 2013�2020 (USD Million)
Table 9 Global Market Size for Petrochemical Testing, By Region, 2013�2020 (USD Million)
Table 10 Atomic Spectroscopy Market Size for Petrochemical Testing, By Country, 2013�2020 (USD Million)
Table 11 Global Market Size for Geochemical/Mining, By Region, 2013�2020 (USD Million)
Table 12 Atomic Spectroscopy Market Size for Geochemical/Mining, By Country, 2013�2020 (USD Million)
Table 13 Global Market Size for Pharmaceuticals & Biotechnology, By Region, 2013�2020 (USD Million)
Table 14 Market Size for Pharmaceuticals & Biotechnology, By Country, 2013�2020 (USD Million)
Table 15 Atomic Spectroscopy Market Size for Industrial Chemistry, By Region, 2013�2020 (USD Million)
Table 16 Global Market Size for Industrial Chemistry, By Country, 2013�2020 (USD Million)
Table 17 Market Size for Environmental Testing, By Region, 2013�2020 (USD Million)
Table 18 Atomic Spectroscopy Market Size for Environmental Testing, By Country, 2013�2020 (USD Million)
Table 19 Global Market Size for Other Applications, By Region, 2013�2020 (USD Million)
Table 20 Market Size for Other Applications, By Country, 2013�2020 (USD Million)
Table 21 Atomic Spectroscopy Market Size, By Technology, 2013�2020 (USD Million)
Table 22 Atomic Absorption Spectroscopy Market Size, By Region, 2013�2020 (USD Million)
Table 23 Atomic Absorption Spectroscopy Market Size, By Country, 2013�2020 (USD Million)
Table 24 X-Ray Fluorescence (XRF) Market Size, By Region,2013�2020 (USD Million)
Table 25 X-Ray Fluorescence (XRF) Market Size, By Country,2013�2020 (USD Million)
Table 26 X-Ray Diffraction (XRD) Market Size, By Region, 2013�2020 (USD Million)
Table 27 X-Ray Diffraction (XRD) Market Size, By Country,2013�2020 (USD Million)
Table 28 Inductively Coupled Plasma�Optical Emission Spectroscopy (ICP-OES) Market Size, By Region, 2013�2020 (USD Million)
Table 29 Inductively Coupled Plasma�Optical Emission Spectroscopy (ICP-OES) Market Size, By Country, 2013�2020 (USD Million)
Table 30 Inductively Coupled Plasma�Mass Spectrometry (ICP-MS) Market Size, By Region, 2013�2020 (USD Million)
Table 31 Inductively Coupled Plasma�Mass Spectrometry (ICP-MS) Market Size, By Country, 2013�2020 (USD Million)
Table 32 Element Analyzers Market Size, By Region, 2013�2020 (USD Million)
Table 33 Elemental Analyzers Market Size, By Country, 2013�2020 (USD Million)
Table 34 Other Spectroscopy Market Size, By Region, 2013�2020 (USD Million)
Table 35 Other Spectroscopy Market Size, By Country, 2013�2020 (USD Million)
Table 36 Global Atomic Spectroscopy Market Size, By Region, 2013�2020 (USD Million)
Table 37 Global Market Size, By Country, 2013�2020 (USD Million)
Table 38 North America: Atomic Spectroscopy Market Size, By Country, 2013�2020 (USD Million)
Table 39 North America: Market Size, By Technology, 2013�2020 (USD Million)
Table 40 North America: Market Size, By Application, 2013�2020 (USD Million)
Table 41 U.S.: Atomic Spectroscopy Market Size, By Technology, 2013�2020 (USD Million)
Table 42 U.S.: Market Size, By Application, 2013�2020 (USD Million)
Table 43 Canada: Atomic Spectroscopy Market Size, By Technology,2013�2020 (USD Million)
Table 44 Canada: Market Size, By Application, 2013�2020 (USD Million)
Table 45 Europe: Atomic Spectroscopy Market Size, By Country, 2013�2020 (USD Million)
Table 46 Europe: Market Size, By Technology, 2013�2020 (USD Million)
Table 47 Europe: Market Size, By Application, 2013�2020 (USD Million)
Table 48 Germany: Market Size, By Technology, 2013�2020 (USD Million)
Table 49 Germany: Market Size, By Application, 2013�2020 (USD Million)
Table 50 U.K.: Atomic Spectroscopy Market Size, By Technology, 2013�2020 (USD Million)
Table 51 U.K: Market Size, By Application, 2013�2020 (USD Million)
Table 52 France: Atomic Spectroscopy Market Size, By Technology, 2013�2020 (USD Million)
Table 53 France: Market Size, By Application, 2013�2020 (USD Million)
Table 54 Spain: Atomic Spectroscopy Market Size, By Technology, 2013�2020 (USD Million)
Table 55 Spain: Market Size, By Application, 2013�2020 (USD Million)
Table 56 Italy: Atomic Spectroscopy Market Size, By Technology, 2013�2020 (USD Million)
Table 57 Italy: Market Size, By Application, 2013�2020 (USD Million)
Table 58 Rest of Europe: Atomic Spectroscopy Market Size, By Technology 2013�2020 (USD Million)
Table 59 Rest of Europe: Market Size, By Application, 2013�2020 (USD Million)
Table 60 Asia-Pacific: Atomic Spectroscopy Market Size, By Country, 2013�2020 (USD Million)
Table 61 Asia-Pacific: Market Size, By Technology, 2013�2020 (USD Million)
Table 62 Asia-Pacific: Market Size, By Application, 2013�2020 (USD Million)
Table 63 Conferences, Symposia, & Workshops Hosted in Japan (2012-2015)
Table 64 Japan: Market Size, By Technology, 2013�2020 (USD Million)
Table 65 Japan: Market Size, By Application, 2013�2020 (USD Million)
Table 66 China: Atomic Spectroscopy Market Size, By Technology, 2013�2020 (USD Million)
Table 67 China: Market Size, By Application, 2013�2020 (USD Million)
Table 68 Conferences, Symposia, & Workshops Hosted in India (2014-2015)
Table 69 India: Atomic Spectroscopy Market Size, By Technology, 2013�2020 (USD Million)
Table 70 India: Market Size, By Application, 2013�2020 (USD Million)
Table 71 RoAPAC: Atomic Spectroscopy Market Size, By Technology, 2013�2020 (USD Million)
Table 72 RoAPAC: Market Size, By Application, 2013�2020 (USD Million)
Table 73 Rest of the World: Market Size, By Technology, 2013�2020 (USD Million)
Table 74 Rest of the World: Market Size, By Application, 2013�2020 (USD Million)
Table 75 New Product Launches, 2012�2015
Table 76 Expansions, 2012�2015
Table 77 Mergers & Acquisitions, 2012�2015
Table 78 Agreements, Partnerships, Collaborations, and Alliances, 2012�2015
List of Figures (29 Figures)
Figure 1 Market Research Methodology Steps
Figure 2 Sampling Frame: Primary Research
Figure 3 Breakdown of Primary Interviews: By Company Type, Designation, and Region
Figure 4 Market Size Estimation Methodology: Bottom-Up Approach
Figure 5 Market Size Estimation Methodology: Top-Down Approach
Figure 6 Research Design
Figure 7 Data Triangulation Methodology
Figure 8 North America Expected to Dominate the Global Market in 2015
Figure 9 ICP-MS Segment to Witness the Highest CAGR From 2015 to 2020
Figure 10 Asia-Pacific Market Expected to Grow at the Highest CAGR During the Forecast Period
Figure 11 Rising Government Investments in Atomic Spectroscopy Technologies to Propel Market Growth During the Forecast Period
Figure 12 Asia-Pacific Market to Witness Highest Growth Rate From 2015 to 2020
Figure 13 Atomic Absorption Spectroscopy Segment to Command the Largest Share in 2015
Figure 14 Food & Beverage Testing Segment Commands the Largest Share in 2015
Figure 15 Food & Beverage Testing Segment to Grow at the Highest CAGR During the Forecast Period
Figure 16 Global Atomic Spectroscopy Market Segmentation, By Technology
Figure 17 The ICP-MS Segment is Expected to Grow at the Highest CAGR During the Forecast Period
Figure 18 North America Expected to Command the Largest Share of the Global Atomic Spectroscopy Market in 2015
Figure 19 U.S. to Witness the Highest Growth in the North American Market (2015)
Figure 20 Germany to Witness the Highest Growth in the European Market (2015)
Figure 21 China to Witness the Highest Growth in the Asia-Pacific Atomic Spectroscopy Market (2015)
Figure 22 RoW Expected to Grow at A CAGR of 3.6% During 2015 to 2020
Figure 23 New Product Launches is the Key Growth Strategy Adopted By Market Players
Figure 24 Battle for Market Share: New Product Launches Was the Key Strategy
Figure 25 Key Players Focusing on New Product Launches, 2012-2015
Figure 26 Key Players Focusing on Expansions, 2012-2015
Figure 27 Key Players Focusing on Mergers & Acquisitions, 2012-2015
Figure 28 Key Players Focusing on Agreements, Partnerships, Collaborations, and Alliances, 2012-2015
Figure 29 Product Benchmarking of the Top 3 Market Players

 Generating Response ...


Growth opportunities and latent adjacency in Atomic Spectroscopy Market