Automated Border Control Market

Automated Border Control Market by Hardware (Document Authentication System, Biometric Verification System (Facial & Iris Recognition)), Software, Solution Type (Automated Boarding E-gates, Security Checkpoint E-gates, Kiosks) - Global Forecast to 2028

Report Code: SE 5525 May, 2023, by marketsandmarkets.com

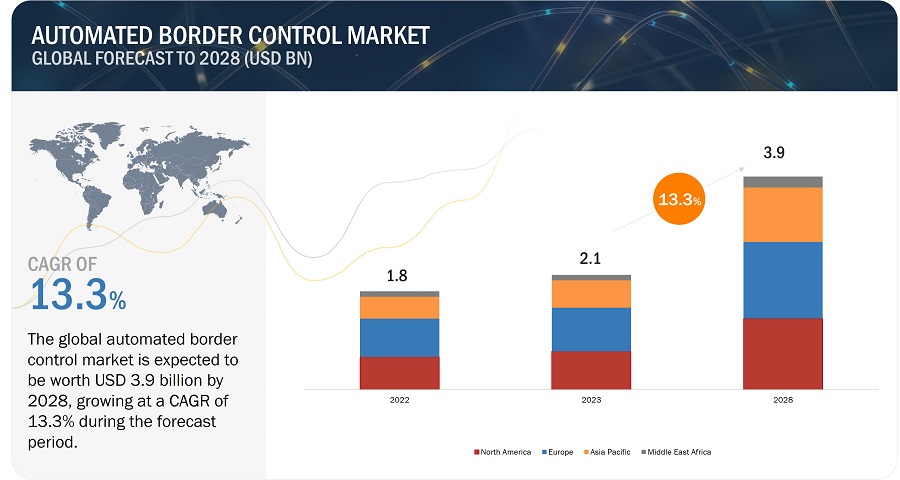
[227 Pages Report] The Global Automated Border Control Market size is expected to grow from USD 2.1 billion in 2023 to USD 3.9 billion by 2028, at a compound annual growth rate (CAGR) of 13.3%.

The rise in the number of international passengers propelled the travel and tourism industry, and growing security concerns at all the ports are the major driving factors for the growth of the automated border control industry. Moreover, the increase in the deployment of digital ID verification systems and the growing incorporation of AI in automated border control systems are some factors that are also expected to drive the growth of the market in the near future.
Automated Border Control Market

Automated Border Control Market

Automated Border Control Market Forecast to 2028

To know about the assumptions considered for the study, Request for Free Sample Report

Automated Border Control Market Dynamics

DRIVER: Rise in number of international passengers to propel travel and tourism industry

The transportation industry plays a major role in the GDP of any country. According to the World Travel & Tourism Council, travel and tourism contributed 6.1% to the global GDP in 2021. The growth of the transportation industry in any country is determined by factors such as the rising tourism industry, economic growth, infrastructure, and per capita income of consumers. Besides, a significant rise in international passenger travel has been observed in recent years. This has resulted in an increase in the demand for effective border control systems. As more people travel across borders, traditional manual border control processes have become overwhelmed, leading to long wait times and decreased efficiency. Hence, border crossings have largely installed ABC systems, i.e., eGates and kiosks, owing to their ability to efficiently handle a large number of travelers compared with border control agents.

RESTRAINT: Lack of security standardization across different systems and countries

Security standard for different countries is determined by the policies formulated by their governments. The policies keep on changing and upgrading as per the requirement of all the regions. For instance, some countries might check goods crossing their border, some might check people, while others may check both depending upon the mode of transport and political situations among the countries. Moreover, the requirement for ABC systems has changed since its inception. The first generation of e-gates was introduced in 2002 and relied on simple barcode scanning technology to authenticate the passport or travel document of the traveler. These systems were limited in their ability to detect fraudulent documents and could be easily bypassed by individuals using fake passports or stolen identities. These systems were defined by each state.

OPPORTUNITY: Growing implementation of digital ID verification systems by governments and transportation organizations

Digital ID verification is becoming increasingly popular due to its convenience, speed, and security, and it is being adopted by a growing number of travelers around the world. As a result, many governments and transportation organizations are investing in ABC systems that incorporate digital ID verification to enhance the travel experience.

Digital ID verification through mobile devices eliminates the need for travelers to carry physical documents and can be completed from anywhere, making the process more convenient. It can incorporate advanced security features, such as biometric authentication and facial recognition technology, to improve the accuracy and effectiveness of border control procedures. Besides, these systems are more cost-effective to implement than traditional border control methods, as they do not require as much specialized hardware or infrastructure.

CHALLENGE: Rising risk of cyberattacks on automated border control systems in transportation industry

ABC systems streamline the process of clearing international travelers through customs and immigration checkpoints. These systems use advanced technologies such as biometrics and machine learning to quickly and accurately authenticate the identities of travelers and determine their eligibility to enter a country. However, cyberattacks on these systems lead to compromise the security and integrity of the entire border control process. Cyberattacks are a major concern in the transportation industry as they involve travelers’ personal data, including their biometrics. Hackers try to access sensitive personal information stored in the eGate systems, such as passport information and biometric data, to use for criminal activities.

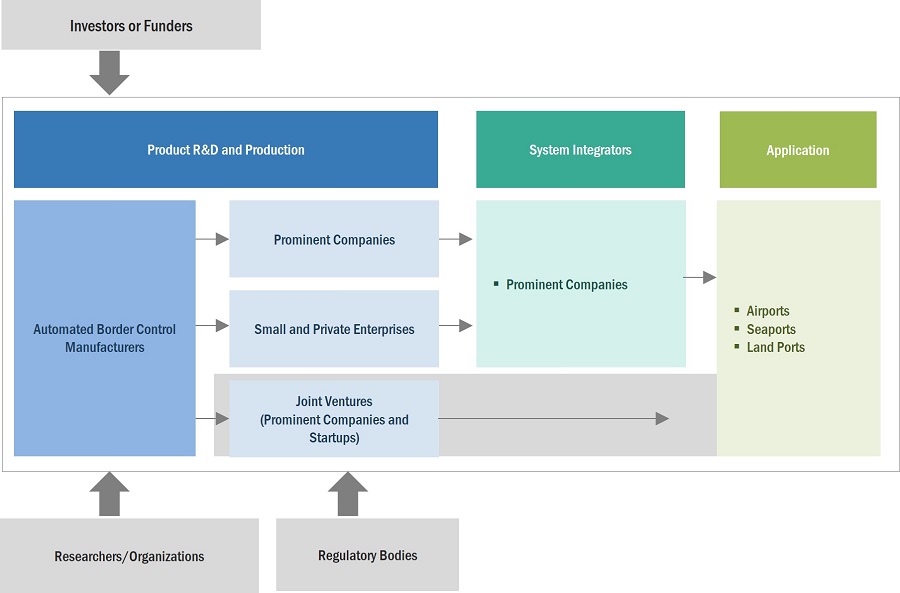
Automated Border Control Ecosystem

Prominent companies in this market include well-established, financially stable manufacturers and providers of automated border control systems. These companies have been operating in the market for several years and possess a diversified product portfolio, state-of-the-art technologies, and strong global sales and marketing networks. Prominent companies in this market include Vision-Box (Portugal), SITA (Netherlands), Secunet Security Networks AG (Germany), IDEMIA (France), and Thales (France).
Automated Border Control Market by Ecosystem

ABC E-Gates is estimated to hold the highest CAGR during the forecast period

Automated border control E-gates are physical gates that travelers walk through, and they use advanced biometric technologies, such as facial recognition, fingerprint scanning, and iris recognition, to verify travelers’ identities. E-gates are typically installed at airports, seaports, and land borders, and they are designed to process large volumes of travelers quickly. In 2022, the ABC E-gates segment held a larger share of the automated border control market. These ABC e-gates are in high demand by applications, such as airports and seaports, as these systems allow border control agencies to process travelers more quickly and efficiently than traditional manual methods and enhance security at the ports. Besides, these systems process a maximum number of passengers without increasing staff costs, which is also responsible for the growth of the segment.

Hardware segment holds the largest share of automated border control in 2022

Hardware plays a crucial role in the development of automated border control systems. In 2022, hardware offerings held a larger share of the automated border control market. The hardware components in the automated border control system have led to the development of more advanced and reliable self-service kiosks and e-gates, which in turn, is driving the demand for advanced hardware components. Besides, the increasing need for biometric verification in the border control process is also responsible for the growth of the segment. Biometric verification is the most accurate and authentic validation technology suggested by transport authorities globally.

Seaports segment to be the second-largest growing segment during the forecast period

Seaports that serve as border crossings for people often have dedicated facilities and processes in place to process the immigration and customs requirements of passengers. These facilities are equipped with checkpoints, counters, and personnel to process the arrival and departure of individuals. Seaports used for border crossing of people implement robust security measures. Hence, automated border control systems are being implemented at seaports to enhance security, streamline operations, and facilitate the movement of goods and passengers. The seaports segment is expected to hold considerable growth of the automated border control market during the forecast period owing to the growing maritime trade, security enhancement requirements, and efficient cargo processing.

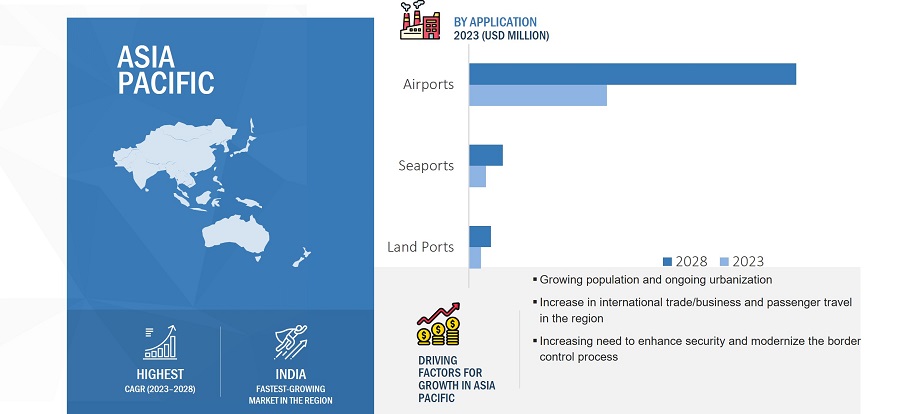
Asia Pacific region is likely to hold the largest growth rate by 2028

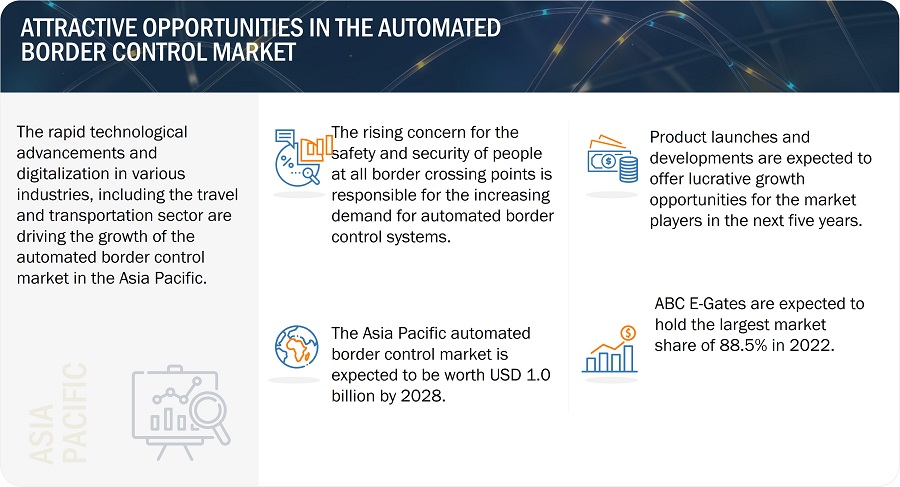
Asia Pacific comprises a diverse range of economies with varying levels of development. The region is experiencing a significant increase in air travel, driven by factors such as economic growth, rising incomes, and an expanding middle class. This growth in air travel necessitates the implementation of efficient automated border control systems to handle the rising passenger volumes. Besides, the rapid technological advancements and digitalization in various industries, including the travel and transportation sector, is also significant factor driving the growth of the automated border control market in APAC. This digital transformation has fueled the adoption of automated border control systems as part of a broader effort to modernize and streamline border control processes.
Automated Border Control Market by Region

Automated Border Control Market by Region

To know about the assumptions considered for the study, download the pdf brochure

Top Automated Border Control Companies - Key Market Players

The automated border control companies is dominated by a few globally established players such as Vision-Box (Portugal), SITA (Netherlands), Secunet Security Networks AG (Germany), IDEMIA (France), Thales (France), NEC Corporation (Japan), Indra Sistemas, S.A. (Spain), Gunnebo AB (Sweden), and HID Global Corporation (US).

Get online access to the report on the World's First Market Intelligence Cloud

  • Easy to Download Historical Data & Forecast Numbers
  • Company Analysis Dashboard for high growth potential opportunities
  • Research Analyst Access for customization & queries
  • Competitor Analysis with Interactive dashboard
  • Latest News, Updates & Trend analysis
Request Sample

Scope of the Report

Report Metric

Details

Market Size Available for Years

2019–2028

Base Year

2022

Forecast Period

2023–2028

Units

Value (USD Million/Billion)

Segments Covered

Border Crossing Procedure Type, Solution Type, Component, and Application

Geographic Regions Covered

North America, Europe, Asia Pacific, and the Rest of the World

Companies Covered

Major Players: Vision-Box (Portugal), SITA (Netherlands), Secunet Security Networks AG (Germany), IDEMIA (France), Thales (France), NEC Corporation (Japan), Indra Sistemas, S.A. (Spain), Gunnebo AB (Sweden), HID Global Corporation (US), among others - total 25 players have been covered.

Automated Border Control Market Highlights

This research report segments the automated border control market based on border crossing procedure type, solution type, component, application, and region.

Segment

Subsegment

By Border Crossing Procedure Type:

  • One-step Process
  • Integrated Two-step Process
  • Segregated Two-step Process

By Solution Type:

  • ABC E-Gates
    • Automated Boarding E-gates
    • Security Checkpoint E-gates
  • ABC Kiosks

By Component:

  • Hardware
    • Document Authentication System
      • Optical Character Recognition
      • Barcode Reader
      • Signature Scanner
    • Biometric Verification System
      • Face Recognition
      • Fingerprint Recognition
      • Iris Recognition
      • Other Biometric Verification Systems
    •  Baggage Scanner
      • RFID Tags
    • Digital ID Verification (Mobiles, Tablets)
  • Software
  • Services
    • Installation
    • Maintenance

By Application:

  • Airports
  • Seaports
  • Land Ports

By Region:

  • North America
  • Europe
  • Asia Pacific (APAC)
  • Rest of the World (RoW)

Recent Developments

  • In March 2023, IDEMIA has announced the launch of two contactless biometric devices, namely OneLook Gen 2 and MorphoWave TP. The devices are designed to provide a faster, more secure, and barrier-free biometric verification.
  • In February 2023, Frankfurt Airport has team up with SITA and NEC Corporation to introduce a biometric passenger journey by deploying SITA Smart Path which brings a comprehensive biometric passenger processing solution across all terminal and airlines at Frankfurt Airport. The implementation would see additional biometric touchpoints installed by spring 2023.
  • In June 2022, Vision-Box unveiled its latest solution namely, Seamless Kiosk – The New Generation of Biometric Technology, which is set to transform the travel experience. This latest solution combines the newest Common Use Self-Service (CUSs) 2.0 platform and border control processing, including Entry/Exit System (EES) requirements.

Frequently Asked Questions (FAQ):

To speak to our analyst for a discussion on the above findings, click Speak to Analyst

TABLE OF CONTENTS
 
1 INTRODUCTION (Page No. - 29)
    1.1 STUDY OBJECTIVES 
    1.2 MARKET DEFINITION 
           1.2.1 INCLUSIONS AND EXCLUSIONS
    1.3 STUDY SCOPE 
           1.3.1 MARKETS COVERED
                    FIGURE 1 AUTOMATED BORDER CONTROL MARKET: MARKET SEGMENTATION
           1.3.2 GEOGRAPHICAL SCOPE
           1.3.3 YEARS CONSIDERED
    1.4 CURRENCY CONSIDERED 
    1.5 RESEARCH LIMITATIONS 
    1.6 STAKEHOLDERS 
    1.7 SUMMARY OF CHANGES 
 
2 RESEARCH METHODOLOGY (Page No. - 34)
    2.1 RESEARCH DATA 
           FIGURE 2 AUTOMATED BORDER CONTROL MARKET: RESEARCH DESIGN
           2.1.1 SECONDARY AND PRIMARY RESEARCH
           2.1.2 SECONDARY DATA
                    2.1.2.1 Major secondary sources
                    2.1.2.2 Key data from secondary sources
           2.1.3 PRIMARY DATA
                    2.1.3.1 Primary interviews with experts
                    2.1.3.2 Key data from primary sources
                    2.1.3.3 Key industry insights
                    2.1.3.4 Breakdown of primaries
    2.2 MARKET SIZE ESTIMATION 
           FIGURE 3 APPROACH (SUPPLY SIDE): REVENUE GENERATED THROUGH SALES OF PRODUCTS/SOLUTIONS/SERVICES FOR AUTOMATED BORDER CONTROL MARKET
           2.2.1 BOTTOM-UP APPROACH
                    2.2.1.1 Approach for arriving at market size using bottom-up analysis
                               FIGURE 4 MARKET SIZE ESTIMATION METHODOLOGY: BOTTOM-UP APPROACH
           2.2.2 TOP-DOWN APPROACH
                    2.2.2.1 Approach for capturing market sizing using top-down analysis
                               FIGURE 5 MARKET SIZE ESTIMATION METHODOLOGY: TOP-DOWN APPROACH
    2.3 MARKET BREAKDOWN AND DATA TRIANGULATION 
           FIGURE 6 AUTOMATED BORDER CONTROL MARKET: DATA TRIANGULATION
    2.4 STUDY ASSUMPTIONS 
           FIGURE 7 STUDY ASSUMPTIONS IN AUTOMATED BORDER CONTROL MARKET
    2.5 APPROACH TO UNDERSTANDING IMPACT OF RECESSION ON AUTOMATED BORDER CONTROL MARKET 
    2.6 RESEARCH LIMITATIONS AND RISK ASSESSMENT 
           TABLE 1 RESEARCH LIMITATIONS AND ASSOCIATED RISKS
 
3 EXECUTIVE SUMMARY (Page No. - 46)
    FIGURE 8 ABC E-GATES SEGMENT TO HOLD LARGEST CAGR DURING FORECAST PERIOD
    FIGURE 9 HARDWARE SEGMENT TO ACCOUNT FOR LARGEST MARKET SIZE IN 2023
    FIGURE 10 AIRPORTS SEGMENT TO DOMINATE AUTOMATED BORDER CONTROL MARKET IN 2023
    FIGURE 11 EUROPEAN AUTOMATED BORDER CONTROL MARKET TO HOLD LARGEST MARKET SHARE IN 2023
 
4 PREMIUM INSIGHTS (Page No. - 49)
    4.1 ATTRACTIVE GROWTH OPPORTUNITIES IN AUTOMATED BORDER CONTROL MARKET 
           FIGURE 12 RISING NUMBER OF INTERNATIONAL TRAVELERS TO DRIVE IMPLEMENTATION OF AUTOMATED BORDER CONTROL SYSTEMS
    4.2 AUTOMATED BORDER CONTROL MARKET, BY TYPE 
           FIGURE 13 ABC E-GATES SEGMENT TO HOLD LARGEST MARKET SHARE IN 2023
    4.3 AUTOMATED BORDER CONTROL MARKET, BY COMPONENT 
           FIGURE 14 HARDWARE SEGMENT TO ACCOUNT FOR HIGHEST CAGR DURING FORECAST PERIOD
    4.4 AUTOMATED BORDER CONTROL MARKET, BY APPLICATION 
           FIGURE 15 AIRPORTS SEGMENT TO DOMINATE AUTOMATED BORDER CONTROL MARKET IN 2023
    4.5 AUTOMATED BORDER CONTROL MARKET, BY REGION 
           FIGURE 16 ASIA PACIFIC TO POSSESS HIGHEST CAGR DURING STUDY PERIOD
 
5 MARKET OVERVIEW (Page No. - 52)
    5.1 INTRODUCTION 
    5.2 MARKET DYNAMICS 
           FIGURE 17 AUTOMATED BORDER CONTROL MARKET DYNAMICS
           5.2.1 DRIVERS
                    5.2.1.1 Increasing number of international passengers traveling across borders
                    5.2.1.2 Growing security concerns at land ports, airports, and seaports
                               FIGURE 18 IMPACT OF DRIVERS ON AUTOMATED BORDER CONTROL MARKET
           5.2.2 RESTRAINTS
                    5.2.2.1 Lack of security standardization across different systems and countries
                    5.2.2.2 High initial implementation cost for automated border control systems
                               FIGURE 19 IMPACT OF RESTRAINTS ON AUTOMATED BORDER CONTROL MARKET
           5.2.3 OPPORTUNITIES
                    5.2.3.1 Growing implementation of digital ID verification systems by governments and transportation organizations
                    5.2.3.2 Rising integration of artificial intelligence in automated border control systems
                               FIGURE 20 IMPACT OF OPPORTUNITIES ON AUTOMATED BORDER CONTROL MARKET
           5.2.4 CHALLENGES
                    5.2.4.1 Rising risk of cyberattacks on automated border control systems in transportation industry
                               FIGURE 21 IMPACT OF CHALLENGES ON AUTOMATED BORDER CONTROL MARKET
    5.3 VALUE CHAIN ANALYSIS 
           FIGURE 22 AUTOMATED BORDER CONTROL MARKET: VALUE CHAIN ANALYSIS
    5.4 ECOSYSTEM ANALYSIS 
           FIGURE 23 AUTOMATED BORDER CONTROL MARKET: ECOSYSTEM ANALYSIS
           TABLE 2 AUTOMATED BORDER CONTROL MARKET: ECOSYSTEM ANALYSIS
    5.5 PRICING ANALYSIS 
           TABLE 3 AVERAGE SELLING PRICE OF AUTOMATED BORDER CONTROL SYSTEMS, BY SOLUTION TYPE (USD)
    5.6 TRENDS/DISRUPTIONS IMPACTING CUSTOMERS’ BUSINESSES 
           FIGURE 24 TRENDS/DISRUPTIONS IMPACTING CUSTOMERS’ BUSINESSES
    5.7 TECHNOLOGY ANALYSIS 
           5.7.1 ARTIFICIAL INTELLIGENCE
           5.7.2 INTERNET OF THINGS
           5.7.3 BLOCKCHAIN TECHNOLOGY
    5.8 PORTER’S FIVE FORCES ANALYSIS 
           FIGURE 25 AUTOMATED BORDER CONTROL MARKET: PORTER’S FIVE FORCES ANALYSIS (2022)
           5.8.1 BARGAINING POWER OF SUPPLIERS
           5.8.2 BARGAINING POWER OF BUYERS
           5.8.3 THREAT OF NEW ENTRANTS
           5.8.4 THREAT OF SUBSTITUTES
           5.8.5 INTENSITY OF COMPETITIVE RIVALRY
    5.9 KEY STAKEHOLDERS AND BUYING CRITERIA 
           5.9.1 KEY STAKEHOLDERS IN BUYING PROCESS
                    FIGURE 26 INFLUENCE OF STAKEHOLDERS ON BUYING PROCESS FOR TOP THREE APPLICATIONS
                    TABLE 4 INFLUENCE OF STAKEHOLDERS ON BUYING PROCESS FOR TOP THREE APPLICATIONS (%)
           5.9.2 BUYING CRITERIA
                    FIGURE 27 KEY BUYING CRITERIA FOR TOP THREE APPLICATIONS
                    TABLE 5 KEY BUYING CRITERIA FOR TOP 3 APPLICATIONS
    5.10 CASE STUDY ANALYSIS 
           5.10.1 M2SYS TECHNOLOGY PROVIDED BIOMETRIC FINGERPRINT IDENTIFICATION TECHNOLOGY TO SULAYMANIYAH PROVINCE
           5.10.2 IDEMIA PROVIDED MULTI-BIOMETRIC ENTRY/EXIT SYSTEM TO FIVE INTERNATIONAL AIRPORTS IN UAE
           5.10.3 SITA TO PROVIDE E-GATES FOR PHILADELPHIA INTERNATIONAL AIRPORT
    5.11 TRADE ANALYSIS 
           FIGURE 28 IMPORT DATA FOR HS CODE 8471, BY KEY COUNTRY, 2017–2021 (USD MILLION)
           FIGURE 29 EXPORT DATA FOR HS CODE 8471, BY KEY COUNTRY, 2017–2021 (USD MILLION)
    5.12 PATENT ANALYSIS 
           FIGURE 30 TOP 10 COMPANIES WITH HIGHEST NUMBER OF PATENT APPLICATIONS IN LAST 10 YEARS
           FIGURE 31 NUMBER OF PATENTS GRANTED PER YEAR, 2013–2022
           TABLE 6 TOP 20 PATENT OWNERS IN LAST 10 YEARS
           TABLE 7 LIST OF MAJOR PATENTS (2020–2022)
    5.13 KEY CONFERENCES AND EVENTS, 2023–2024 
           TABLE 8 AUTOMATED BORDER CONTROL MARKET: DETAILED LIST OF KEY CONFERENCES AND EVENTS (2023–2024)
    5.14 TARIFF AND REGULATORY LANDSCAPE 
           5.14.1 REGULATORY BODIES, GOVERNMENT AGENCIES, AND OTHER ORGANIZATIONS
                    TABLE 9 NORTH AMERICA: LIST OF REGULATORY BODIES, GOVERNMENT AGENCIES, AND OTHER ORGANIZATIONS
                    TABLE 10 EUROPE: LIST OF REGULATORY BODIES, GOVERNMENT AGENCIES, AND OTHER ORGANIZATIONS
                    TABLE 11 ASIA PACIFIC: LIST OF REGULATORY BODIES, GOVERNMENT AGENCIES, AND OTHER ORGANIZATIONS
                    TABLE 12 REST OF THE WORLD: LIST OF REGULATORY BODIES, GOVERNMENT AGENCIES, AND OTHER ORGANIZATIONS
           5.14.2 MARKET REGULATION AND STANDARDS
                    TABLE 13 REGULATIONS AND STANDARDS FOR AUTOMATED BORDER CONTROL MARKET
 
6 AUTOMATED BORDER CONTROL MARKET, BY BORDER CROSSING PROCEDURE TYPE (Page No. - 79)
    6.1 INTRODUCTION 
           FIGURE 32 AUTOMATED BORDER CONTROL MARKET, BY BORDER CROSSING PROCEDURE TYPE
    6.2 ONE-STEP PROCESS 
           6.2.1 ONE-STEP PROCESS TO VERIFY DOCUMENTS, IDENTITY, AND AUTHORIZATION OF TRAVELERS SIMULTANEOUSLY AT E-GATES
    6.3 INTEGRATED TWO-STEP PROCESS 
           6.3.1 INTEGRATED TWO-STEP PROCESS TO BE HIGHLY EFFICIENT AS COMPARED TO TRADITIONAL MANUAL CHECKS
    6.4 SEGREGATED TWO-STEP PROCESS 
           6.4.1 SEGREGATED TWO-STEP PROCESS TO EFFECTIVELY OPTIMIZE FLOW OF PASSENGERS
 
7 AUTOMATED BORDER CONTROL MARKET, BY SOLUTION TYPE (Page No. - 81)
    7.1 INTRODUCTION 
           FIGURE 33 AUTOMATED BORDER CONTROL MARKET, BY SOLUTION TYPE
           FIGURE 34 ABC E-GATES DOMINATED THE MARKET IN 2023
           TABLE 14 AUTOMATED BORDER CONTROL MARKET, BY SOLUTION TYPE, 2019–2022 (USD MILLION)
           TABLE 15 AUTOMATED BORDER CONTROL MARKET, BY SOLUTION TYPE, 2023–2028 (USD MILLION)
    7.2 ABC E-GATES 
           7.2.1 RISING ADOPTION OF ABC E-GATES AT AIRPORTS FOR GREATER SECURITY TO DRIVE MARKET
                    7.2.1.1 Automated boarding e-gates
                    7.2.1.2 Security checkpoint e-gates
                               TABLE 16 AUTOMATED BORDER CONTROL MARKET FOR ABC E-GATES, BY APPLICATION, 2019–2022 (USD MILLION)
                               TABLE 17 AUTOMATED BORDER CONTROL MARKET FOR ABC E-GATES, BY APPLICATION, 2023–2028 (USD MILLION)
                               TABLE 18 AUTOMATED BORDER CONTROL MARKET FOR ABC E-GATES, BY REGION, 2019–2022 (USD MILLION)
                               TABLE 19 AUTOMATED BORDER CONTROL MARKET FOR ABC E-GATES, BY REGION, 2023–2028 (USD MILLION)
                               TABLE 20 NORTH AMERICA: AUTOMATED BORDER CONTROL MARKET FOR ABC E-GATES, BY COUNTRY, 2019–2022 (USD MILLION)
                               TABLE 21 NORTH AMERICA: AUTOMATED BORDER CONTROL MARKET FOR ABC E-GATES, BY COUNTRY, 2023–2028 (USD MILLION)
                               TABLE 22 EUROPE: AUTOMATED BORDER CONTROL MARKET FOR ABC E-GATES, BY COUNTRY, 2019–2022 (USD MILLION)
                               TABLE 23 EUROPE: AUTOMATED BORDER CONTROL MARKET FOR ABC E-GATES, BY COUNTRY, 2023–2028 (USD MILLION)
                               TABLE 24 ASIA PACIFIC: AUTOMATED BORDER CONTROL MARKET FOR ABC E-GATES, BY COUNTRY, 2019–2022 (USD MILLION)
                               TABLE 25 ASIA PACIFIC: AUTOMATED BORDER CONTROL MARKET FOR ABC E-GATES, BY COUNTRY, 2023–2028 (USD MILLION)
                               TABLE 26 REST OF THE WORLD: AUTOMATED BORDER CONTROL MARKET FOR ABC E-GATES, BY COUNTRY, 2019–2022 (USD MILLION)
                               TABLE 27 REST OF THE WORLD: AUTOMATED BORDER CONTROL MARKET FOR ABC E-GATES, BY COUNTRY, 2023–2028 (USD MILLION)
    7.3 ABC KIOSKS 
           7.3.1 FAST, EFFICIENT, AND SECURE PROCESSES FOR PASSENGERS AND BORDER CONTROL AUTHORITIES TO PROPEL MARKET
                    TABLE 28 AUTOMATED BORDER CONTROL MARKET FOR ABC KIOSKS, BY APPLICATION, 2019–2022 (USD MILLION)
                    TABLE 29 AUTOMATED BORDER CONTROL MARKET FOR ABC KIOSKS, BY APPLICATION, 2023–2028 (USD MILLION)
                    TABLE 30 AUTOMATED BORDER CONTROL MARKET FOR ABC KIOSKS, BY REGION, 2019–2022 (USD MILLION)
                    TABLE 31 AUTOMATED BORDER CONTROL MARKET FOR ABC KIOSKS, BY REGION, 2023–2028 (USD MILLION)
                    TABLE 32 NORTH AMERICA: AUTOMATED BORDER CONTROL MARKET FOR ABC KIOSKS, BY COUNTRY, 2019–2022 (USD MILLION)
                    TABLE 33 NORTH AMERICA: AUTOMATED BORDER CONTROL MARKET FOR ABC KIOSKS, BY COUNTRY, 2023–2028 (USD MILLION)
                    TABLE 34 EUROPE: AUTOMATED BORDER CONTROL MARKET FOR ABC KIOSKS, BY COUNTRY, 2019–2022 (USD MILLION)
                    TABLE 35 EUROPE: AUTOMATED BORDER CONTROL MARKET FOR ABC KIOSKS, BY COUNTRY, 2023–2028 (USD MILLION)
                    TABLE 36 ASIA PACIFIC: AUTOMATED BORDER CONTROL MARKET FOR ABC KIOSKS, BY COUNTRY, 2019–2022 (USD MILLION)
                    TABLE 37 ASIA PACIFIC: AUTOMATED BORDER CONTROL MARKET FOR ABC KIOSKS, BY COUNTRY, 2023–2028 (USD MILLION)
                    TABLE 38 REST OF THE WORLD: AUTOMATED BORDER CONTROL MARKET FOR ABC KIOSKS, BY COUNTRY, 2019–2022 (USD MILLION)
                    TABLE 39 REST OF THE WORLD: AUTOMATED BORDER CONTROL MARKET FOR ABC KIOSKS, BY COUNTRY, 2023–2028 (USD MILLION)
 
8 AUTOMATED BORDER CONTROL MARKET, BY COMPONENT (Page No. - 93)
    8.1 INTRODUCTION 
           FIGURE 35 AUTOMATED BORDER CONTROL MARKET, BY COMPONENT
           FIGURE 36 HARDWARE SEGMENT TO DOMINATE AUTOMATED BORDER CONTROL MARKET IN 2023
           TABLE 40 AUTOMATED BORDER CONTROL MARKET, BY COMPONENT, 2019–2022 (USD MILLION)
           TABLE 41 AUTOMATED BORDER CONTROL MARKET, BY COMPONENT, 2023–2028 (USD MILLION)
    8.2 HARDWARE 
           8.2.1 RISING DEMAND FOR ENHANCED BORDER SECURITY TO BOOST SEGMENT
                    8.2.1.1 Document authentication system
                               8.2.1.1.1 Optical character recognition
                               8.2.1.1.2 Barcode reader
                               8.2.1.1.3 Signature scanner
                    8.2.1.2 Biometric verification system
                               8.2.1.2.1 Face recognition
                               8.2.1.2.2 Fingerprint recognition
                               8.2.1.2.3 Iris recognition
                               8.2.1.2.4 Other biometric verification systems
                    8.2.1.3 Baggage scanner
                               8.2.1.3.1 RFID tags
                    8.2.1.4 Digital ID verification
                               TABLE 42 AUTOMATED BORDER CONTROL MARKET FOR HARDWARE, BY TYPE, 2019–2022 (USD MILLION)
                               TABLE 43 AUTOMATED BORDER CONTROL MARKET FOR HARDWARE, BY TYPE, 2023–2028 (USD MILLION)
                               TABLE 44 BIOMETRIC VERIFICATION SYSTEMS MARKET, BY TYPE, 2019–2022 (USD MILLION)
                               TABLE 45 BIOMETRIC VERIFICATION SYSTEMS MARKET, BY TYPE, 2023–2028 (USD MILLION)
    8.3 SOFTWARE 
           8.3.1 DEVELOPMENT OF SOFTWARE TO INTEGRATE AND UTILIZE BIOMETRIC TECHNOLOGIES WITH AUTOMATED BORDER CONTROL SYSTEMS
    8.4 SERVICES 
           8.4.1 SERVICES TO ENSURE SUCCESSFUL INSTALLATION AND MAINTENANCE OF AUTOMATED BORDER CONTROL SYSTEMS
                    8.4.1.1 Installation
                    8.4.1.2 Maintenance
                               TABLE 46 AUTOMATED BORDER CONTROL MARKET FOR SERVICES, BY TYPE, 2019–2022 (USD MILLION)
                               TABLE 47 AUTOMATED BORDER CONTROL MARKET FOR SERVICES, BY TYPE, 2023–2028 (USD MILLION)
 
9 AUTOMATED BORDER CONTROL MARKET, BY APPLICATION (Page No. - 105)
    9.1 INTRODUCTION 
           FIGURE 37 AUTOMATED BORDER CONTROL MARKET, BY APPLICATION
           FIGURE 38 AIRPORTS TO RECORD HIGHEST CAGR IN AUTOMATED BORDER CONTROL MARKET DURING FORECAST PERIOD
           TABLE 48 AUTOMATED BORDER CONTROL MARKET, BY APPLICATION, 2019–2022 (USD MILLION)
           TABLE 49 AUTOMATED BORDER CONTROL MARKET, BY APPLICATION, 2023–2028 (USD MILLION)
    9.2 AIRPORTS 
           9.2.1 RISING NUMBER OF INTERNATIONAL TRAVELERS TO INCREASE DEPLOYMENT OF AUTOMATED BORDER CONTROL SYSTEMS
                    TABLE 50 AUTOMATED BORDER CONTROL MARKET FOR AIRPORTS, BY REGION, 2019–2022 (USD MILLION)
                    TABLE 51 AUTOMATED BORDER CONTROL MARKET FOR AIRPORTS, BY REGION, 2023–2028 (USD MILLION)
    9.3 SEAPORTS 
           9.3.1 AUTOMATED BORDER CONTROL SYSTEMS TO ENHANCE SECURITY, STREAMLINE OPERATIONS, AND FACILITATE MOVEMENT OF GOODS AND PASSENGERS
                    TABLE 52 AUTOMATED BORDER CONTROL MARKET FOR SEAPORTS, BY REGION, 2019–2022 (USD MILLION)
                    TABLE 53 AUTOMATED BORDER CONTROL MARKET FOR SEAPORTS, BY REGION, 2023–2028 (USD MILLION)
    9.4 LAND PORTS 
           9.4.1 DEPLOYMENT OF AUTOMATED BORDER CONTROL SYSTEMS AT LAND CHECKPOINTS TO ENHANCE BORDER-CROSSING PROCESSES
                    TABLE 54 AUTOMATED BORDER CONTROL MARKET FOR LAND PORTS, BY REGION, 2019–2022 (USD MILLION)
                    TABLE 55 AUTOMATED BORDER CONTROL MARKET FOR LAND PORTS, BY REGION, 2023–2028 (USD MILLION)
 
10 AUTOMATED BORDER CONTROL MARKET, BY REGION (Page No. - 112)
     10.1 INTRODUCTION 
             FIGURE 39 AUTOMATED BORDER CONTROL MARKET, BY REGION
             FIGURE 40 GEOGRAPHICAL SNAPSHOT FOR AUTOMATED BORDER CONTROL MARKET
             TABLE 56 AUTOMATED BORDER CONTROL MARKET, BY REGION, 2019–2022 (USD MILLION)
             TABLE 57 AUTOMATED BORDER CONTROL MARKET, BY REGION, 2023–2028 (USD MILLION)
     10.2 NORTH AMERICA 
             10.2.1 NORTH AMERICA: IMPACT OF ECONOMIC RECESSION
                        FIGURE 41 NORTH AMERICA: AUTOMATED BORDER CONTROL MARKET SNAPSHOT
                        FIGURE 42 US TO DOMINATE NORTH AMERICAN AUTOMATED BORDER CONTROL MARKET IN 2023
                        TABLE 58 NORTH AMERICA: AUTOMATED BORDER CONTROL MARKET, BY COUNTRY, 2019–2022 (USD MILLION)
                        TABLE 59 NORTH AMERICA: AUTOMATED BORDER CONTROL MARKET, BY COUNTRY, 2023–2028 (USD MILLION)
                        TABLE 60 NORTH AMERICA: AUTOMATED BORDER CONTROL MARKET, BY APPLICATION, 2019–2022 (USD MILLION)
                        TABLE 61 NORTH AMERICA: AUTOMATED BORDER CONTROL MARKET, BY APPLICATION, 2023–2028 (USD MILLION)
                        TABLE 62 NORTH AMERICA: AUTOMATED BORDER CONTROL MARKET, BY SOLUTION TYPE, 2019–2022 (USD MILLION)
                        TABLE 63 NORTH AMERICA: AUTOMATED BORDER CONTROL MARKET, BY SOLUTION TYPE, 2023–2028 (USD MILLION)
             10.2.2 US
                        10.2.2.1 US dominated North American automated border control market in 2022
                                     TABLE 64 US: AUTOMATED BORDER CONTROL MARKET, BY SOLUTION TYPE, 2019–2022 (USD MILLION)
                                     TABLE 65 US: AUTOMATED BORDER CONTROL MARKET, BY SOLUTION TYPE, 2023–2028 (USD MILLION)
             10.2.3 CANADA
                        10.2.3.1 Increasing deployment of e-Gates at Canadian airports to propel market
                                     TABLE 66 CANADA: AUTOMATED BORDER CONTROL MARKET, BY SOLUTION TYPE, 2019–2022 (USD MILLION)
                                     TABLE 67 CANADA: AUTOMATED BORDER CONTROL MARKET, BY SOLUTION TYPE, 2023–2028 (USD MILLION)
             10.2.4 MEXICO
                        10.2.4.1 Substantial increase in border traffic to drive market
                                     TABLE 68 MEXICO: AUTOMATED BORDER CONTROL MARKET, BY SOLUTION TYPE, 2019–2022 (USD MILLION)
                                     TABLE 69 MEXICO: AUTOMATED BORDER CONTROL MARKET, BY SOLUTION TYPE, 2023–2028 (USD MILLION)
     10.3 EUROPE 
             10.3.1 EUROPE: IMPACT OF ECONOMIC RECESSION
                        FIGURE 43 EUROPE: AUTOMATED BORDER CONTROL MARKET SNAPSHOT
                        FIGURE 44 GERMANY TO DOMINATE EUROPEAN AUTOMATED BORDER CONTROL MARKET IN 2023
                        TABLE 70 EUROPE: AUTOMATED BORDER CONTROL, BY COUNTRY, 2019–2022 (USD MILLION)
                        TABLE 71 EUROPE: AUTOMATED BORDER CONTROL, BY COUNTRY, 2023–2028 (USD MILLION)
                        TABLE 72 EUROPE: AUTOMATED BORDER CONTROL MARKET, BY APPLICATION, 2019–2022 (USD MILLION)
                        TABLE 73 EUROPE: AUTOMATED BORDER CONTROL MARKET, BY APPLICATION, 2023–2028 (USD MILLION)
                        TABLE 74 EUROPE: AUTOMATED BORDER CONTROL MARKET, BY SOLUTION TYPE, 2019–2022 (USD MILLION)
                        TABLE 75 EUROPE: AUTOMATED BORDER CONTROL MARKET, BY SOLUTION TYPE, 2023–2028 (USD MILLION)
             10.3.2 GERMANY
                        10.3.2.1 Deployment of automated border control systems at various ports to fuel market
                                     TABLE 76 GERMANY: AUTOMATED BORDER CONTROL MARKET, BY SOLUTION TYPE, 2019–2022 (USD MILLION)
                                     TABLE 77 GERMANY: AUTOMATED BORDER CONTROL MARKET, BY SOLUTION TYPE, 2023–2028 (USD MILLION)
             10.3.3 UK
                        10.3.3.1 UK held second-largest share of automated border control market in 2022
                                     TABLE 78 UK: AUTOMATED BORDER CONTROL MARKET, BY SOLUTION TYPE, 2019–2022 (USD MILLION)
                                     TABLE 79 UK: AUTOMATED BORDER CONTROL MARKET, BY SOLUTION TYPE, 2023–2028 (USD MILLION)
             10.3.4 FRANCE
                        10.3.4.1 Passport verification program by Government of France to increase deployment of e-Gates
                                     TABLE 80 FRANCE: AUTOMATED BORDER CONTROL MARKET, BY SOLUTION TYPE, 2019–2022 (USD MILLION)
                                     TABLE 81 FRANCE: AUTOMATED BORDER CONTROL MARKET, BY SOLUTION TYPE, 2023–2028 (USD MILLION)
             10.3.5 ITALY
                        10.3.5.1 Increasing focus on strengthening border security due to growing irregular migrants to augment market
                                     TABLE 82 ITALY: AUTOMATED BORDER CONTROL MARKET, BY SOLUTION TYPE, 2019–2022 (USD MILLION)
                                     TABLE 83 ITALY: AUTOMATED BORDER CONTROL MARKET, BY SOLUTION TYPE, 2023–2028 (USD MILLION)
             10.3.6 REST OF EUROPE
                        TABLE 84 REST OF EUROPE: AUTOMATED BORDER CONTROL MARKET, BY SOLUTION TYPE, 2019–2022 (USD MILLION)
                        TABLE 85 REST OF EUROPE: AUTOMATED BORDER CONTROL MARKET, BY SOLUTION TYPE, 2023–2028 (USD MILLION)
     10.4 ASIA PACIFIC 
             10.4.1 ASIA PACIFIC: IMPACT OF ECONOMIC RECESSION
                        FIGURE 45 APAC PACIFIC: AUTOMATED BORDER CONTROL MARKET SNAPSHOT
                        FIGURE 46 INDIA TO ACCOUNT FOR LARGEST CAGR OF ASIA PACIFIC AUTOMATED BORDER CONTROL MARKET DURING STUDY PERIOD
                        TABLE 86 ASIA PACIFIC: AUTOMATED BORDER CONTROL MARKET, BY COUNTRY, 2019–2022 (USD MILLION)
                        TABLE 87 ASIA PACIFIC: AUTOMATED BORDER CONTROL MARKET, BY COUNTRY, 2023–2028 (USD MILLION)
                        TABLE 88 ASIA PACIFIC: AUTOMATED BORDER CONTROL MARKET, BY APPLICATION, 2019–2022 (USD MILLION)
                        TABLE 89 ASIA PACIFIC: AUTOMATED BORDER CONTROL MARKET, BY APPLICATION, 2023–2028 (USD MILLION)
                        TABLE 90 ASIA PACIFIC: AUTOMATED BORDER CONTROL MARKET, BY SOLUTION TYPE, 2019–2022 (USD MILLION)
                        TABLE 91 ASIA PACIFIC: AUTOMATED BORDER CONTROL MARKET, BY SOLUTION TYPE, 2023–2028 (USD MILLION)
             10.4.2 CHINA
                        10.4.2.1 Increasing implementation of facial recognition technology to drive market
                                     TABLE 92 CHINA: AUTOMATED BORDER CONTROL MARKET, BY SOLUTION TYPE, 2019–2022 (USD MILLION)
                                     TABLE 93 CHINA: AUTOMATED BORDER CONTROL MARKET, BY SOLUTION TYPE, 2023–2028 (USD MILLION)
             10.4.3 JAPAN
                        10.4.3.1 Increased commitment toward security improvement and overall travel experience for both residents and visitors to boost market
                                     TABLE 94 JAPAN: AUTOMATED BORDER CONTROL MARKET, BY SOLUTION TYPE, 2019–2022 (USD MILLION)
                                     TABLE 95 JAPAN: AUTOMATED BORDER CONTROL MARKET, BY SOLUTION TYPE, 2023–2028 (USD MILLION)
             10.4.4 AUSTRALIA
                        10.4.4.1 Investment in SmartGates for border security and efficient immigration process to augment market
                                     TABLE 96 AUSTRALIA: AUTOMATED BORDER CONTROL MARKET, BY SOLUTION TYPE, 2019–2022 (USD MILLION)
                                     TABLE 97 AUSTRALIA: AUTOMATED BORDER CONTROL MARKET, BY SOLUTION TYPE, 2023–2028 (USD MILLION)
             10.4.5 INDIA
                        10.4.5.1 Growing adoption of automated border control systems at various airports to aid market growth
                                     TABLE 98 INDIA: AUTOMATED BORDER CONTROL MARKET, BY SOLUTION TYPE, 2019–2022 (USD MILLION)
                                     TABLE 99 INDIA: AUTOMATED BORDER CONTROL MARKET, BY SOLUTION TYPE, 2023–2028 (USD MILLION)
             10.4.6 REST OF ASIA PACIFIC
                        TABLE 100 REST OF ASIA PACIFIC: AUTOMATED BORDER CONTROL MARKET, BY SOLUTION TYPE, 2019–2022 (USD MILLION)
                        TABLE 101 REST OF ASIA PACIFIC: AUTOMATED BORDER CONTROL MARKET, BY SOLUTION TYPE, 2023–2028 (USD MILLION)
     10.5 REST OF THE WORLD 
             10.5.1 REST OF THE WORLD: IMPACT OF ECONOMIC RECESSION
                        FIGURE 47 MIDDLE EAST & AFRICA TO DOMINATE AUTOMATED BORDER CONTROL MARKET FOR REST OF THE WORLD SEGMENT IN 2023
                        TABLE 102 REST OF THE WORLD: AUTOMATED BORDER CONTROL MARKET, BY REGION, 2019–2022 (USD MILLION)
                        TABLE 103 REST OF THE WORLD: AUTOMATED BORDER CONTROL MARKET, BY REGION, 2023–2028 (USD MILLION)
                        TABLE 104 REST OF THE WORLD: AUTOMATED BORDER CONTROL MARKET, BY APPLICATION, 2019–2022 (USD MILLION)
                        TABLE 105 REST OF THE WORLD: AUTOMATED BORDER CONTROL MARKET, BY APPLICATION, 2023–2028 (USD MILLION)
                        TABLE 106 REST OF THE WORLD: AUTOMATED BORDER CONTROL MARKET, BY SOLUTION TYPE, 2019–2022 (USD MILLION)
                        TABLE 107 REST OF THE WORLD: AUTOMATED BORDER CONTROL MARKET, BY SOLUTION TYPE, 2023–2028 (USD MILLION)
             10.5.2 MIDDLE EAST AND AFRICA
                        10.5.2.1 Increase in number of high-profile events, summits, and global conferences in UAE to fuel market
                                     TABLE 108 MIDDLE EAST & AFRICA: AUTOMATED BORDER CONTROL MARKET, BY SOLUTION TYPE, 2019–2022 (USD MILLION)
                                     TABLE 109 MIDDLE EAST & AFRICA: AUTOMATED BORDER CONTROL MARKET, BY SOLUTION TYPE, 2023–2028 (USD MILLION)
             10.5.3 SOUTH AMERICA
                        10.5.3.1 Increasing installation of automated border control systems at entry points to expedite entry and exit processes
                                     TABLE 110 SOUTH AMERICA: AUTOMATED BORDER CONTROL MARKET, BY SOLUTION TYPE, 2019–2022 (USD MILLION)
                                     TABLE 111 SOUTH AMERICA: AUTOMATED BORDER CONTROL MARKET, BY SOLUTION TYPE, 2023–2028 (USD MILLION)
 
11 COMPETITIVE LANDSCAPE (Page No. - 146)
     11.1 INTRODUCTION 
             TABLE 112 KEY DEVELOPMENTS IN AUTOMATED BORDER CONTROL MARKET (2019–2023)
     11.2 REVENUE ANALYSIS OF KEY COMPANIES 
             FIGURE 48 AUTOMATED BORDER CONTROL MARKET: REVENUE ANALYSIS FOR KEY COMPANIES (2021)
     11.3 MARKET SHARE ANALYSIS OF TOP PLAYERS, 2022 
             FIGURE 49 SHARE OF KEY PLAYERS IN AUTOMATED BORDER CONTROL MARKET (2022)
             TABLE 113 AUTOMATED BORDER CONTROL MARKET: DEGREE OF COMPETITION
     11.4 COMPANY EVALUATION QUADRANT FOR KEY PLAYERS, 2022 
             11.4.1 STARS
             11.4.2 EMERGING LEADERS
             11.4.3 PERVASIVE PLAYERS
             11.4.4 PARTICIPANTS
                        FIGURE 50 AUTOMATED BORDER CONTROL MARKET: COMPANY EVALUATION QUADRANT FOR KEY PLAYERS, 2022
     11.5 COMPANY EVALUATION QUADRANT FOR START-UPS/SMES, 2022 
             11.5.1 PROGRESSIVE COMPANIES
             11.5.2 RESPONSIVE COMPANIES
             11.5.3 DYNAMIC COMPANIES
             11.5.4 STARTING BLOCKS
                        FIGURE 51 AUTOMATED BORDER CONTROL MARKET: COMPANY EVALUATION QUADRANT FOR START-UPS/SMES, 2022
     11.6 AUTOMATED BORDER CONTROL MARKET: COMPANY FOOTPRINT 
             TABLE 114 COMPANY FOOTPRINT, BY SOLUTION TYPE
             TABLE 115 COMPANY FOOTPRINT, BY APPLICATION
             TABLE 116 COMPANY FOOTPRINT, BY REGION
             TABLE 117 OVERALL COMPANY FOOTPRINT
     11.7 COMPETITIVE BENCHMARKING 
             TABLE 118 AUTOMATED BORDER CONTROL MARKET: DETAILED LIST OF KEY START-UPS/SMES
             TABLE 119 AUTOMATED BORDER CONTROL MARKET: COMPETITIVE BENCHMARKING OF KEY START-UPS/SMES
     11.8 COMPETITIVE SCENARIO AND TRENDS 
             11.8.1 KEY PRODUCT LAUNCHES AND DEVELOPMENTS
                        TABLE 120 AUTOMATED BORDER CONTROL MARKET: KEY PRODUCT LAUNCHES AND DEVELOPMENTS, JUNE 2022–MARCH 2023
             11.8.2 KEY DEALS
                        TABLE 121 AUTOMATED BORDER CONTROL MARKET: KEY DEALS, FEBRUARY 2019–MARCH 2023
 
12 COMPANY PROFILES (Page No. - 165)
     12.1 KEY PLAYERS 
(Business Overview, Products/Services/Solutions Offered, Recent Developments and MnM View)*  
             12.1.1 VISION-BOX
                        TABLE 122 VISION-BOX: COMPANY OVERVIEW
                        TABLE 123 VISION-BOX: PRODUCTS/SERVICES/SOLUTIONS OFFERED
             12.1.2 SITA
                        TABLE 124 SITA: COMPANY OVERVIEW
                        TABLE 125 SITA: PRODUCTS/SERVICES/SOLUTIONS OFFERED
             12.1.3 SECUNET SECURITY NETWORKS AG
                        TABLE 126 SECUNET SECURITY NETWORKS AG: COMPANY OVERVIEW
                        FIGURE 52 SECUNET SECURITY NETWORKS AG: COMPANY SNAPSHOT
                        TABLE 127 SECUNET SECURITY NETWORKS AG: PRODUCTS/SERVICES/SOLUTIONS OFFERED
             12.1.4 IDEMIA
                        TABLE 128 IDEMIA: COMPANY OVERVIEW
                        FIGURE 53 IDEMIA: COMPANY SNAPSHOT
                        TABLE 129 IDEMIA: PRODUCTS/SERVICES/SOLUTIONS OFFERED
             12.1.5 THALES
                        TABLE 130 THALES: COMPANY OVERVIEW
                        FIGURE 54 THALES: COMPANY SNAPSHOT
                        TABLE 131 THALES: PRODUCTS/SERVICES/SOLUTIONS OFFERED
             12.1.6 NEC CORPORATION
                        TABLE 132 NEC CORPORATION: COMPANY OVERVIEW
                        FIGURE 55 NEC CORPORATION: COMPANY SNAPSHOT
                        TABLE 133 NEC CORPORATION: PRODUCTS/SERVICES/SOLUTIONS OFFERED
             12.1.7 INDRA SISTEMAS, S.A.
                        TABLE 134 INDRA SISTEMAS, S.A.: COMPANY OVERVIEW
                        FIGURE 56 INDRA SISTEMAS, S.A.: COMPANY SNAPSHOT
                        TABLE 135 INDRA SISTEMAS, S.A.: PRODUCTS/SERVICES/SOLUTIONS OFFERED
             12.1.8 GUNNEBO AB
                        TABLE 136 GUNNEBO AB: COMPANY OVERVIEW
                        FIGURE 57 GUNNEBO AB: COMPANY SNAPSHOT
                        TABLE 137 GUNNEBO AB: PRODUCTS/SERVICES/SOLUTIONS OFFERED
             12.1.9 HID GLOBAL CORPORATION
                        TABLE 138 HID GLOBAL CORPORATION: COMPANY OVERVIEW
                        TABLE 139 HID GLOBAL CORPORATION: PRODUCTS/SERVICES/SOLUTIONS OFFERED
             12.1.10 ATOS SE
                        TABLE 140 ATOS SE: COMPANY OVERVIEW
                        FIGURE 58 ATOS SE: COMPANY SNAPSHOT
                        TABLE 141 ATOS SE: PRODUCTS/SERVICES/SOLUTIONS OFFERED
             12.1.11 DORMAKABA GROUP
                        TABLE 142 DORMAKABA GROUP: COMPANY OVERVIEW
                        FIGURE 59 DORMAKABA GROUP: COMPANY SNAPSHOT
                        TABLE 143 DORMAKABA GROUP: PRODUCTS/SERVICES/SOLUTIONS OFFERED
             12.1.12 MORPHO DYS
                        TABLE 144 MORPHO DYS: COMPANY OVERVIEW
                        TABLE 145 MORPHO DYS: PRODUCTS/SERVICES/SOLUTIONS OFFERED
             12.1.13 UNISYS
                        TABLE 146 UNISYS: COMPANY OVERVIEW
                        FIGURE 60 UNISYS: COMPANY SNAPSHOT
                        TABLE 147 UNISYS: PRODUCTS/SERVICES/SOLUTIONS OFFERED
* Business Overview, Products/Services/Solutions Offered, Recent Developments and MnM View might not be captured in case of unlisted companies.  
     12.2 OTHER PLAYERS 
             12.2.1 BIOLINK SOLUTIONS
             12.2.2 BIOID
             12.2.3 COGNITEC SYSTEMS GMBH
             12.2.4 DERMALOG IDENTIFICATION SYSTEMS GMBH
             12.2.5 IER
             12.2.6 INTERNATIONAL SECURITY TECHNOLOGY LTD.
             12.2.7 M2SYS TECHNOLOGY
             12.2.8 MAGNETIC AUTOCONTROL GMBH
             12.2.9 MÜHLBAUER GROUP
             12.2.10 SECURIPORT
             12.2.11 VERIDOS GMBH
             12.2.12 ZETES
 
13 ADJACENT AND RELATED MARKETS (Page No. - 213)
     13.1 INTRODUCTION 
     13.2 RESEARCH LIMITATIONS OF ADJACENT MARKETS 
     13.3 ACCESS CONTROL MARKET, BY SYSTEM 
             13.3.1 INTRODUCTION
             13.3.2 ACCESS CONTROL AS A SERVICE
                        TABLE 148 ACCESS CONTROL AS A SERVICE MARKET, BY TYPE, 2019–2022 (USD MILLION)
                        TABLE 149 ACCESS CONTROL AS A SERVICE MARKET, BY TYPE, 2023–2028 (USD MILLION)
                        TABLE 150 ACCESS CONTROL AS A SERVICE MARKET, BY VERTICAL, 2019–2022 (USD MILLION)
                        TABLE 151 ACCESS CONTROL AS A SERVICE MARKET, BY VERTICAL, 2023–2028 (USD MILLION)
                        TABLE 152 ACCESS CONTROL AS A SERVICE MARKET, BY REGION, 2019–2022 (USD MILLION)
                        TABLE 153 ACCESS CONTROL AS A SERVICE MARKET, BY REGION, 2023–2028 (USD MILLION)
     13.4 HOSTED ACAAS 
             13.4.1 QUICK, EASY, AND EFFICIENT ACCESS CONTROL TO DRIVE MARKET
                        TABLE 154 HOSTED ACCESS CONTROL AS A SERVICE MARKET, BY REGION, 2019–2022 (USD MILLION)
                        TABLE 155 HOSTED ACCESS CONTROL AS A SERVICE MARKET, BY REGION, 2023–2028 (USD MILLION)
     13.5 MANAGED ACAAS 
             13.5.1 INCREASED ACCEPTANCE OF CLOUD-BASED SERVICES TO CREATE LUCRATIVE OPPORTUNITIES FOR MANAGED ACAAS MARKET PLAYERS
                        TABLE 156 MANAGED ACCESS CONTROL AS A SERVICE MARKET, BY REGION, 2019–2022 (USD MILLION)
                        TABLE 157 MANAGED ACCESS CONTROL AS A SERVICE MARKET, BY REGION, 2023–2028 (USD MILLION)
     13.6 HYBRID ACAAS 
             13.6.1 INCREASED FLEXIBILITY, SCALABILITY, AND COST-SAVINGS TO FUEL MARKET
                        TABLE 158 HYBRID ACCESS CONTROL AS A SERVICE MARKET, BY REGION, 2019–2022 (USD MILLION)
                        TABLE 159 HYBRID ACCESS CONTROL AS A SERVICE MARKET, BY REGION, 2023–2028 (USD MILLION)
 
14 APPENDIX (Page No. - 221)
     14.1 INSIGHTS FROM INDUSTRY EXPERTS 
     14.2 DISCUSSION GUIDE 
     14.3 KNOWLEDGESTORE: MARKETSANDMARKETS’ SUBSCRIPTION PORTAL 
     14.4 CUSTOMIZATION OPTIONS 
     14.5 RELATED REPORTS 
     14.6 AUTHOR DETAILS 


The study involved four major activities in estimating the current size of the automated border control market. Exhaustive secondary research has been done to collect information on the market, peer market, and parent market. To validate these findings, assumptions, and sizing with industry experts across the value chain through primary research has been the next step. Both top-down and bottom-up approaches have been employed to estimate the complete market size. After that, market breakdown and data triangulation methods were used to estimate the market size of segments and subsegments.

Secondary Research

In the secondary research process, various secondary sources have been referred to identify and collect information important for the automated border control market study. Secondary sources include corporate filings (such as annual reports, investor presentations, and financial statements); trade, business, and professional associations; white papers and certified publications; articles from recognized authors; directories; and databases.

Secondary research was mainly conducted to obtain key information about the market value chain, the industry supply chain, the total pool of key players, market classification and segmentation according to industry trends to the bottom-most level, and key developments from both markets- and technology-oriented perspectives. Data from secondary research was collected and analyzed to arrive at the overall market size, which was further validated by primary research.

Primary Research

In the primary research process, various primary sources from both the supply and demand sides have been interviewed to obtain qualitative and quantitative information for this report. Primary sources from the supply side include industry experts, such as CEOs, VPs, marketing directors, technology and innovation directors, and related key executives from major companies and organizations operating in the automated border control market.
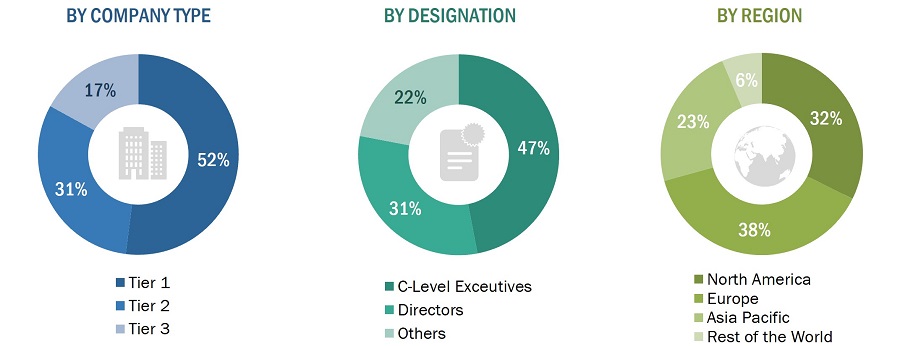
Automated Border Control Market Size, and Share

To know about the assumptions considered for the study, download the pdf brochure

Market Size Estimation

In this report, for the complete market engineering process, both top-down and bottom-up approaches were used, along with several data triangulation methods, to estimate, forecast, and validate the size of the market and its segments and subsegments listed in the report. Extensive qualitative and quantitative analyses were carried out to list the key information/insights pertaining to the automated border control market.

Automated Border Control Market: Bottom-Up Approach

  • Key players operating in the automated border control market have been identified through extensive secondary research.
  • The industry’s supply chain and market size, in terms of value, have been determined through primary and secondary research processes.
  • All percentage shares, splits, and breakdowns have been determined by using secondary sources and verified through primary sources.
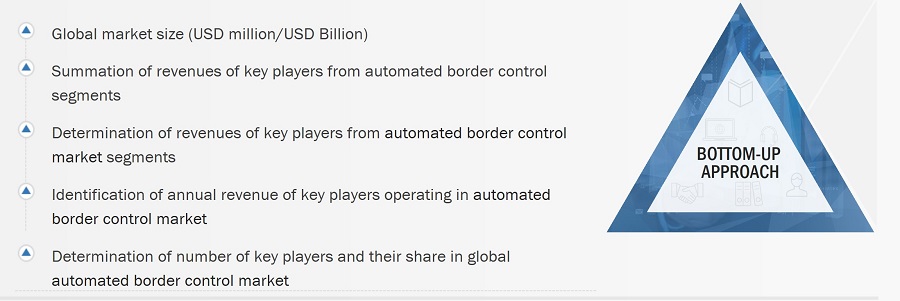
Automated Border Control Market Size, and Bottom-Up Approach

Automated Border Control Market: Top-Down Approach

  • Focusing on the top-line expenditures and investments made throughout the automated border control system ecosystem for installing new automated border control systems and retrofitting the existing ones.
  • Information related to revenues generated by the key developers and providers of automated border control systems has been studied and analyzed.
  • Multiple on-field discussions have been carried out with the key opinion leaders of the leading companies involved in developing automated border control systems.
  • The geographical split has been estimated using secondary sources based on various factors, such as the number of players in a specific country or region and the type of automated border control systems offered by these players.

Automated Border Control Market Size, and Top-Down Approach

Data Triangulation

After arriving at the overall automated border control market size-using the estimation processes explained above-the market has been split into several segments. To complete the overall market engineering process and arrive at the exact statistics of each market segment and subsegment, data triangulation and market breakdown procedures have been employed, wherever applicable. The data has been triangulated by studying various factors and trends in both the demand and supply sides of the automated border control market.

Market Definition

Automated Border Control (ABC) refers to the use of advanced technologies and automated systems at border checkpoints to facilitate the movement of people across national borders while ensuring border security. ABC systems often use biometric technologies, such as facial recognition and fingerprint scanning, to verify the identity of travelers and determine their eligibility to enter or exit a country. These systems are designed to improve border security by reducing the risk of human errors and fraudulent activities. They also streamline border control processes by allowing passengers to self-process their travel documents and identity verification, which can lead to faster processing times and reduced wait times at border checkpoints. ABC systems can be found at various points of entry, including airports, seaports, and land border crossings.

Key Stakeholders

  • Raw material and manufacturing equipment suppliers
  • Hardware and software manufacturers for automated border control
  • Original equipment manufacturers (OEMs) for card readers and biometrics
  • ODM and OEM technology solution providers
  • Suppliers and distributors
  • System integrators
  • Middleware providers
  • Assembly, testing, and packaging vendors
  • Research institutes and organizations
  • Technology standards organizations, forums, alliances, and associations
  • Technology investors
  • Governments, financial institutions, and regulatory bodies

Report Objectives:

  • To describe and forecast the automated border control market in terms of value based on solution type, component, and application.
  • To forecast the market size, in terms of value, for four main regions—North America, Europe, Asia Pacific (APAC), and the Rest of the World (RoW)
  • To provide detailed information regarding the drivers, restraints, opportunities, and challenges influencing the growth of the market
  • To provide a comprehensive overview of the value chain of the automated border control ecosystem
  • To strategically analyze micromarkets1 with respect to individual growth trends, prospects, and contributions to the total market.
  • To strategically profile key players and comprehensively analyze their market position in terms of ranking and core competencies2 and provide a detailed competitive landscape of the market.
  • To analyze opportunities in the market for stakeholders by identifying high-growth segments of automated border control.
  • To analyze competitive strategies, such as product launches and developments, collaborations, agreements, contracts, and partnerships, adopted by key market players in the automated border control market.
  • To analyze the probable impact of the recession on the market in the near future

Available Customizations

Based on the given market data, MarketsandMarkets offers customizations in the reports according to the client’s specific requirements. The available customization options are as follows:

Company Information

  • Detailed analysis and profiling of additional market players (up to 5)
Custom Market Research Services

We will customize the research for you, in case the report listed above does not meet with your exact requirements. Our custom research will comprehensively cover the business information you require to help you arrive at strategic and profitable business decisions.

Request Customization

Instant Answers with GPT - Ask Now!

Ask real questions. Get complete answers !
Report Code
SE 5525
Published ON
May, 2023
Choose License Type
BUY NOW
  • SHARE
X
Request Customization
Speak to Analyst
Speak to Analyst
OR FACE-TO-FACE MEETING
PERSONALIZE THIS RESEARCH
  • Triangulate with your Own Data
  • Get Data as per your Format and Definition
  • Gain a Deeper Dive on a Specific Application, Geography, Customer or Competitor
  • Any level of Personalization
REQUEST A FREE CUSTOMIZATION
LET US HELP YOU!
  • What are the Known and Unknown Adjacencies Impacting the Automated Border Control Market
  • What will your New Revenue Sources be?
  • Who will be your Top Customer; what will make them switch?
  • Defend your Market Share or Win Competitors
  • Get a Scorecard for Target Partners
CUSTOMIZED WORKSHOP REQUEST
+1-888-600-6441
  • Call Us
  • +1-888-600-6441 (Corporate office hours)
  • +1-888-600-6441 (US/Can toll free)
  • +44-800-368-9399 (UK office hours)
CONNECT WITH US
ABOUT TRUST ONLINE
©2024 MarketsandMarkets Research Private Ltd. All rights reserved
DMCA.com Protection Status Website Feedback