Automotive Powertrain Market by Position (FWD, RWD, & AWD), Vehicle Type (Passenger Car, LCV, & HCV), Engine Type (Gasoline & Diesel) & Geography (Asia-Oceania, Europe, North America, & ROW) - Industry Trends & Forecast to 2019


[141 Pages Report] The powertrain of any vehicle defines its performance, comfort, and safety. The engine and transmission are considered to be the major components of a powertrain, and other key components include the clutch/torque converter, drive shaft/propeller shaft, differential, and axles. Currently, gasoline powertrains are the most widely adopted, and are expected to be replaced by diesel ones as the difference between the prices of gasoline and diesel is increasing. As a result of this, powertrain system/components manufacturers have been adopting hybrid powertrains to reduce fuel usage in vehicles.
The major factors driving the demand for the passenger powertrain market are the rising demand for automated transmission and the growing trend of engine downsizing as it can reduce fuel consumption and emissions, at the same time providing the required performance of a larger engine. Increasing vehicle production is also one of driving factors for the growth of the automotive powertrain market.
This report classifies and defines the automotive powertrain market in terms of volume and value. This report provides comprehensive analysis and insights (qualitative and quantitative) on the vehicle powertrain market. It highlights potential growth opportunities in the coming years as well as covers a review of the market drivers, restraints, growth indicators, challenges, competitive landscape, and other key aspects related to the automotive powertrain market. The key players in the market have also been identified and profiled.Get online access to the report on the World's First Market Intelligence Cloud
Request Sample Scope of the Report

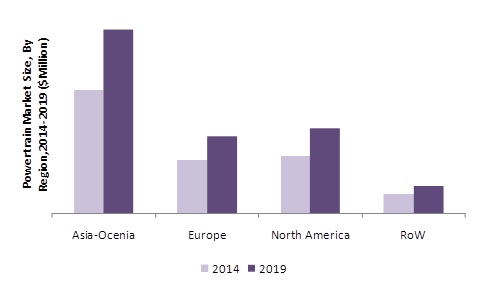
Automotive Powertrain Market, By Region, 2014 Vs. 2019 ($Million)
Source: MarketsandMarkets Analysis
Automotive Powertrain Market is projected to grow at a CAGR of 8.17% to reach $658.3 Billion by 2019.
The global automotive powertrain market is estimated to grow at a significant rate as the need for fuel-efficient and high performance automobiles is increasing. The need for high-tech powertrains has greatly increased in order to meet the stringent emission norms. The growing trend of downsizing engines and the rising demand for automated transmission are some of the key factors driving the automotive powertrain market globally.
The Asia-Oceania region is estimated to be the largest powertrain market in terms of value by 2019. The vital aspect contributing to the growth of the powertrain market in this region is the increasing number of vehicles being produced as well as the increasing penetration of passenger cars in the developing countries. The markets in North America and Europe are estimated to hold the second and third position, respectively. The introduction of stringent emission norms in European and North American countries have given rise to the increased demand for advanced powertrains which are lighter in weight and help in increasing fuel efficiency, reducing emissions, and improving the performance of vehicles.
With respect to vehicle type, the passenger cars segment is expected to hold the maximum share, followed by light commercial vehicles and heavy commercial vehicles. Currently, in the passenger cars segment, the front-wheel drive (FWD) type is estimated to dominate the market; whereas rear-wheel drive (RWD) is widely being adopted in light commercial vehicles and heavy commercial vehicles. In the coming years, the all-wheel drive (AWD) system is anticipated to replace the FWD and RWD systems owing to the growing demand for comfort and safety; and the increasing need for better acceleration, traction, and towing capacity in vehicles.
The global automotive powertrain market is dominated by a few major players in the market such as Aisin Seiki Co. (Japan), ZF Friedrichshafen AG (Germany), GKN plc (U.K.), BorgWarner Inc. (U.S.), American Axle and Manufacturing Inc., (U.S.), and JTEKT Corp. (Japan).
Automotive Powertrain Market Size, By Region, 2014 Vs. 2019 ($Million)
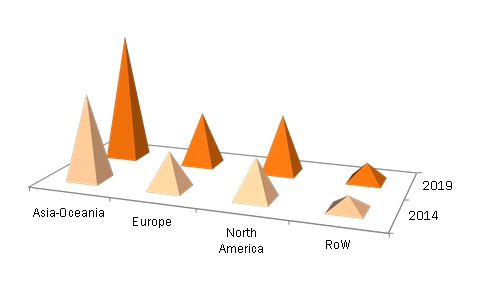
Source: MarketsandMarkets Analysis
Automotive Powertrain Market Size, By Vehicle Type, 2014 Vs. 2019 ($Million)
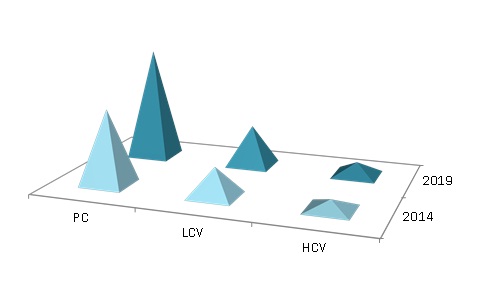
Source: MarketsandMarkets Analysis
Table of Contents
1 Introduction (Page No. - 15)
1.1 Objectives of the Study
1.2 Markets Covered
1.3 Stakeholders
1.4 Market Scope
2 Research Methodology (Page No. - 18)
2.1 Description of the Automotive Powertrain Demand Model
2.2 Market Size Estimation
2.3 Market Crackdown & Data Triangulation
2.4 Market Share Estimation
2.4.1 Key Data Taken From Secondary Sources
2.4.2 Key Data From Primary Sources
2.4.3 Assumptions
3 Executive Summary (Page No. - 24)
4 Premium Insights (Page No. - 26)
4.1 Automotive Powertrain Market
4.2 Opportunities in the Automotive Powertrain Market
4.3 Automotive Powertrain Market: By Vehicle Type (2014)
4.4 Automotive Powertrain Market: Developed vs. Developing Regions
4.5 Automotive Powertrain Market, By Key Country (2014-2019)
4.6 China to Acquire One-Fourth Share in the Automotive Powertrain Market By 2014
4.7 Life Cycle Analysis, By Geography
5 Market Overview (Page No. - 31)
5.1 Introduction
5.2 Market Segmentation
5.3 Market Dynamics
5.3.1 Drivers
5.3.1.1 Growing Trend of Downsized Engines
5.3.1.2 Rising Demand for Automatic Transmissions
5.3.2 Restraints
5.3.2.1 Stringent Emission Norms
5.3.2.2 Saturation in European Markets
5.3.3 Opportunity
5.3.3.1 Increasing Car Penetration in Emerging Countries
5.3.4 Challenge
5.3.4.1 Low Customer Willingness to Pay Extra for Sustainable Powertrain Systems
5.4 Burning Issue
5.4.1 Global Warming
6 Industry Trends (Page No. - 39)
6.1 Introduction
6.2 Value Chain Analysis
6.3 Porter�s Five Forces Analysis
6.3.1 Threat of New Entrants
6.3.2 Threat of Substitutes
6.3.3 Bargaining Power of Buyers
6.3.4 Bargaining Power of Suppliers
6.3.5 Intensity of Competitive Rivalry
6.4 Pest Analysis
6.4.1 Political Factors
6.4.2 Economic Factors
6.4.3 Social Factors
6.4.4 Technological Factors
7 Automotive Powertrain Market, By Region (Page No. - 46)
7.1 Introduction
7.2 Market, By Region
7.2.1 Asia-Oceania
7.2.1.1 By Country
7.2.1.1.1 China
7.2.1.1.2 Japan
7.2.1.1.3 South Korea
7.2.1.1.4 India
7.2.1.1.5 Rest of Asia-Oceania
7.2.2 Europe
7.2.2.1 By Country
7.2.2.1.1 Germany
7.2.2.1.2 France
7.2.2.1.3 U.K.
7.2.2.1.4 Rest of Europe
7.2.3 North America
7.2.3.1 By Country
7.2.3.1.1 U.S.
7.2.3.1.2 Mexico
7.2.3.1.3 Canada
7.2.4 ROW
7.2.4.1 By Country
7.2.4.1.1 Brazil
7.2.4.1.2 South Africa
7.2.4.1.3 Others
8 Automotive Powertrain Market, By Vehicle Type (Page No. - 71)
8.1 Introduction
8.2 Market, By Vehicle Type
8.2.1 Market Estimates (Volume)
8.2.2 Market Estimates (Value)
8.2.3 Passenger Cars (PCS)
8.2.3.1 Market By Region
8.2.3.1.1 Market Estimates (Volume)
8.2.3.1.2 Market Estimates (Value)
8.2.3.2 Market By Position/Drive Type
8.2.3.2.1 Market Estimates (Volume)
8.2.3.2.2 Market Estimates (Value)
8.2.4 Light Commercial Vehicles (LCVs)
8.2.4.1 Market By Region
8.2.4.1.1 Market Estimates (Volume)
8.2.4.1.2 Market Estimates (Value)
8.2.4.2 Market By Position/Drive Type
8.2.4.2.1 Market Estimates (Volume)
8.2.4.2.2 Market Estimates (Value)
8.2.5 Heavy Commercial Vehicles (HCVs)
8.2.5.1 Market By Region
8.2.5.1.1 Market Estimates (Volume)
8.2.5.1.2 Market Estimates (Value)
8.2.5.2 Market By Position/Drive Type
8.2.5.2.1 Market Estimates (Volume)
8.2.5.2.2 Market Estimates (Value)
9 Automotive Powertrain Market, By Position/Drive Type (Page No. - 82)
9.1 Introduction
9.2 Automotive Powertrain Market By Position/Drive Type
9.2.1 Market Estimates (Volume)
9.2.2 Market Estimates (Value)
9.3 Front-Wheel Drive (Fwd) Powertrain Market
9.3.1 By Region
9.3.1.1 Market Estimates (Volume)
9.3.1.2 Market Estimates (Value)
9.3.2 By Vehicle Type
9.3.2.1 Market Estimates (Volume)
9.3.2.2 Market Estimates (Value)
9.4 Rear-Wheel Drive (Rwd) Powertrain Market
9.4.1 By Region
9.4.1.1 Market Estimates (Volume)
9.4.1.2 Market Estimates (Value)
9.4.2 By Vehicle Type
9.4.2.1 Market Estimates (Volume)
9.4.2.2 Market Estimates (Value)
9.5 All-Wheel Drive (Awd) Powertrain Market
9.5.1 By Region
9.5.1.1 Market Estimates (Volume)
9.5.1.2 Market Estimates (Value)
9.5.2 By Vehicle Type
9.5.2.1 Market Estimates (Volume)
9.5.2.2 Market Estimates (Value)
10 Automotive Engine Market, By Type (Page No. - 92)
10.1 Introduction
10.2 Market, By Type
10.2.1 Market Estimates (Volume)
10.2.2 Market Estimates (Value)
10.2.3 Gasoline
10.2.3.1 Market, By Region
10.2.3.1.1 Market Estimates (Volume)
10.2.3.1.2 Market Estimates (Value)
10.2.3.2 Market By Vehicle Type
10.2.3.2.1 Market Estimates (Volume)
10.2.3.2.2 Market Estimates (Value)
10.2.4 Diesel
10.2.4.1 Market By Region
10.2.4.1.1 Market Estimates (Volume)
10.2.4.1.2 Market Estimates (Value)
10.2.4.2 Market By Vehicle Type
10.2.4.2.1 Market Estimates (Volume)
10.2.4.2.2 Market Estimates (Value)
11 Competitive Landscape (Page No. - 100)
11.1 Overview
11.2 Market Share Analysis, Powertrain Market
11.3 Competitive Situation &Trends
11.3.1 New Product Launches/Developments and R&D
11.3.2 Agreements, Partnerships, Collaborations, Supply Contracts& Joint Ventures
11.3.3 Mergers & Acquisitions, 2011-2014
11.3.4 Expansions
12 Company Profiles (Page No. - 111)
(Company at A Glance, Recent Financials, Products & Services, Strategies & Insights, & Recent Developments)*
12.1 Introduction
12.2 Aisin Seiki Co., Ltd.
12.3 Borgwarner Inc.
12.4 Ford Motor Company
12.5 General Motors Company
12.6 GKN PLC
12.7 Hyundai Motor Company
12.8 Jtekt Corporation
12.9 Toyota Motor Corporation
12.10 Volkswagen AG
12.11 ZF Friedrichshafen AG
*Details on Company at A Glance, Recent Financials, Products & Services, Strategies & Insights, & Recent Developments Might Not Be Captured in Case of Unlisted Companies.
List of Tables (88 Tables)
Table 1 Impact of Key Drivers on Automotive Powertrain Market
Table 2 Impact of Key Restraints on Automotive Powertrain Market
Table 3 Penetration of Passenger Cars Per 1,000 Population, Bric Nations vs. U.S., 2013 (Units)
Table 4 Impact of Key Opportunity on Automotive Powertrain Market
Table 5 Impact of Key Challenge on Automotive Powertrain Market
Table 6 Pest Analysis for Key Countries
Table 7 Automotive Powertrain Market Size, By Region, 2012-2019 ('000 Units)
Table 8 Automotive Powertrain Market Size, By Region, 2012-2019 ($Million)
Table 9 Asia-Oceania: Automotive Powertrain Market Size, By Position/Drive Type, 2012�2019 (�000 Units)
Table 10 Asia-Oceania: Automotive Powertrain Market Size, By Position/Drive Type, 2012�2019 ($Million)
Table 11 China: Automotive Powertrain Market Size, By Position/Drive Type, 2012-2019 (�000 Units)
Table 12 China: Automotive Powertrain Market Size, By Position/Drive Type, 2012-2019 ($Million)
Table 13 Japan: Automotive Powertrain Market Size, By Position/Drive Type, 2012-2019 (�Ooo Units)
Table 14 Japan: Automotive Powertrain Market Size, By Position/Drive Type, 2012-2019 ($Million)
Table 15 South Korea: Automotive Powertrain , By Market Size, By Position/Drive Type, 2012-2019 (�000 Units)
Table 16 South Korea: Automotive Powertrain , By Market Size, By Position/Drive Type, 2012-2019 ($Million)
Table 17 India: Automotive Powertrain , By Market Size, By Position/Drive Type, 2012-2019 (�000 Units)
Table 18 India: Automotive Powertrain , By Market Size, By Position/Drive Type, 2012-2019 ($Million)
Table 19 Rest of Asia-Oceania: Automotive Powertrain , By Market Size, By Position/Drive Type, 2012-2019 (�000 Units)
Table 20 Rest of Asia-Oceania: Automotive Powertrain , By Market Size, By Position/Drive Type, 2012-2019 ($Million)
Table 21 Europe: Automotive Powertrain Market Size, By Position/Drive Type, 2012-2019 (�000 Units)
Table 22 Europe: Automotive Powertrain , By Market Size, By Position/Drive Type, 2012-2019 ($Million)
Table 23 Germany: Automotive Powertrain, By Market Size, By Position/Drive Type, 2012-2019 (�000 Units)
Table 24 Germany: Automotive Powertrain , By Market Size, By Position/Drive Type, 2012-2019 ($Million)
Table 25 France: Automotive Powertrain , By Market Size, By Position/Drive Type, 2012-2019 (�000 Units)
Table 26 France: Automotive Powertrain , By Market Size, By Position/Drive Type, 2012-2019 ($Million)
Table 27 U.K.: Automotive Powertrain , By Market Size, By Position/Drive Type, 2012-2019 (�000 Units)
Table 28 U.K.: Automotive Powertrain , By Market Size, By Position/Drive Type, 2012�2019 ($Million)
Table 29 Rest of Europe: Automotive Powertrain Market Size, By Position/Drive Type, 2012-2019 (�000 Units)
Table 30 Rest of Europe: Automotive Powertrain Market Size, By Position/Drive Type, 2012-2019 ($Million)
Table 31 North America: Automotive Powertrain,By Market Size, By Position/Drive Type, 2012-2019 (�000 Units)
Table 32 North America: Automotive Powertrain , By Market Size, By Position/Drive Type, 2012-2019 ($Million)
Table 33 U.S.: Automotive Powertrain , By Market Size, By Position/Drive Type, 2012-2019 (�000 Units)
Table 34 U.S.: Automotive Powertrain , By Market Size, By Position/Drive Type, 2012-2019 ($Million)
Table 35 Mexico: Automotive Powertrain , By Market Size, By Position/Drive Type, 2012-2019 (�000 Units)
Table 36 Mexico: Automotive Powertrain , By Market Size, By Position/Drive Type, 2012-2019 ($Million)
Table 37 Canada: Automotive Powertrain , By Market Size, By Position/Drive Type, 2012-2019 (�000 Units)
Table 38 Canada: Automotive Powertrain , By Market Size, By Position/Drive Type, 2012-2019 ($Million)
Table 39 ROW: Automotive Powertrain , By Market Size, By Position/Drive Type, 2012-2019 (�000 Units)
Table 40 ROW: Automotive Powertrain , By Market Size, By Position/Drive Type, 2012-2019 ($Million)
Table 41 Brazil: Market Size, By Position/Drive Type, 2012-2019 (�000 Units)
Table 42 Brazil: Market Size, By Position/Drive Type, 2012-2019 ($Million)
Table 43 South Africa: Market Size, By Position/Drive Type, 2012-2019 (�000 Units)
Table 44 South Africa: Market Size, By Position/Drive Type, 2012-2019 ($Million)
Table 45 Others: Market Size, By Position/Drive Type, 2012-2019 (�000 Units)
Table 46 Others: Market Size, By Position/Drive Type, 2012-2019 ($Million)
Table 47 Market Size, By Vehicle Type, 2012-2019 (�000 Units)
Table 48 Market Size, By Vehicle Type, 2012-2019 ($Million)
Table 49 Passenger Cars: Powertrain Market Size, By Region, 2012-2019 (�000 Units)
Table 50 Passenger Cars: Powertrain Market Size, By Region, 2012-2019 ($Million)
Table 51 Passenger Cars: Powertrain Market Size, By Position/Drive Type, 2012-2019 (�000 Units)
Table 52 Passenger Cars: Powertrain Market Size, By Position/Drive Type, 2012-2019 ($Million)
Table 53 LCV: Powertrain Market Size, By Region, 2012-2019 (�000 Units)
Table 54 LCV: Powertrain Market Size, By Region, 2012-2019 ($Million)
Table 55 LCV: Powertrain Market Size, By Position/Drive Type, 2012-2019 (�000 Units)
Table 56 LCV: Powertrain Market Size, By Position/Drive Type, 2012-2019 ($Million)
Table 57 HCV: Powertrain Market Size, By Region, 2012-2019 (�000 Units)
Table 58 HCV: Powertrain Market Size, By Region, 2012-2019 ($Million)
Table 59 HCV: Powertrain Market Size, By Position/Drive Type, 2012-2019 (�000 Units)
Table 60 HCV: Powertrain Market Size, By Position/Drive Type, 2012-2019 ($Million)
Table 61 Automotive Powertrain Market Size, By Position/Drive Type, 2012�2019 ('000 Units)
Table 62 Automotive Powertrain Market Size, By Position/Drive Type, 2012�2019 ($Million)
Table 63 Front-Wheel Drive Powertrain Market Size, By Region, 2012�2019 ('000 Units)
Table 64 Front-Wheel Drive Powertrain Market Size, By Region, 2012�2019 ($Million)
Table 65 Front-Wheel Drive Powertrain Market Size, By Vehicle Type, 2012�2019 ('000 Units)
Table 66 Front-Wheel Drive Powertrain Market Size, By Vehicle Type, 2012�2019 ($Million)
Table 67 Rear-Wheel Drive Powertrain Market Size, By Region, 2012�2019 ('000 Units)
Table 68 Rear-Wheel Drive Powertrain Market Size, By Region, 2012�2019 ($Million)
Table 69 Rear-Wheel Drive Powertrain Market Size, By Vehicle Type, 2012�2019 ('000 Units)
Table 70 Rear-Wheel Drive Powertrain Market Size, By Vehicle Type, 2012�2019 ($Million)
Table 71 All-Wheel Drive Powertrain Market Size, By Region, 2012�2019 ('000 Units)
Table 72 All-Wheel Drive Powertrain Market Size, By Region, 2012�2019 ($Million)
Table 73 All-Wheel Drive Powertrain Market Size, By Vehicle Type, 2012�2019 ('000 Units)
Table 74 All-Wheel Drive Powertrain Market Size, By Vehicle Type, 2012�2019 ($Million)
Table 75 Automotive Engine Market Size, By Type, 2012-2019 (�000 Units)
Table 76 Automotive Engine Market Size, By Type, 2012-2019 ($Million)
Table 77 Gasoline Engine Market Size, By Region, 2012-2019 (�000 Units)
Table 78 Gasoline Engine Market Size, By Region, 2012-2019 ($Million)
Table 79 Gasoline Engine Market Size, By Vehicle Type, 2012-2019 (�000 Units)
Table 80 Gasoline Engine Market Size, By Vehicle Type, 2012-2019 ($Million)
Table 81 Diesel Engine Market Size, By Region, 2012-2019 (�000 Units)
Table 82 Diesel Engine Market Size, By Region, 2012-2019 ($Million)
Table 83 Diesel Engine Market Size, By Vehicle Type, 2012-2019 (�000 Units)
Table 84 Diesel Engine Market Size, By Vehicle Type, 2012-2019 ($Million)
Table 85 New Product Launches/Developments and R&D, 2011-2014
Table 86 Agreements, Partnerships, Collaborations, Supply Contracts,& Joint Ventures, 2011-2014
Table 87 Mergers & Acquisitions, 2011-2014
Table 88 Expansions, 2011-2014
List of Figures (53 Figures)
Figure 1 Research Methodology
Figure 2 Regional Purchasing Power Parity
Figure 3 Automotive Powertrain Market Size Estimation Methodology: Bottom-Up Approach
Figure 4 Automotive Powertrain Market Size, By Vehicle Type & Position/ Drive Type, 2014 vs. 2019 ($Million)
Figure 5 Automotive Powertrain Market Share (%), 2014
Figure 6 Passenger Car Segment Captures the Largest Share in the Automotive Powertrain Market
Figure 7 Attractive Market Opportunities in the Automotive Powertrain Market
Figure 8 Passenger Car Segment to Continue Dominating the Asia-Oceania Market Through to 2019
Figure 9 Developing Regions to Grow at A Faster Rate
Figure 10 More Than 50% of the Automotive Powertrain Market to Be Held By top Four Countries
Figure 11 China to Hold one-Fourth Share in the Market
Figure 12 Asia-Oceania Market to Show the Highest Potential in the Next 5 Years
Figure 13 Automotive Powertrain Market Segmentation
Figure 14 Drivers, Restraints, Opportunities, & Challenges in Automotive Powertrain Market
Figure 15 Sales of Vehicles in Europe, 2010-2013 (Million Units)
Figure 16 Passenger Car Sales, 2010-2013 (Million Units)
Figure 17 Value Chain
Figure 18 Porter�s Five Forces Analysis
Figure 19 Geographic Snapshot (2014): Asia-Oceania Emerging as the New Hot Spot
Figure 20 Automotive Powertrain Market Size, By Region, 2012-2019 ($Million)
Figure 21 Asia-Oceania Market Snapshot (2014): the Largest Automotive Consumer Market
Figure 22 North America Market Snapshot (2014): Market to Grow at A Steady Pace
Figure 23 Automotive Powertrain Market Trend, By Vehicle Type, 2012 vs. 2019 ($Million)
Figure 24 Passenger Car Powertrain Market Snapshot, By Position/Drive Type, 2014 vs. 2019 ($Million)
Figure 25 LCV Powertrain Market, By Region, 2014 vs. 2019 ($Million)
Figure 26 HCV Powertrain Market Size, By Region, 2014 vs. 2019 ($Million)
Figure 27 Automotive Powertrain Market Snapshot, By Position/Drive Type
Figure 28 Automotive Engine Market Snapshot, By Type, 2014 vs. 2019
Figure 29 Gasoline Engine Market Size, By Region, 2014 vs. 2019 ($Million)
Figure 30 Diesel Engine Market, By Vehicle Type Share (Value), 2014 vs. 2019
Figure 31 Companies Adopted New Product Launches as the Key Growth Strategy Over the Last Three Years
Figure 32 GKN PLC & Borgwarner inc. Grew at the Highest Rate Between 2010-2013
Figure 33 Among in-House Engine Manufacturers, Ford Motor Grew at the Fastest Rate Between 201o and 2013
Figure 34 Automotive Powertrain Market Share, By Key Player, 2013
Figure 35 Automotive Powertrain Market: Key Growth Strategies, 2011-2014
Figure 36 Battle for Market Share: New Product Launches Was the Key Strategy
Figure 37 Regional Revenue Mix of Top Five Market Players
Figure 38 Competitive Benchmarking of Key Market Players (2010�2013): ZF Friedrichshafen AG Emerged as the Champion Owing to Its Diversified Product Portfolio
Figure 39 Aisin Seiki Co., Ltd.: Company Snapshot
Figure 40 Aisin Seiki Co., Ltd.: SWOT Analysis
Figure 41 Borgwarner Inc.: Company Snapshot
Figure 42 Borgwarner Inc.: SWOT Analysis
Figure 43 Ford Motor Company: Company Snapshot
Figure 44 General Motors Company: Company Snapshot
Figure 45 GKN PLC: Company Snapshot
Figure 46 GKN PLC: SWOT Analysis
Figure 47 Hyundai Motor Company: Company Snapshot
Figure 48 Jtekt Corporation: Company Snapshot
Figure 49 Jtekt Corporation: SWOT Analysis
Figure 50 Toyota Motor Corporation: Company Snapshot
Figure 51 Volkswagen AG: Company Snapshot
Figure 52 ZF Friedrichshafen AG: Company Snapshot
Figure 53 ZF Friedrichshafen AG: SWOT Analysis


Growth opportunities and latent adjacency in Automotive Powertrain Market