Automotive Vehicle-to-Everything (V2X) Market by Offering (Hardware, Software), Type (V2V, V2I, V2P, V2G, V2H, and V2N), Connectivity Type (DSRC and Cellular), Vehicle Type (Passenger and Commercial), Application - Global Forecast to 2022


The automotive V2X market is expected to be valued at USD 767.5 Million in 2017 and is expected to reach USD 2,815.5 Million by 2022, at a CAGR of 29.69% between 2017 and 2022. The automotive V2X market is expected to be commercialized in 2017; therefore, the forecast period considered for the study is between 2017 and 2022.
Objective of the Study:
- To define, describe, and forecast the automotive vehicle-to-everything (V2X) market on the basis of offering, communication type, connectivity type, vehicle type, application, and geography
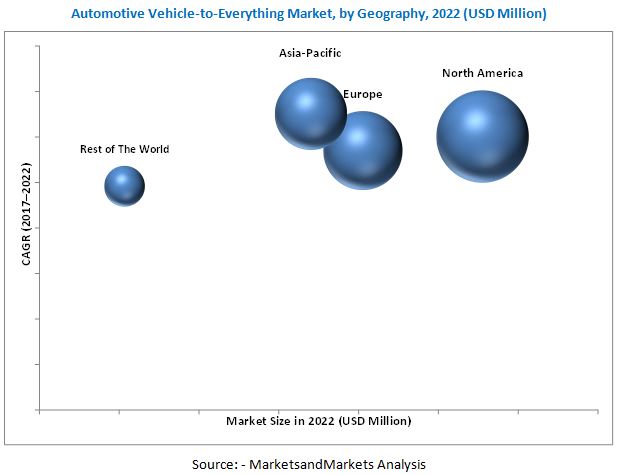
- To forecast the size of the various market segments with respect to four main regions�North America, Europe, Asia-Pacific (APAC), and Rest of the World (RoW)
- To provide detailed information regarding the major factors influencing the growth of the market (drivers, restraints, opportunities, and industry-specific challenges)
- To strategically analyze micro-markets with respect to individual growth trends, future prospects, and contributions to the total market
- To gauge the entry barriers to this market using the Porter�s five forces analysis, along with the value chain analysis and market roadmaps to study the evolution and timeline of the V2X market
- To strategically profile key players and comprehensively analyze their market shares and core competencies2
- To analyze the opportunities in the market for stakeholders and detail the competitive landscape of the market leaders
- To analyze the competitive developments such as joint ventures, collaborations, agreements, contracts, partnerships, mergers and acquisitions, new product developments, and research and developments (R&Ds) in the automotive V2X market
Research Methodology:
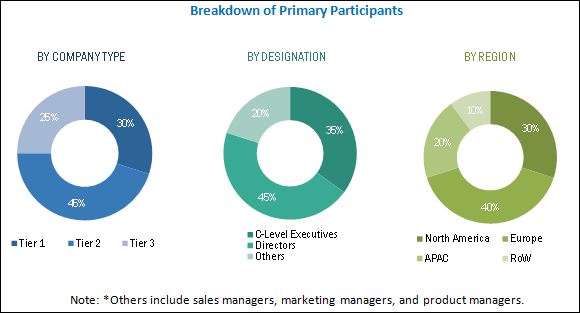
The research methodology used to estimate and forecast the automotive V2X market begins with capturing data through secondary research such as Hoovers, Bloomberg Business, Factiva, and OneSource. The primary sources mainly comprise several industry experts from core and related industries, along with preferred suppliers, manufacturers, distributors, service providers, reimbursement providers, technology developers, alliances, and standards and certification organizations related to the various segments of this industry�s value chain. Both top-down and bottom-up approaches have been used to estimate and validate the size of the global market and to estimate the size of various other dependent submarkets in the overall V2X market. After arriving at the overall market size, the total market has been split into several segments and sub-segments which have been verified through primary research by conducting extensive interviews with key people such as CEOs, VPs, directors, and executives. The market breakdown and data triangulation procedures have been employed to complete the overall market engineering process and arrive at the exact statistics for all segments and subsegments. The breakdown of profiles of primary respondents has been depicted in the figure below:
To know about the assumptions considered for the study, download the pdf brochure
The automotive V2X market�s value chain consists of V2X systems market, semiconductor market, and automobile manufacturers market. The V2X systems consists of RF transceivers and V2X chipsets and has players like Continental AG (Germany) and Delphi Automotive PLC (U.K.). The semiconductor market provides the V2X processors and has players such as Qualcomm Inc. (U.S.) and Infineon Technologies AG (Germany). The automobile manufacturers include players such as Daimler AG (Germany) and Audi AG (Germany) among others.
Key Target Audience:
- Automobile manufacturers
- Research laboratories in universities
- Government institutions
- Research organizations
- Forums, alliances, and associations
Get online access to the report on the World's First Market Intelligence Cloud
Request Sample Scope of the Report
:

The research report segments the neuromorphic computing market into the following submarkets:
By Offering:
- Hardware
- Software
By Communication Type:
- Vehicle-to-Vehicle
- Vehicle-to-Infrastructure
- Vehicle-to-Pedestrian
- Vehicle-to-Grid
- Vehicle-to-Home
- Vehicle-to-Network
By Connectivity Type:
- DSRC
- Cellular
By Vehicle Type:
- Passenger
- Commercial
By Application:
- Automated Driver Assistance
- Intelligent Traffic System
- Emergency Vehicle Notification
- Passenger Information System
- Fleet and Asset Management
- Parking Management System
- Remote Monitoring and Diagnostics
- Predictive Maintenance
By Geography:
- North America
- Europe
- Asia-Pacific
- RoW
Available Customizations:
- Analysis of industries in the automotive vehicle-to-everything market in different geographical regions. Customization can be provided on country-wise analysis of the automotive vehicle-to-everything market with respect to industries.
- Detailed analysis and profiling of additional market players (up to five)
According to the MarketsandMarkets forecast, the automotive V2X market is expected to be valued at USD 767.5 Million in 2017 and is expected to reach USD 2,815.5 Million by 2022, at a CAGR of 29.69% between 2017 and 2022. . Demand for real-time traffic and incident alerts for increasing public safety, increasing financial aid from various government funds for better traffic management, and increased environmental concerns are the key factors driving the growth of the market.
This report segments the automotive V2X market based on offerings, communication type, connectivity type, vehicle type, application, and geography. The market has been segmented on the basis of offering into hardware and software. According to Global Status Report on Road Safety 2015 by World Health Organization, more than 1.2 million people die every year due to road accidents. V2X communication is expected to provide improved active safety, better traffic efficiency and increased situational awareness which are expected to be the major driver for the growth of V2X hardware market.
The vehicle-to-infrastructure system can be used to mitigate vehicle crashes to enable a wide range of other safety, mobility, and environmental benefits. These benefits of V2I communication are the major factors expected to drive the automotive V2I market. In August 2016, Audi announced that it would launch the first V2I technology called Traffic light information on selected models such as Audi Q7, A4 and A4 in the U.S. by early 2017.
Passenger cars constitute the largest segment, accounting for the largest share of the global vehicle production in 2015. Connected passenger vehicles would mean that passenger vehicles, buses, traffic lights, and travelers would communicate with each other throughout the journey. This would have advantages such as less time stuck in traffic, more productivity while travelling, less congestion and emissions, more informed about ways to travel, and fewer traffic accidents. These advantages are expected to drive the passenger vehicles segment in the automotive V2X market based on vehicle type.
There is performance degradation leading to research in cellular connectivity owing to the increase in network load due to high user density. Companies such as Qualcomm Inc. (U.S.) has started testing LTE for V2X system connectivity. Cellular connectivity for V2X system is expected to be commercialized by 2019. This development is expected to drive the cellular connectivity market for automotive V2X market, thereby making it the fastest growing segment.
The growing number of vehicles is a major reason for the growing traffic congestion and increasing greenhouse emissions. According to the U.S. Environmental Protection Agency (EPA), the transportation sector accounted for 26% of the total greenhouse gas emissions in the U.S. in 2014. According to Eurostat, European Environment Agency, fuel combustion for transport is the second-most important source for greenhouse gas emission with 23.2% in 2014.
Intelligent traffic systems would lead to better traffic control and lower gas emissions, thereby acting as a major driver for the high growth of the automotive V2X market in intelligent traffic system.
North America is expected to dominate in the automotive V2X market owing to factors such as huge demand for automobiles in the region, favorable policies and regulations by government, and need for a better and effective transportation system. The usage of four wheelers and heavy vehicles is very high in North America, which has resulted in a huge requirement for an effective transportation system. Also, the demand for cars has witnessed a boost recently with the convergence of the ICT sector, the automotive sector, and the transportation sector resulting in the emergence of the connected vehicle ecosystem.
Lack of cellular connectivity coverage, cost burden on consumers, and lack of infrastructure are the major restraints of automotive V2X market. The key players in the automotive vehicle-to-everything (V2X) market are Continental AG (Germany), Delphi Automotive PLC (U.K.), Qualcomm Inc. (U.S.), Infineon Technologies AG (Germany), Daimler AG (Germany), and Audi AG (Germany) among others. Continental AG, Qualcomm Inc. and Daimler AG are the highest-ranked companies in the automotive V2X market. These three players rely on their strong R&D capabilities, diversified product portfolio, global reach, strategic partnerships, and mergers and acquisitions to hold a large share of the automotive V2X market.
To speak to our analyst for a discussion on the above findings, click Speak to Analyst
Table of Contents
1 Introduction (Page No. - 19)
1.1 Objectives of the Study
1.2 Market Definition
1.3 Scope of the Study
1.3.1 Markets Covered
1.3.2 Years Considered for This Study
1.4 Currency
1.5 Limitations
1.6 Stakeholders
2 Research Methodology (Page No. - 22)
2.1 Research Data
2.1.1 Secondary Data
2.1.1.1 Key Data From Secondary Sources
2.1.2 Primary Data
2.1.2.1 Key Data From Primary Sources
2.1.2.2 Key Industry Insights
2.2 Demand-Side and Supply-Side Analysis of the Vehicle-To-Everything Market
2.2.1 Demand-Side Analysis
2.2.1.1 Total Number of Vehicles Produced
2.2.1.2 Growth of Connected Devices
2.2.2 Supply-Side Analysis
2.2.2.1 Incumbent Companies are Providing Enhanced Features
2.2.2.2 Development of Efficient Connectivity Technology
2.3 Market Size Estimation
2.4 Market Breakdown and Data Triangulation
2.5 Market Share Estimation
2.6 Assumptions
3 Executive Summary (Page No. - 32)
4 Premium Insights (Page No. - 38)
4.1 Attractive Market Opportunities in the Automotive V2X Market
4.2 Software Expected to Grow at A Higher Rate in Automotive V2X Market Between 2017 and 2022
4.3 Vehicle-To-Vehicle Expected to Dominate the Automotive V2X Market Between 2017 and 2022
4.4 Cellular Connectivity Expected to Be Commercialized By 2019
4.5 Passenger Vehicles Expected to Grow in the Automotive V2X Market, By Vehicle Type
4.6 Application and Region Snapshot of Automotive V2X Market
4.7 China Expected to Grow at the Highest Rate in the Automotive V2X Market Between 2017 and 2022
5 Market Overview (Page No. - 42)
5.1 Introduction
5.2 Evolution
5.3 Market Segmentation
5.3.1 By Offering
5.3.2 By Communication Type
5.3.3 By Connectivity Type
5.3.4 By Vehicle Type
5.3.5 By Application
5.3.6 By Geography
5.4 Market Dynamics
5.4.1 Drivers
5.4.1.1 Demand for Real-Time Traffic and Incident Alerts for Increasing Public Safety
5.4.1.2 Increasing Financial Aid From Various Governments for Better Traffic Management
5.4.1.3 Increasing Environmental Concerns to Lead to the Adoption of Connected Vehicles
5.4.2 Restraints
5.4.2.1 Lack of Cellular Connectivity Coverage in Developing Countries
5.4.2.2 Cost Burden on Consumers
5.4.2.3 Lack of Infrastructure
5.4.3 Opportunities
5.4.3.1 Autonomous Cars to Transform Automotive Industry
5.4.3.2 Predictive Maintenance Using Real-Time Monitoring
5.4.4 Challenges
5.4.4.1 Lack of Standardization
5.4.4.2 Lack of Willingness to Adopt New Technology
5.4.4.3 Security of Data Generated By Vehicles
6 Industry Trends (Page No. - 53)
6.1 Introduction
6.2 Value Chain Analysis
6.3 Porter�s Five Forces
6.3.1 Bargaining Power of Suppliers
6.3.2 Bargaining Power of Buyers
6.3.3 Threat of Substitutes
6.3.4 Threat of New Entrants
6.3.5 Degree of Competition
7 Automotive Vehicle-To-Everything Market, By Offering (Page No. - 62)
7.1 Introduction
7.2 Hardware
7.3 Software
7.3.1 Device Management
7.3.2 Application Management
7.3.3 Network Management
8 Automotive Vehicle-To-Everything Market, By Communication Type (Page No. - 69)
8.1 Introduction
8.2 Vehicle-To-Vehicle (V2V)
8.3 Vehicle-To-Infrastructure (V2I)
8.4 Vehicle-To-Pedestrian (V2P)
8.5 Vehicle-To-Home (V2H)
8.6 Vehicle-To-Grid (V2G)
8.7 Vehicle-To-Network (V2N)
9 Automotive Vehicle-To-Everything Market, By Vehicle Type (Page No. - 78)
9.1 Introduction
9.2 Passenger Vehicles
9.3 Commercial Vehicles
10 Automotive Vehicle-To-Everything Market, By Connectivity Type (Page No. - 87)
10.1 Introduction
10.2 Dedicated Short Range Communication (DSRC) Connectivity
10.3 Cellular Connectivity
11 Automotive Vehicle-To-Everything Market, By Application (Page No. - 94)
11.1 Introduction
11.2 Automated Driver Assistance
11.3 Intelligent Traffic Systems
11.4 Emergency Vehicle Notification
11.5 Passenger Information System
11.6 Fleet & Asset Management
11.7 Parking Management System
11.8 Remote Monitoring & Diagnostics
11.9 Predictive Maintenance
12 Geographic Analysis (Page No. - 106)
12.1 Introduction
12.2 North America
12.2.1 U.S.
12.2.2 Canada
12.2.3 Mexico
12.3 Europe
12.3.1 Germany
12.3.2 U.K.
12.3.3 France
12.3.4 Italy
12.3.5 Spain
12.3.6 Rest of Europe
12.4 Asia-Pacific
12.4.1 China
12.4.2 Japan
12.4.3 South Korea
12.4.4 India
12.4.5 Rest of APAC
12.5 RoW
12.5.1 Middle East & Africa
12.5.2 South America
13 Competitive Landscape (Page No. - 130)
13.1 Overview
13.2 Key Players in the Automotive Vehicle-To-Everything Market
13.3 Competitive Situations and Trends
13.4 Partnerships, Collaborations, Agreements, Expansions & Joint Ventures
13.5 New Product Launches
13.6 Mergers & Acquisitions
14 Company Profiles (Page No. - 137)
14.1 Introduction
(Business Overview, Products & Services, Key Insights, Recent Developments, SWOT Analysis, Ratio Analysis, MnM View)*
14.2 Continental AG
14.3 Qualcomm Inc.
14.4 Daimler AG
14.5 Delphi Automotive PLC
14.6 Infineon Technologies AG
14.7 Audi AG
14.8 Intel Corporation
14.9 NXP Semiconductors N.V.
14.10 Tomtom N.V.
14.11 International Business Machines Corporation
14.12 Cisco Systems, Inc.
14.13 AT&T Inc.
14.14 Vodafone Group PLC.
14.15 Robert Bosch GmbH
14.16 Harman International Industries, Inc.
14.17 Nvidia Corporation
14.18 Mobileye NV
14.19 PTC Inc.
14.20 Autotalks Limited
14.21 Cohda Wireless PTY Ltd.
*Details on Business Overview, Products & Services, Key Insights, Recent Developments, SWOT Analysis, MnM View Might Not Be Captured in Case of Unlisted Companies.
15 Appendix (Page No. - 198)
15.1 Insights From Industry Experts
15.2 Discussion Guide
15.3 Knowledge Store: Marketsandmarkets� Subscription Portal
15.4 Introducing RT: Real-Time Market Intelligence
15.5 Available Customization
15.6 Related Reports
15.7 Author Details
List of Tables (67 Tables)
Table 1 Government Initiatives in the V2X Technology Market, 2014�2016
Table 2 Automotive V2X Market, By Offering, 2017�2022 (USD Million)
Table 3 Automotive V2X Market for Hardware Market, By Region, 2017�2022 (USD Million)
Table 4 Automotive V2X Market for Hardware, By Region, 2017�2022 (Thousand Units)
Table 5 Automotive V2X Market for Hardware, By Connectivity Type, 2017�2022 (USD Million)
Table 6 Automotive V2X Market, By Software, 2017�2022 (USD Million)
Table 7 Automotive V2X Market, By Communication Type, 2017�2022 (USD Million)
Table 8 Automotive V2V Market, By Region, 2017�2022 (USD Million)
Table 9 Automotive V2I Market, By Region, 2018�2022 (USD Million)
Table 10 Automotive V2P Market, By Region, 2018�2022 (USD Million)
Table 11 Automotive V2H Market, By Region, 2018�2022 (USD Million)
Table 12 Automotive V2G Market, By Region, 2018�2022 (USD Million)
Table 13 Automotive V2N Market, By Region, 2017�2022 (USD Million)
Table 14 Automotive V2X Market, By Vehicle Type, 2017�2022 (USD Million)
Table 15 Automotive V2X Market, By Vehicle Type, 2017�2022 (Thousand Units)
Table 16 Automotive V2X Market for Passenger Vehicles, By Region, 2017�2022 (USD Million)
Table 17 Automotive V2X Market for Passenger Vehicles, By Region, 2017�2022 (Thousand Units)
Table 18 Automotive V2X Market for Passenger Vehicles, By Connectivity Type, 2017�2022 (USD Million)
Table 19 Automotive V2X Market for Commercial Vehicles, By Vehicle Type, 2017�2022 (USD Million)
Table 20 Automotive V2X Market for Commercial Vehicles, By Region, 2017�2022 (USD Million)
Table 21 Automotive V2X Market for Commercial Vehicles, By Region, 2017�2022 (Thousand Units)
Table 22 Automotive V2X Market for Commercial Vehicles, By Connectivity Type, 2017�2022 (USD Million)
Table 23 Automotive V2X Market, By Connectivity Type, 2017�2022 (USD Million)
Table 24 Automotive V2X Market, By Connectivity Type, 2017�2022 (Thousand Units)
Table 25 Automotive V2X Market for DSRC Connectivity, By Vehicle Type, 2017�2022 (USD Million)
Table 26 Automotive V2X Market for DSRC Connectivity, By Vehicle Type, 2017�2022 (Thousand Units)
Table 27 Automotive V2X Market for Communication Type, By Region, 2017�2022 (USD Million)
Table 28 Automotive V2X Market for Cellular Connectivity, By Vehicle Type, 2019�2022 (USD Million)
Table 29 Automotive V2X Market for Cellular Communication, By Vehicle Tpe, 2019�2022 (Thousand Units)
Table 30 Automotive V2X Market for Cellular Communication, By Region, 2019�2022 (USD Million)
Table 31 Automotive V2X Market, By Application, 2017�2022 (USD Million)
Table 32 Automotive V2X Market for Automated Driver Assistance, By Region, 2017�2022 (USD Million)
Table 33 Automotive V2X Market for Intelligent Traffic Systems, By Region, 2018�2022 (USD Million)
Table 34 Automotive V2X Market for Emergency Vehicle Notifications, By Region, 2018�2022 (USD Million)
Table 35 Automotive V2X Market for Passenger Information Systems, By Region, 2018�2022 (USD Million)
Table 36 Automotive V2X Market for Fleet & Asset Management, By Region, 2018�2022 (USD Million)
Table 37 Automotive V2X Market for Parking Management Systems, By Region, 2018�2022 (USD Million)
Table 38 Automotive V2X Market for Remote Monitoring & Diagnostics, By Region, 2018�2022 (USD Million)
Table 39 Automotive V2X Market for Predictive Maintenance, By Region, 2018�2022 (USD Million)
Table 40 Automotive V2X Market, By Region, 2017�2022 (USD Million)
Table 41 Automotive V2X Market, By Region, 2017�2022 (Thousand Units)
Table 42 Automotive V2X Market in North America, By Country, 2017�2022 (USD Million)
Table 43 Automotive V2X Market in North America, By Country, 2017�2022 (Thousand Units)
Table 44 Automotive V2X Market in North America, By Application, 2017�2022 (USD Million)
Table 45 Automotive V2X Market in North America, By Vehicle Type, 2017�2022 (USD Million)
Table 46 Automotive V2X Market in North America, By Vehicle Type, 2017�2022 (Thousand Units)
Table 47 Automotive V2X Market in Europe, By Country, 2017�2022 (USD Million)
Table 48 Automotive V2X Market in Europe, By Country, 2017�2022 (Thousand Units)
Table 49 Automotive V2X Market in Europe, By Application, 2017�2022 (USD Million)
Table 50 Automotive V2X Market in Europe, By Vehicle Type, 2017�2022 (USD Million)
Table 51 Automotive V2X Market in Europe, By Vehicle Type, 2017�2022 (Thousand Units)
Table 52 Automotive V2X Market in Asia-Pacific, By Country, 2017�2022 (USD Million)
Table 53 Automotive V2X Market in Asia-Pacific, By Country, 2017�2022 (Thousand Units)
Table 54 Automotive V2X Market in Asia-Pacific, By Application, 2017�202 (USD Million)
Table 55 Automotive V2X Market in Asia-Pacific, By Vehicle Type, 2017�2022 (USD Million)
Table 56 Automotive V2X Market in Asia-Pacific, By Vehicle Type, 2017�2022 (Thousand Units)
Table 57 Automotive V2X Market in Rest of the World, By Region, 2017�2022 (USD Million)
Table 58 Automotive V2X Market in Rest of the World, By Region, 2017�2022 (Thousand Units)
Table 59 Automotive V2X Market in Rest of the World, By Application, 2017�2022 (USD Million)
Table 60 Automotive V2X Market in Rest of the World, By Vehicle Type, 2017�2022 (USD Million)
Table 61 Automotive V2X Market in Rest of the World, By Vehicle Type, 2017�2022 (Thousand Units)
Table 62 Continental AG Expected to Lead the V2X Systems Market for Automotive Vehicle-To-Everything Market, 2015
Table 63 Qualcomm Inc. Expected to Lead the Semiconductor Market for Automotive Vehicle-To-Everything Market, 2015
Table 64 Daimler AG Expected to Lead the Automobile Manufacturers Market for Automotive Vehicle-To-Everything Market, 2015
Table 65 Partnerships, Collaborations, Agreements, Expansions & Joint Ventures, 2015�2016
Table 66 New Product Launches, 2016
Table 67 Mergers & Acquisitions, 2015�2016
List of Figures (95 Figures)
Figure 1 Vehicle-To-Everything Market
Figure 2 Automotive Vehicle-To-Everything Market: Research Design
Figure 3 Number of Vehicles Produced, 2012�2015
Figure 4 Market Size Estimation Methodology: Bottom-Up Approach
Figure 5 Market Size Estimation Methodology: Top-Down Approach
Figure 6 Breakdown of Primaries
Figure 7 Data Triangulation
Figure 8 Flow of Report Writing
Figure 9 Automotive V2X Market, By Offering, 2017 vs 2022
Figure 10 Automotive V2X Market, By Communication Type, 2017 vs 2022
Figure 11 Automotive V2X Market, By Vehicle Type, 2017 vs 2022
Figure 12 Automotive V2X Market, By Connectivity Type, 2017 vs 2022
Figure 13 Automotive V2X Market: By Application, 2017 vs 2022
Figure 14 Automotive V2X Market, By Region, 2017
Figure 15 Automotive V2X Market Expected to Grow at A High Rate Between 2017 and 2022
Figure 16 Hardware Expected to Hold A Larger Size of the Automotive V2X Market Between 2017 and 2022
Figure 17 Vehicle-To-Infrastructure Expected to Grow at the Highest Rate Between 2018 and 2022
Figure 18 DSRC Connectivity Expected to Hold A Larger Size of the Automotive V2X Market By 2022
Figure 19 Passenger Vehicles Expected to Hold the Largest Share of the Automotive V2X Market By 2022
Figure 20 Automated Driver Assistance to Hold the Largest Share of the Automotive V2X Market for Applications in 2017
Figure 21 U.S. Likely to Hold the Largest Share of the Automotive V2X Market Between 2017 and 2022
Figure 22 Evolution of Automotive Vehicle-To-Everything Technology
Figure 23 Automotive Vehicle-To-Everything Market, By Geography
Figure 24 Automotive Vehicle-To-Everything Market Dynamics
Figure 25 Number of Road Traffic Deaths, Worldwide
Figure 26 Value Chain Analysis of the Automotive Vehicle-To-Everything Market, 2015
Figure 27 Overview of the Porter�s Five Forces Analysis of the Automotive Vehicle-To-Everything Market (2015)
Figure 28 Automotive Vehicle-To-Everything Market: Porter�s Five Forces Analysis (2015)
Figure 29 High Impact of Bargaining Power of Suppliers on the Automotive V2X Market
Figure 30 Medium Impact of Bargaining Power of Buyers on the Automotive V2X Market
Figure 31 Low Impact of Threat of Substitutes on the Automotive V2X Market
Figure 32 Medium Impact of Threat of New Entrants on the Automotive V2X Market
Figure 33 High Impact of Degree of Competition on the Automotive V2X Market
Figure 34 Automotive V2X Segmentation, By Offering
Figure 35 Automotive V2X Market for Software Expected to Grow at A Higher Rate Between 2017 and 2022
Figure 36 North America Expected to Hold the Largest Size, in Terms of Volume, of the Automotive V2X Hardware Market Between 2017 and 2022
Figure 37 Device Management Expected to Dominate the Automotive V2X Market for Software Between 2017 and 2022
Figure 38 Automotive V2X Segmentation, By Communication Type
Figure 39 V2V Communication Expected to Hold the Largest Size of the Automotive V2X Market Between 2017 and 2022
Figure 40 North America Expected to Dominate the Automotive V2I Market Between 2018 and 2022
Figure 41 Asia-Pacific Expected to Grow at the Highest Rate in the Automotive V2G Market Between 2018 and 2022
Figure 42 Automotive Vehicle-To-Everything Market Segmentation, By Vehicle Type
Figure 43 Passenger Vehicles Expected to Dominate the Automotive Vehicle-To-Everything Market Between 2017 and 2022
Figure 44 Asia-Pacific Expected to Grow at the Highest Rate in the Automotive V2X Market for Passenger Vehicles Between 2017 and 2022
Figure 45 DSRC Connectivity to Hold A Larger Size of the Automotive Vehicle-To-Everything Market for Passenger Vehicle Between 2017 and 2022
Figure 46 Light Commercial Vehicles to Hold A Larger Size of the Automotive V2X Market for Commercial Vehicles Between 2017 and 2022
Figure 47 Asia-Pacific Expected to Grow at the Highest Rate in the Automotive V2X Market for Commercial Vehicles Between 2017 and 2022
Figure 48 Automotive V2X Segmentation, By Connectivity Type
Figure 49 Cellular Connectivity Expected to Grow at A Higher Rate in the Automotive V2X Market Between 2017 and 2022
Figure 50 Passenger Vehicle Expected to Hold A Larger Size of the Automotive V2X Market for DSRC Between 2017 and 2022
Figure 51 Asia-Pacific Expected to Grow at the Highest Rate in the Automotive V2X Market for Cellular Connectivity Between 2019 and 2022
Figure 52 Automotive V2X Segmentation, By Application
Figure 53 Automated Driver Assistance Application Expected to Hold the Largest Size of the Automotive V2X Market Between 2017 and 2022
Figure 54 North America Expected to Hold the Largest Size of the Automotive V2X Market for Automated Driver Assistance Between 2017 and 2022
Figure 55 Asia-Pacific Expected to Grow at the Highest Rate in the Automotive V2X Market for Fleet & Asset Management Between 2018 and 2022
Figure 56 Automotive Vehicle-To-Everything Market Segmentation, By Region
Figure 57 Automotive V2X Market in China Expected to Grow at the Highest Rate Between 2017 and 2022
Figure 58 Snapshot of Automotive Vehicle-To-Everything Market in North America
Figure 59 U.S. Expected to Grow at the Highest Rate in the Automotive V2X Market in North America Between 2017 and 2022
Figure 60 Passenger Vehicles Expected to Dominate the Automotive Vehicle-To-Everything Market, in Terms of Volume, in North America Between 2017 and 2022
Figure 61 Snapshot of Automotive Vehicle-To-Everything Market in Europe
Figure 62 Germany Expected to Hold the Largest Size of the Automotive V2X Market in Europe Between 2017 and 2022
Figure 63 Automated Driver Assistance System Expected to Hold the Largest Size of the Automotive V2X Market in Europe Between 2017 and 2022
Figure 64 Snapshot of Automotive Vehicle-To-Everything Market in APAC
Figure 65 Japan Expected to Hold the Largest Size of the Automotive Vehicle-To-Everything Market in Asia-Pacific Between 2017 and 2022
Figure 66 Passenger Vehicles Expected to Hold A Larger Size of the Automotive V2X Market in Asia-Pacific Between 2017 and 2022
Figure 67 Automated Driver Assistance Systems to Hold the Largest Size of the Automotive V2X Market in RoW Between 2017 and 2022
Figure 68 Passenger Vehicles Expected to Dominate the Automotive V2X Market in Rest of the World Between 2017 and 2022
Figure 69 Companies Adopted Partnerships, Agreements, Expansions, & Collaborations as the Key Growth Strategy in the Past Two Years (2015�2016)
Figure 70 Battle for Market Share: Partnerships, Collaborations, Agreements, Expansions & Joint Ventures Was the Key Strategy Adopted By Companies Between 2015 and 2016
Figure 71 Geographic Revenue Mix of Major Companies
Figure 72 Continental AG: Company Snapshot
Figure 73 SWOT Analysis: Continental Ag
Figure 74 Qualcomm Inc.: Company Snapshot
Figure 75 SWOT Analysis: Qualcomm Inc.
Figure 76 Daimler AG: Company Snapshot
Figure 77 SWOT Analysis: Daimler Ag
Figure 78 Delphi Automotive PLC: Company Snapshot
Figure 79 SWOT Analysis: Delphi Automotive PLC
Figure 80 Infineon Technologies AG: Company Snapshot
Figure 81 SWOT Analysis: Infineon Technologies Ag
Figure 82 Audi AG: Company Snapshot
Figure 83 Audi AG : SWOT Analysis
Figure 84 Intel Corporation: Company Snapshot
Figure 85 NXP Semiconductors: Company Snapshot
Figure 86 Tomtom N.V.: Company Snapshot
Figure 87 International Business Machines Corporation : Company Snapshot
Figure 88 Cisco Systems, Inc.: Company Snapshot
Figure 89 AT&T Inc.: Company Snapshot
Figure 90 Vodafone Group PLC.: Company Snapshot
Figure 91 Bosch Group: Company Snapshot
Figure 92 Harman International Industries Inc.: Company Snapshot
Figure 93 Nvidia Corporation : Company Snapshot
Figure 94 Mobileye NV : Company Snapshot
Figure 95 PTC Inc.: Company Snapshot


Growth opportunities and latent adjacency in Automotive Vehicle-to-Everything (V2X) Market