Ballast Water Treatment Market by Technology (Physical Disinfection, Mechanical Method, Chemical Method), Capacity, Service, Ship Type (Container Ships, Dry Bulk Carriers, Tankers, General Cargos) and Geography - Global Forecast to 2022


[159 Pages Report] The ballast water treatment market was valued at USD 14.29 Billion in 2016 and is estimated to reach USD 118.77 Billion by 2022, at a CAGR of 37.19% during the forecast period. The base year used for this study is 2016, and the forecast period considered is between 2017 and 2022.
The objectives of the study are as follows:
- To define, describe, and forecast the ballast water treatment market segmented on the basis of technology, capacity, service, ship type, and geography
- To forecast the market size in terms of value for various segments with respect to four main regions: North America, Europe, APAC, and RoW
- To provide detailed information regarding the major factors influencing the growth of the ballast water treatment market (drivers, restraints, opportunities, and industry-specific challenges)
- To provide a detailed overview of the value chain in the ballast water treatment market and analyze the market trends with Porter�s five forces analysis
- To analyze the opportunities in the market for various stakeholders by identifying the high-growth segments of the ballast water treatment market
- To strategically profile the key players and comprehensively analyze their market position in terms of ranking and core competencies, along with detailing the competitive landscape for the market leaders
- To analyze competitive developments such as new product launches and developments; agreements and contracts; mergers and acquisitions; and expansions in the global ballast water treatment market
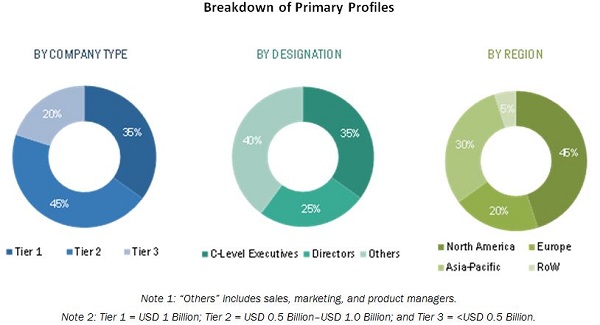
The research methodology used to estimate and forecast the ballast water treatment market begins with obtaining data on key vendor revenues through secondary research. Some of the secondary sources used in this research include various journals and databases such as IEEE journals, Factiva, Hoovers, and OneSource. The vendor offerings have also been taken into consideration to determine the market segmentation. The bottom-up procedure has been employed to arrive at the overall size of the market from the revenues of the key players in the market. After arriving at the overall market size, the total market has been split into several segments and subsegments, which have been verified through primary research by conducting extensive interviews with industry experts such as CEOs, VPs, directors, and executives. The market breakdown and data triangulation procedures have been employed to complete the overall market engineering process and arrive at the exact statistics for all segments and subsegments. The breakdown of the profiles of primaries has been depicted in the figure below.
The ballast water treatment market ecosystem comprises ballast water treatment-related manufacturing, technology, and service vendors such as W�rtsil� Corporation (Finland), Xylem Inc. (U.S.), Evoqua Water Technologies LLC (U.S.), Calgon Carbon Corporation (U.S.), Ecochlor, Inc. (U.S.), Veolia Environnement S.A. (France), Alfa Laval AB (Sweden), Trojan Marinex (Canada), Mitsubishi Heavy Industries, Ltd. (Japan), atg UV Technology (U.K.), Qingdao Headway Technology Co., Ltd. (China), JFE Engineering Corporation (Japan), and Optimarin AS (Norway), who sell these products and provide services to end users to cater to their specific requirements.
To know about the assumptions considered for the study, download the pdf brochure
Target Audience:
- Ballast Water Treatment : Service Providers
- Manufacturing companies
- Research organizations
- Ballast water treatment-related associations, organizations, forums, and alliances
- Distributors, resellers, and traders
- Government bodies such as regulatory authorities and policymakers
- Venture capitalists, private equity firms, and start-up companies
�The study answers several questions for the target audiences, primarily which market segments to focus on in the next two to five years for prioritizing the efforts and investments.
Report Scope:
In this report, the ballast water treatment market has been segmented into the following categories:
Ballast water treatment market, by Technology:
- Physical disinfection
- Mechanical method
- Chemical method
Ballast water treatment market, by Capacity:
- Less than 1,500 m3
- 1,500�5,000 m3
- More than 5,000 m3
Ballast water treatment market, by Service:
- Installation and calibration
- Performance measurement
- Recommissioning
Ballast water treatment market, by Ship Type:
- Container ships
- Dry bulk carriers
- Tankers
- General cargos
- Others
Ballast water treatment market, by Geography:
- North America (U.S. and Canada)
- Europe (Greece, Germany, U.K., Norway, and Rest of Europe)
- APAC (Japan, China, Singapore, and South Korea)
- RoW (South America and MEA)
Available Customizations:
With the given market data, MarketsandMarkets offers customizations according to the company�s specific needs. The following customization options are available for the report:
Company Information
Detailed analysis and profiling of additional market players (up to five)
The ballast water treatment market was valued at USD 14.29 Billion in 2016 and is expected to reach USD 118.77 Billion by 2022, at a CAGR of 37.19% during the forecast period. The growth of this market is propelled by the increasing government rules and regulations for the installation of BWT systems in the ships.
The report covers the BWT market on the basis of technology, capacity, service, ship type, and geography. The ballast water treatment market is expected to be led by the tankers segment during the forecast period. The growth of this market is propelled by the high demand for BWT for improving the operations, optimizing resource utilization, and increasing the profitability in the medicine manufacturing firms.
The physical disinfection technology used for the treatment of ballast water has dominated the ballast water treatment market in terms of market size. Physical disinfection helps in removing or deactivating the microorganisms from the ballast water without adding any toxic substance to it. Also, the methods used in physical disinfection allow easy installation, operation, and maintenance. This method is extensively implemented across the globe to treat ballast water, and it is most effective against a wide range of organisms, such as marine worm larvae, juvenile barnacles, juvenile bivalves, flatworms, and diatoms. Physical disinfection also offers considerable advantages such as ease of operation and high level of efficiency.
The tankers segment is expected to witness significant growth in the BWT market during the forecast period. Tankers are extremely important in the shipping industry as they help to transport huge quantities of crude oil, chemicals, petroleum, and LNG, among others, across the oceans and seas. The continuously evolving crude oil industry is a major factor governing the global trade.
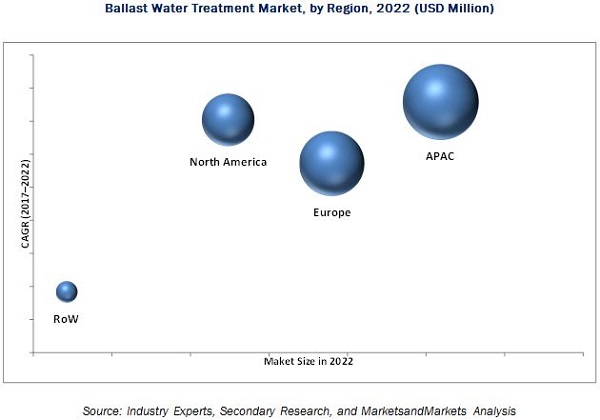
APAC held the largest size of the ballast water treatment market in 2016. The presence of a large number of ports and harbors for trade of automotive components, oil and chemicals, electronic components, and devices, among others, contributes to the market growth in the APAC region. This further makes use of various kinds of vessels such as containers, tankers, and other cargo ships. Since the IMO has made it mandatory to install BWT systems in the ships, it is expected to drive the demand for BWT systems.
The key factors restraining the growth of the ballast water treatment market are the continuously evolving government standards and the high cost of installation and maintenance.
Some of the major companies operating in the BWT market are W�rtsil� Corporation (Finland), Xylem Inc. (U.S.), Evoqua Water Technologies LLC (U.S.), Calgon Carbon Corporation (U.S.), Ecochlor, Inc. (U.S.), Veolia Environnement S.A. (France), Alfa Laval AB (Sweden), Trojan Marinex (Canada), Mitsubishi Heavy Industries, Ltd. (Japan), atg UV Technology (U.K.), Qingdao Headway Technology Co., Ltd. (China), JFE Engineering Corporation (Japan), and Optimarin AS (Norway), among others.
To speak to our analyst for a discussion on the above findings, click Speak to Analyst
Table of Contents
1 Introduction (Page No. - 12)
1.1 Objectives of the Study
1.2 Market Definition
1.3 Study Scope
1.3.1 Markets Covered
1.3.2 Geographic Scope
1.3.3 Years Considered for the Study
1.4 Currency
1.5 Limitations
1.6 Stakeholders
2 Research Methodology (Page No. - 16)
2.1 Introduction
2.1.1 Secondary Data
2.1.1.1 Key Data From Secondary Sources
2.1.2 Primary Data
2.1.2.1 Key Data From Primary Sources
2.1.2.2 Key Industry Insights
2.2 Ballast Water Treatment Market Size Estimation
2.3 Ballast Water Treatment Market Breakdown and Data Triangulation
2.4 Ballast Water Treatment Market Research Assumptions
3 Executive Summary (Page No. - 25)
4 Premium Insights (Page No. - 30)
4.1 Attractive Growth Opportunities in the BWT Market
4.2 Ballast Water Treatment Market, By Ship Type
4.3 Market, By Region and Service
4.4 Market, By Capacity
4.5 Market, By Geography
5 Market Overview (Page No. - 34)
5.1 Ballast Water Treatment Market Segmentation
5.1.1 BWT Market, By Technology
5.1.2 BWT Market, By Capacity
5.1.3 BWT Market, By Service
5.1.4 BWT Market, By Ship Type
5.2 Ballast Water Treatment Market Dynamics
5.2.1 Drivers
5.2.1.1 Government Initiatives Toward Marine Environmental Protection
5.2.1.2 Rise in Volumes of Seaborne Trade
5.2.1.3 Emerging Healthcare Concern in the Shipping Industry
5.2.2 Restraints
5.2.2.1 Storage of Disinfection By-Products Generated After Water Treatment
5.2.3 Opportunities
5.2.3.1 New Conventions to Encourage the Demand for BWT
5.2.4 Challenges
5.2.4.1 Continuously Evolving Government Rules and Regulations
6 Industry Trends (Page No. - 43)
6.1 Introduction
6.2 Value Chain Analysis
6.3 Porter�s Five Forces Model
6.3.1 Threat of New Entrants
6.3.2 Threat of Substitutes
6.3.3 Bargaining Power of Suppliers
6.3.4 Bargaining Power of Buyers
6.3.5 Intensity of Competitive Rivalry
7 Ballast Water Treatment Market, By Technology (Page No. - 51)
7.1 Introduction
7.2 Physical Disinfection
7.2.1 Ultraviolet Light/Ultrasound
7.2.2 Cavitation
7.2.3 Deoxygenation
7.3 Mechanical Method
7.3.1 Filtration
7.3.2 Cyclonic Separation
7.3.3 Electromechanical Separation
7.4 Chemical Method
7.4.1 Oxidizing Biocides
7.4.2 Nonoxidizing Biocides
8 Market, By Capacity (Page No. - 58)
8.1 Introduction
8.2 Ballast Water Treatment Market Systems With Capacity Less Than 1500m3
8.3 BWT Systems With 1500�5000m3 Capacity
8.4 BWT Systems With Capacity More Than 5000m3
9 Ballast Water Treatment Market, By Ship Type (Page No. - 64)
9.1 Introduction
9.2 Container Ships
9.3 Dry Bulk Carriers
9.4 Tankers
9.5 General Cargos
9.6 Others
10 BWT Market, By Service (Page No. - 72)
10.1 Introduction
10.2 Installation and Calibration
10.3 Performance Measurement
10.4 Recommissioning
11 BWT Market, By Geography (Page No. - 77)
11.1 Introduction
11.2 North America
11.2.1 U.S.
11.2.2 Canada
11.3 Europe
11.3.1 Greece
11.3.2 U.K.
11.3.3 Germany
11.3.4 Norway
11.3.5 Rest of Europe
11.4 APAC
11.4.1 Japan
11.4.2 China
11.4.3 Singapore
11.4.4 South Korea
11.4.5 RoAPAC
11.5 RoW
11.5.1 Latin America
11.5.2 Middle East and Africa
12 Competitive Landscape (Page No. - 112)
12.1 Overview
12.2 Market Ranking Analysis: BWT Market
12.3 Start-Up Scenario
12.3.1 Start-Up Company Investors
12.4 Competitive Situation
12.4.1 Acquisitions
12.4.2 Partnerships, Contracts, and Agreements
12.4.3 New Product Launches
13 Company Profiles (Page No. - 121)
(Business Overview, Products & Services, Key Insights, Recent Developments, SWOT Analysis, Ratio Analysis, MnM View)*
13.1 Introduction
13.2 W�rtsil� Corporation
13.3 Calgon Carbon Corporation
13.4 Alfa Laval AB
13.5 Xylem Inc.
13.6 Evoqua Water Technologies LLC
13.7 Veolia Environnement S.A.
13.8 Mitsubishi Heavy Industries, Ltd.
13.9 Ecochlor, Inc.
13.10 ATG UV Technology Ltd
13.11 Qingdao Headway Technology Co., Ltd.
13.12 Jfe Engineering Corporation
13.13 Optimarin as
13.14 Trojan Marinex
13.15 Key Innovators
13.15.1 Damen Shipyards Group
13.15.2 Ballast Water Containers Ltd
13.15.3 Biolargo Maritime Solutions, Inc.
*Details on Business Overview, Products & Services, Key Insights, Recent Developments, SWOT Analysis, MnM View Might Not Be Captured in Case of Unlisted Companies.
14 Appendix (Page No. - 152)
14.1 Insights of Industry Experts
14.2 Discussion Guide
14.3 Knowledge Store: Marketsandmarkets� Subscription Portal
14.4 Introducing RT: Real-Time Market Intelligence
14.5 Available Customizations
14.6 Related Reports
14.7 Author Details
List of Tables (79 Tables)
Table 1 IMO Conventions
Table 2 Ballast Water Treatment Market, By Technology, 2014�2022 (USD Billion)
Table 3 Advantages and Disadvantages of UV Light
Table 4 Advantages and Disadvantages of Electromechanical Separation
Table 5 Advantages and Disadvantages of Chemical Method
Table 6 Ballast Water Treatment Market, By Capacity, 2014�2022 (USD Billion)
Table 7 BWT Systems With Capacity Less Than 1500m3, By Region, 2014�2022 (USD Billion)
Table 8 BWT Market for Systems With 1500 M3 to 5000 M3 Capacity, By Region, 2014�2022 (USD Billion)
Table 9 BWT Market for Systems With Capacity of More Than 5000m3, By Region, 2014�2022 (USD Billion)
Table 10 BWT Market, By Type, 2014�2022 (USD Billion)
Table 11 BWT Market for Container Ships, By Region, 2014�2022 (USD Billion)
Table 12 BWT Market for Dry Bulk Carriers, By Region, 2014�2022 (USD Billion)
Table 13 Ballast Water Treatment Market for Tankers, By Region, 2014�2022 (USD Billion)
Table 14 BWT Market for General Cargo Ships, By Region, 2014�2022 (USD Million)
Table 15 BWT Market for Other Ship Types, By Region, 2014�2022 (USD Million)
Table 16 BWT Market, By Service, 2014�2022 (USD Billion)
Table 17 BWT Market for Installation and Calibration Service, By Region, 2014�2022 (USD Billion)
Table 18 BWT Market for Performance Measurement Service, By Region, 2014�2022 (USD Billion)
Table 19 Ballast Water Treatment Market for Recommissioning Service, By Region, 2014�2022 (USD Billion)
Table 20 BWT Market, By Region, 2014�2022 (USD Billion)
Table 21 BWT Market in North America, By Country, 2014�2022 (USD Billion)
Table 22 BWT Market in North America, By Ship Type, 2014�2022 (USD Billion)
Table 23 BWT Market in North America, By Capacity, 2014�2022 (USD Billion)
Table 24 BWT Market in North America, By Service, 2014�2022 (USD Billion)
Table 25 BWT Market in U.S., By Ship Type, 2014�2022 (USD Billion)
Table 26 Ballast Water Treatment Market in U.S., By Capacity, 2014�2022 (USD Billion)
Table 27 BWT Market in U.S., By Service, 2014�2022 (USD Billion)
Table 28 BWT Market in Canada, By Ship Type, 2014�2022 (USD Billion)
Table 29 BWT Market in Canada, By Capacity, 2014�2022 (USD Billion)
Table 30 BWT Market in Canada, By Service, 2014�2022 (USD Billion)
Table 31 BWT Market in Europe, By Country, 2014�2022 (USD Billion)
Table 32 BWT Market in Europe, By Ship Type, 2014�2022 (USD Billion)
Table 33 Ballast Water Treatment Market in Europe, By Capacity, 2014�2022 (USD Billion)
Table 34 BWT Market in Europe, By Service, 2014�2022 (USD Billion)
Table 35 BWT Market in Greece, By Ship Type, 2014�2022 (USD Billion)
Table 36 BWT Market in Greece, By Capacity, 2014�2022 (USD Billion)
Table 37 BWT Market in Greece, By Service, 2014�2022 (USD Billion)
Table 38 BWT Market in U.K., By Ship Type, 2014�2022 (USD Million)
Table 39 BWT Market in U.K., By Capacity, 2014�2022 (USD Billion)
Table 40 Ballast Water Treatment Market in U.K., By Service, 2014�2022 (USD Billion)
Table 41 BWT Market in Germany, By Ship Type, 2014�2022 (USD Billion)
Table 42 BWT Market in Germany, By Capacity, 2014�2022 (USD Billion)
Table 43 BWT Market in Germany, By Service, 2014�2022 (USD Billion)
Table 44 BWT Market in Norway, By Ship Type, 2014�2022 (USD Million)
Table 45 BWT Market in Norway, By Capacity, 2014�2022 (USD Billion)
Table 46 BWT Market in Norway, By Service, 2014�2022 (USD Million)
Table 47 BWT Market in Rest of Europe, By Ship Type, 2014�2022 (USD Million)
Table 48 BWT Market in Rest of Europe, By Capacity, 2014�2022 (USD Billion)
Table 49 Ballast Water Treatment Market in Rest of Europe, By Service, 2014�2022 (USD Million)
Table 50 BWT Market in APAC, By Ship Type, 2014�2022 (USD Million)
Table 51 BWT Market in APAC, By Capacity, 2014�2022 (USD Million)
Table 52 BWT Market in APAC, By Service, 2014�2022 (USD Million)
Table 53 BWT Market in Japan, By Ship Type, 2014�2022 (USD Million)
Table 54 BWT Market in Japan, By Capacity, 2014�2022 (USD Million)
Table 55 BWT Market in Japan, By Service, 2014�2022 (USD Million)
Table 56 BWT Market in China, By Ship Type, 2014�2022 (USD Million)
Table 57 BWT Market in China, By Capacity, 2014�2022 (USD Million)
Table 58 Ballast Water Treatment Market in China, By Service, 2014�2022 (USD Million)
Table 59 BWT Market in Singapore, By Ship Type, 2014�2022 (USD Million)
Table 60 BWT Market in Singapore, By Capacity, 2014�2022 (USD Million)
Table 61 BWT Market in Singapore, By Service, 2014�2022 (USD Million)
Table 62 BWT Market in South Korea, By Ship Type, 2014�2022 (USD Million)
Table 63 BWT Market in South Korea, By Capacity, 2014�2022 (USD Million)
Table 64 BWT Market in South Korea, By Service, 2014�2022 (USD Million)
Table 65 BWT Market in RoAPAC, By Ship Type, 2014�2022 (USD Million)
Table 66 BWT Market in RoAPAC, By Capacity, 2014�2022 (USD Million)
Table 67 BWT Market in RoAPAC, By Service, 2014�2022 (USD Million)
Table 68 Ballast Water Treatment Market in RoW, By Region, 2014�2022 (USD Million)
Table 69 BWT Market in Latin America, By Ship Type, 2014�2022 (USD Million)
Table 70 BWT Market in Latin America, By Capacity, 2014�2022 (USD Million)
Table 71 BWT Market in Latin America, By Service, 2014�2022 (USD Million)
Table 72 BWT Market in MEA, By Ship Type, 2014�2022 (USD Million)
Table 73 BWT Market in MEA, By Capacity, 2014�2022 (USD Million)
Table 74 BWT Market in MEA, By Service, 2014�2022 (USD Million)
Table 75 Ballast Water Treatment Market : Ranking Analysis
Table 76 Start-Up Companies
Table 77 Acquisitions, 2014�2016
Table 78 Partnerships, Contracts, and Agreements, 2014�2016
Table 79 New Product Launches, 2014�2016
List of Figures (53 Figures)
Figure 1 BWT Market Segmentation
Figure 2 BWT Market: Research Design
Figure 3 Breakdown of Primaries
Figure 4 BWT Market Size Estimation Methodology: Bottom-Up Approach
Figure 5 BWT Market Size Estimation Methodology: Top-Down Approach
Figure 6 Data Triangulation
Figure 7 Container Ships Expected to Hold the Largest Size of the BWT Market During the Forecast Period
Figure 8 BWT Market for Performance Measurement Service Expected to Grow at the Highest Rate During the Forecast Period
Figure 9 BWT Market, By Technology, 2017-2022
Figure 10 APAC Accounted for the Largest Share of the BWT Market in 2016
Figure 11 BWT Market in APAC Expected to Grow at the Highest Rate Between 2017 and 2022
Figure 12 BWT Market for Tankers Expected to Grow at the Highest Rate Between 2017 and 2022
Figure 13 APAC Expected to Hold the Largest Share of the BWT Market in 2017
Figure 14 BWT Systems With More Than 5,000 M3 Capacity Expected to Hold the Largest Share of the Market During the Forecast Period
Figure 15 U.S. Expected to Hold the Largest Share of the BWT Market in 2017
Figure 16 BWT Market, Geographic Analysis
Figure 17 Increasing Rate of Bioinvasion Drives the Growth of the BWT Market
Figure 18 Ballast Water Treatment Market : Major Value Addition During the Manufacturing and Assembly Phase and Post-Sales Services Phase
Figure 19 Porter�s Five Forces Analysis: BWT Market
Figure 20 Porter�s Analysis: BWT Market, 2016
Figure 21 Government/Regulatory Environment Increased the Impact of Threat of New Entrants
Figure 22 Product Differentiation Mainly Affected the Impact of Threat of New Substitutes
Figure 23 Supplier Concentration and Threat of Forward Integration Governed the Impact of Bargaining Power of Suppliers
Figure 24 Low Impact of Bargaining Power of Buyers on the BWT Market
Figure 25 Presence of Large Number of Firms Makes the Intensity of Competitive Rivalry High
Figure 26 BWT Market, By Technology
Figure 27 Physical Disinfection Method for BWT
Figure 28 Ballast Water Treatment Market, By Capacity
Figure 29 The Market for BWT Systems With More Than 5000m3 Capacity Expected to Grow at the Highest Rate During the Forecast Period
Figure 30 BWT Market for Systems With Capacity More Than 5000m3 Expected to Grow at the Highest Rate During the Forecast Period
Figure 31 BWT Market, By Ship Type
Figure 32 Container Ships Expected to Hold the Largest Size of the BWT Market During the Forecast Period
Figure 33 BWT Market in APAC for Container Ships is Expected to Grow at the Fastest Rate During the Forecast Period
Figure 34 BWT Market, By Service
Figure 35 Geographic Snapshot (2016): APAC is Expected to Witness Significant Growth During the Forecast Period
Figure 36 BWT Market Snapshot: North America
Figure 37 BWT Market Snapshot: Europe
Figure 38 BWT Market Snapshot: APAC
Figure 39 Acquisitions as Key Growth Strategies Adopted By the Companies (2014�2016)
Figure 40 Partnerships, Contracts, and Agreements, & Acquisitions Fueled the Market Growth From 2015 to 2016
Figure 41 Battle for Market Share: Acquisitions, and Agreements, Contracts, and Partnerships as the Key Strategies Adopted, 2015 & 2016
Figure 42 Geographic Revenue Mix of the Major Market Players
Figure 43 W�rtsil�: Company Snapshot
Figure 44 W�rtsil� Corporation : SWOT Analysis
Figure 45 Calgon Carbon Corporation .: Company Snapshot
Figure 46 Calgon Carbon Corporation: SWOT Analysis
Figure 47 Alfa Laval AB: Company Snapshot
Figure 48 Alfa Laval AB: SWOT Analysis
Figure 49 Xylem Inc.: Company Snapshot
Figure 50 Xylem Inc.: SWOT Analysis
Figure 51 Evoqua Water Technologies LLC.: SWOT Analysis
Figure 52 Veolia Environnement S.A.: Company Snapshot
Figure 53 Mitsubishi Heavy Industries, Ltd.: Company Snapshot


Growth opportunities and latent adjacency in Ballast Water Treatment Market