Blood Screening Market

Blood Screening Market by Product (Reagent & Kits, Instrument, Software), Technology (NAT, (Real-Time PCR), ELISA (Chemiluminescence Immunoassay), Rapid Test, Western Blot), End User (Blood Bank, Hospital), & Region - Global Forecast to 2028

Report Code: MD 3687 Sep, 2023, by marketsandmarkets.com

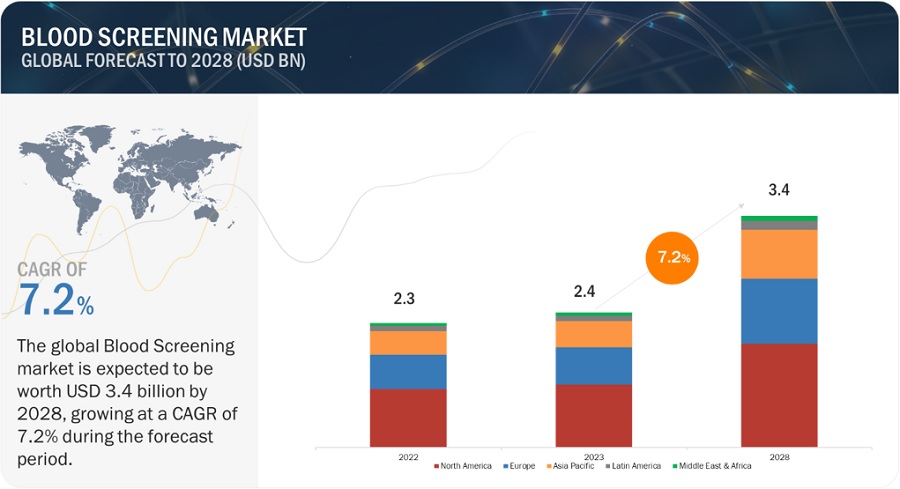
The global blood screening market in terms of revenue was estimated to be worth $2.4 billion in 2023 and is poised to reach $3.4 billion by 2028, growing at a CAGR of 7.2% from 2023 to 2028. The new research study consists of an industry trend analysis of the market. The new research study consists of industry trends, pricing analysis, patent analysis, conference and webinar materials, key stakeholders, and buying behaviour in the market. The need for blood is ever-increasing, forcing the number of blood donations to rise as well throughout the world. Combining this factor along with the growing infectious diseases is the major contributor for the growing blood screening market.

On the other hand, the unfavorable reimbursement scenario and the high cost of instruments and kits may restrain the growth of this market to a certain extent.
Blood Screening Market

To know about the assumptions considered for the study, Request for Free Sample Report
Blood Screening Market

Blood screening Market Dynamics

Driver: Increasing number of blood donations worldwide

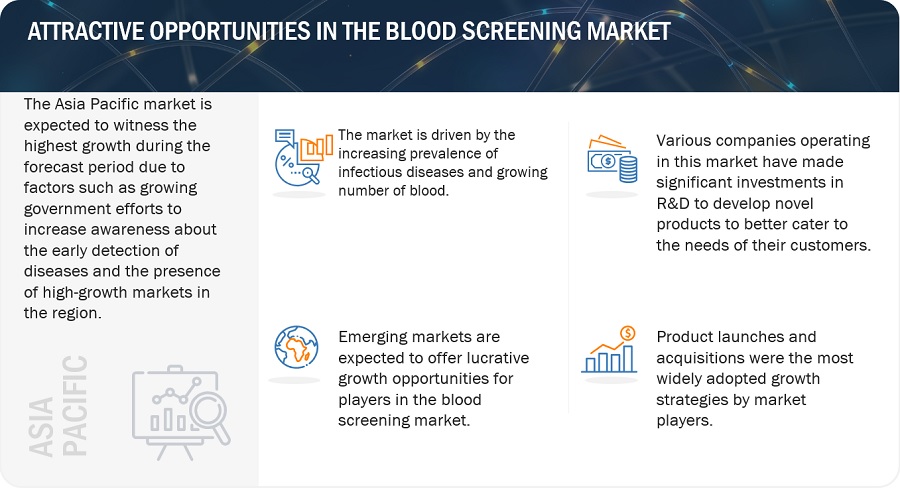
Advancements in healthcare systems and the availability of and the need for sophisticated surgical procedures, such as cardiovascular & transplant surgery, trauma care, and therapy for cancer and blood diseases, blood transfusions, etc has caused an increase in need for donated blood. On average, globally around 235 million major surgeries are being performed every year, of which 63 million are traumatic surgeries, cancer-related are over 31 million, and 10 million are related to pregnancy complications. Blood transfusion is usually prescribed in cases like complicated childbirths to prepare for childhood congenital maternal blood disorders, acute anemia, and trauma.

Opportunity: Emerging markets

India, the Middle East and Africa are emerging markets where players in the blood screening industry can benefit from rising disposable incomes and improved healthcare infrastructures. For example, in 2020, India’s healthcare sector was worth about USD 280 billion and is expected to grow to USD 372 billion in 2022 due to increasing income levels, growing awareness of physical well-being and rising prevalence of lifestyle diseases. Currently, ELISA is the most popular technology in India because NAT has relatively low penetration in India. In contrast, in India, NAT is not mandatory. Currently, NAT is used by nearly 120 blood banks in ID-NAT format, while around 40 blood banks use pooling technique. As a result, the Indian government has launched an initiative to educate doctors, hospitals and blood banks on the use of NAT.

Restraint: Alternative technologies

Computerized immunoassays are a one-step answer for single-particle location without requiring washing steps in view of ELISA utilizing a variety of femtoliter-sized wells. In this measure, a biomarker particle is formed with an immunizer covered with attractive microparticle cultivated in a well, enhanced by means of an enzymatic response, and distinguished with fluorescence. These tests have seen huge interest due to the earnest also, always expanding interest for serological Coronavirus counter acting agent tests that are modest, fast, straightforward, profoundly touchy, quantitative, and insignificantly obtrusive. Consequently, a solitary step, sans wash immunoassay for quick and exceptionally delicate quantitative investigation of human serological gG against SARS-CoV-2 has been created, which requires just a solitary bead of serum.

Challenge: High cost of blood screening technologies

With the increasing number of blood donations, awareness of blood verification & safety, and spending on healthcare around the world, more advanced technologies are widely used in high income countries and will be widely adopted in middle and low-income countries within the next 10 years. However, most developing countries, including India and China currently use ELISA. The growth of the market for blood screening for NAT is severely inhibited in the present timeframe. The high cost of advanced tests has led to the increased use of first-generation ELISA, which is older and less effective tests. This test is used in many countries around the world despite the limitations of the test. For example, the global donor supported cost of USD. GeneXpert MB / RIF cartridge is considered to be prohibitively expensive for most low and middle income countries (MIC).

Blood screening Ecosystem/Market Map
Blood Screening Market Ecosystem

In 2022, reagents & kits segment accounted for the largest share of the blood screening industry, by product & service.

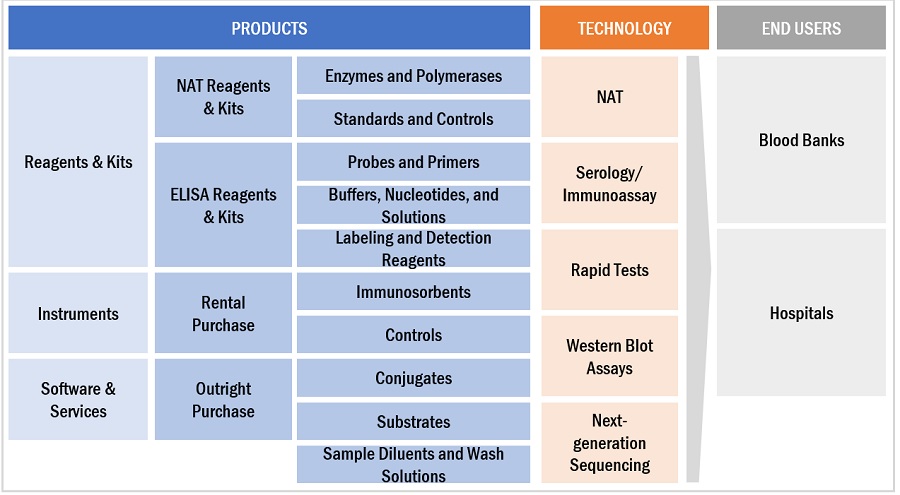
The blood screening market is divided into reagents and kits, tools, and software and services. Reagents and kits made up the biggest chunk of the market in 2022. This is mainly because there's been an increase in blood transfusions, which means more and more people are using reagents and kits.

In 2022, nucleic acid test segment accounted for the largest share in the blood screening industry, by technology.

The blood screening market is segmented into nucleic acid test (NAT), serology/immunoassay, rapid tests, western blot assays, and next-generation sequencing (NGS). The nucleic acid test segment dominated the blood screening market in 2022 due to an increase in adoption of NAT technology, which is more sensitive than other blood screening technologies, and an increase in the number of blood donations.

In 2022, blood banks and hospitals segment accounted for the largest share in the blood screening industry, by end user.

Blood banks and hospitals are the two main segments in the blood screening market, and the blood banks segment had the biggest market share in 2022. This is because more and more people are getting organ transplants.

North America is the largest regional market for blood screening industry

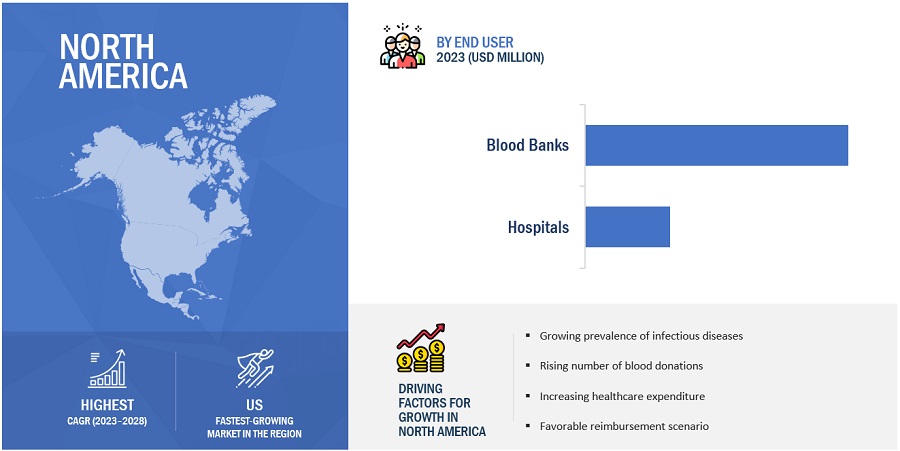
There are five main regions in the world where blood screening is available. North America is the biggest one, with a share of the market in 2022. This is due to the rising cost of healthcare, the rise in chronic conditions, and the fact that the US has a really well-developed healthcare system.
Blood Screening Market by Region

To know about the assumptions considered for the study, download the pdf brochure

The major players in this market are F. Hoffmann-La Roche Ltd. (Switzerland), Grifols (Spain), Abbott Laboratories, Inc. (US), Bio-Rad Laboratories, Inc. (US), Danaher (Beckman Coulter, Inc.) (US), bioMérieux (France), Hologic (US), Thermo Fisher Scientific, Inc. (US), Becton, Dickinson and Company (US), DiaSorin (Italy). The market leadership of these players stems from their comprehensive product portfolios and expanding global footprint. These dominant market players possess several advantages, including strong marketing and distribution networks, substantial research and development budgets, and well-established brand recognition.

Scope of the Blood Screening Industry:

Report Metric

Details

Market Revenue in 2023

$2.4 billion

Estimated Value by 2028

$3.4 billion

Revenue Rate

Poised to grow at a CAGR of 7.2%

Market Driver

Increasing number of blood donations worldwide

Market Opportunity

Emerging markets

This report categorizes the Blood screening market to forecast revenue and analyze trends in each of the following submarkets:

By Product & Service

  • Reagents & Kits
    • NAT Reagents & Kits
      • Enzymes & Polymerases
      • Standards & Controls
      • Probes & Primers
      • Buffers, Nucleotides, and Solutions
      • Labeling & Detection Reagents
    • ELISA Reagents & Kits
      • Immunosorbents
      • Controls
      • Conjugates
      • Substrates
      • Sample Diluents & Wash Solutions
    • Other Reagents & Kits
  • Instruments
    • Rental Purchase
    • Outright Purchase
  • Software & Services

By Technology

  • Nucleic Acid Test
  • Transcription-mediated Amplification
  • Real-time PCR
  • Serology/Immunoassay
  • Chemiluminescent Immunoassays
  • Fluorescent Immunoassays
  • Colorimetric Immunoassays/ELISA
  • Rapid Tests
  • Western Blot Assays
  • Next-generation Sequencing

By End User

  • Blood Banks
  • Hospitals

By Region

  • North America
    • US
    • Canada
  • Europe
    • Germany
    • UK
    • France
    • Italy
    • Spain
    • Rest of Europe
  • Asia Pacific
    • China
    • Japan
    • India
    • Australia
    • Rest of Asia Pacific
  • Latin America
    • Brazil
    • Mexico
    • Rest of Latin America
  • Middle East & Africa

Recent Developments of Blood Screening Industry

  • In February 2023, Thermo Fisher Scientific Inc. (US) acquired TIB Molbiol (Germany), to expand its PCR test portfolio with a wide range of assays for infectious diseases.
  • In December 2021, Hologic, Inc. (US) launched Panther Trax for high-volume molecular testing.
  • In May 2021, Beckmann Coulter (US) launched SARS-CoV-2 IgG.
  • In September 2021, Roche Diagnostics (Switzerland) acquired TIB Molbiol Group (Germany). This acquisition will enhance Roche’s broad portfolio of molecular diagnostics solutions with a wide range of assays for infectious diseases, such as identifying SARS-CoV-2 variants.

Frequently Asked Questions (FAQ):

To speak to our analyst for a discussion on the above findings, click Speak to Analyst

TABLE OF CONTENTS
 
1 INTRODUCTION (Page No. - 33)
    1.1 STUDY OBJECTIVES 
    1.2 MARKET DEFINITION 
           1.2.1 INCLUSIONS AND EXCLUSIONS
    1.3 MARKET SCOPE 
           1.3.1 BLOOD SCREENING MARKET
           1.3.2 REGIONS COVERED
    1.4 YEARS CONSIDERED 
    1.5 CURRENCY CONSIDERED 
    1.6 LIMITATIONS 
    1.7 STAKEHOLDERS 
    1.8 SUMMARY OF CHANGES 
    1.9 RECESSION IMPACT 
 
2 RESEARCH METHODOLOGY (Page No. - 39)
    2.1 RESEARCH DATA 
    2.2 RESEARCH APPROACH 
          FIGURE 1 BLOOD SCREENING MARKET: RESEARCH DESIGN METHODOLOGY
           2.2.1 SECONDARY DATA
                    2.2.1.1 Key data from secondary sources
           2.2.2 PRIMARY DATA
                    2.2.2.1 Primary sources
                    2.2.2.2 Key data from primary sources
                    2.2.2.3 Key industry insights
                    2.2.2.4 Breakdown of primary interviews
                                FIGURE 2 BREAKDOWN OF PRIMARY INTERVIEWS: SUPPLY-SIDE AND DEMAND-SIDE PARTICIPANTS
                                FIGURE 3 BREAKDOWN OF PRIMARY INTERVIEWS: BY COMPANY TYPE, DESIGNATION, AND REGION
    2.3 MARKET SIZE ESTIMATION 
           2.3.1 BOTTOM-UP APPROACH
                    2.3.1.1 Approach 1: Company revenue estimation approach
                                FIGURE 4 BOTTOM-UP APPROACH: COMPANY REVENUE ESTIMATION APPROACH
                    2.3.1.2 Approach 2: Presentations of companies and primary interviews
                    2.3.1.3 Growth forecast
                    2.3.1.4 CAGR projections
                                FIGURE 5 CAGR PROJECTIONS: SUPPLY-SIDE ANALYSIS
           2.3.2 TOP-DOWN APPROACH
                    FIGURE 6 BLOOD SCREENING MARKET: TOP-DOWN APPROACH
    2.4 MARKET BREAKDOWN AND DATA TRIANGULATION 
          FIGURE 7 DATA TRIANGULATION METHODOLOGY
    2.5 MARKET SHARE ANALYSIS 
    2.6 STUDY ASSUMPTIONS 
    2.7 GROWTH RATE ASSUMPTIONS 
    2.8 RISK ASSESSMENT 
           2.8.1 RISK ASSESSMENT ANALYSIS
    2.9 RECESSION IMPACT ANALYSIS 
 
3 EXECUTIVE SUMMARY (Page No. - 52)
    FIGURE 8 BLOOD SCREENING MARKET, BY PRODUCT & SERVICE, 2023 VS. 2028 (USD MILLION)
    FIGURE 9 BLOOD SCREENING MARKET, BY TECHNOLOGY, 2023 VS. 2028 (USD MILLION)
    FIGURE 10 BLOOD SCREENING MARKET, BY END USER, 2023 VS. 2028 (USD MILLION)
    FIGURE 11 BLOOD SCREENING MARKET, BY REGION, 2023 VS. 2028 (USD MILLION)
 
4 PREMIUM INSIGHTS (Page No. - 55)
    4.1 BLOOD SCREENING MARKET OVERVIEW 
          FIGURE 12 INCREASING NUMBER OF BLOOD DONATIONS TO DRIVE MARKET GROWTH DURING FORECAST PERIOD
    4.2 BLOOD SCREENING MARKET, BY PRODUCT & SERVICE, 2023 VS. 2028 
          FIGURE 13 REAGENTS & KITS SEGMENT TO DOMINATE MARKET DURING FORECAST PERIOD
    4.3 BLOOD SCREENING MARKET, BY TECHNOLOGY, 2023 VS. 2028 
          FIGURE 14 NUCLEIC ACID TESTS SEGMENT TO DOMINATE MARKET DURING FORECAST PERIOD
    4.4 BLOOD SCREENING MARKET, BY END USER, 2023 VS. 2028 
          FIGURE 15 BLOOD BANKS SEGMENT TO DOMINATE MARKET DURING FORECAST PERIOD
    4.5 BLOOD SCREENING MARKET: GEOGRAPHICAL GROWTH OPPORTUNITIES 
          FIGURE 16 ASIA PACIFIC REGION TO REGISTER HIGHEST GROWTH RATE FROM 2023 TO 2028
 
5 MARKET OVERVIEW (Page No. - 58)
    5.1 INTRODUCTION 
    5.2 MARKET DYNAMICS 
          FIGURE 17 BLOOD SCREENING MARKET: DRIVERS, RESTRAINTS, OPPORTUNITIES, AND CHALLENGES
           5.2.1 DRIVERS
                    5.2.1.1 Increasing blood donations
                    5.2.1.2 Rising prevalence of infectious diseases
           5.2.2 RESTRAINTS
                    5.2.2.1 High cost of blood screening technologies
           5.2.3 OPPORTUNITIES
                    5.2.3.1 Rising technological advancements
                    5.2.3.2 High growth potential of emerging economies
           5.2.4 CHALLENGES
                    5.2.4.1 Usage of low-sensitivity screening tests
                    5.2.4.2 Shortage of skilled laboratory technicians
    5.3 PRICING ANALYSIS 
           5.3.1 PRICING MODEL ANALYSIS
                    TABLE 1 INDICATIVE PRICING ANALYSIS FOR BLOOD SCREENING PRODUCTS
           5.3.2 AVERAGE SELLING PRICE TREND
                    TABLE 2 AVERAGE SELLING PRICE ANALYSIS OF BLOOD SCREENING PRODUCTS
           5.3.3 AVERAGE SELLING PRICE OF BLOOD SCREENING PRODUCTS, BY KEY PLAYER
                    TABLE 3 AVERAGE SELLING PRICE OF BLOOD SCREENING PRODUCTS
    5.4 PATENT ANALYSIS 
           5.4.1 PATENT ANALYSIS OF NUCLEIC ACID AMPLIFICATION TECHNOLOGIES
           5.4.2 BLOOD SCREENING MARKET: LIST OF MAJOR PATENTS
    5.5 VALUE CHAIN ANALYSIS 
          FIGURE 18 MAJOR VALUE ADDED DURING MANUFACTURING & ASSEMBLY PHASE
    5.6 SUPPLY CHAIN ANALYSIS 
          FIGURE 19 BLOOD SCREENING MARKET: SUPPLY CHAIN ANALYSIS
    5.7 ECOSYSTEM ANALYSIS 
          FIGURE 20 BLOOD SCREENING MARKET: ECOSYSTEM MAP
           5.7.1 BLOOD SCREENING MARKET: ECOSYSTEM ROLE
    5.8 PORTER’S FIVE FORCES ANALYSIS 
          TABLE 4 BLOOD SCREENING MARKET: PORTER’S FIVE FORCES ANALYSIS
           5.8.1 THREAT OF NEW ENTRANTS
           5.8.2 THREAT OF SUBSTITUTES
           5.8.3 BARGAINING POWER OF BUYERS
           5.8.4 BARGAINING POWER OF SUPPLIERS
           5.8.5 INTENSITY OF COMPETITIVE RIVALRY
    5.9 REGULATORY LANDSCAPE 
          TABLE 5 NORTH AMERICA: LIST OF REGULATORY BODIES, GOVERNMENT AGENCIES, AND OTHER ORGANIZATIONS
          TABLE 6 ASIA PACIFIC: LIST OF REGULATORY BODIES, GOVERNMENT AGENCIES, AND OTHER ORGANIZATIONS
          TABLE 7 LATIN AMERICA: LIST OF REGULATORY BODIES, GOVERNMENT AGENCIES, AND OTHER ORGANIZATIONS
          TABLE 8 REST OF THE WORLD: LIST OF REGULATORY BODIES, GOVERNMENT AGENCIES, AND OTHER ORGANIZATIONS
           5.9.1 NORTH AMERICA
                    5.9.1.1 US
                    5.9.1.2 Canada
           5.9.2 EUROPE
                    TABLE 9 EUROPE: CLASSIFICATION OF DEVICES
           5.9.3 ASIA PACIFIC
                    5.9.3.1 China
                    5.9.3.2 Japan
                                TABLE 10 JAPAN: TIME, COST, AND COMPLEXITY OF REGISTRATION PROCESS
                    5.9.3.3 India
           5.9.4 LATIN AMERICA
                    5.9.4.1 Brazil
           5.9.5 MIDDLE EAST
    5.10 TRADE ANALYSIS 
           5.10.1 TRADE ANALYSIS FOR DIAGNOSTIC AND LABORATORY REAGENTS
                     TABLE 11 IMPORT DATA FOR DIAGNOSTIC AND LABORATORY REAGENTS, BY COUNTRY, 2018–2022 (USD MILLION)
                     TABLE 12 EXPORT DATA FOR DIAGNOSTIC AND LABORATORY REAGENTS, BY COUNTRY, 2018–2022 (USD MILLION)
    5.11 TECHNOLOGY ANALYSIS 
    5.12 KEY CONFERENCES AND EVENTS 
           TABLE 13 BLOOD SCREENING MARKET: DETAILED LIST OF CONFERENCES AND EVENTS (2023 −2024)
    5.13 PESTLE ANALYSIS 
    5.14 TRENDS/DISRUPTIONS IMPACTING CUSTOMERS’ BUSINESSES 
           5.14.1 REVENUE SHIFT IN BLOOD SCREENING MARKET
    5.15 KEY STAKEHOLDERS AND BUYING CRITERIA 
           5.15.1 KEY STAKEHOLDERS IN BUYING PROCESS
                     FIGURE 21 INFLUENCE OF STAKEHOLDERS ON BUYING PROCESS FOR BLOOD SCREENING PRODUCTS
                     TABLE 14 INFLUENCE OF STAKEHOLDERS ON BUYING PROCESS FOR BLOOD SCREENING PRODUCTS (%)
           5.15.2 BUYING CRITERIA
                     FIGURE 22 KEY BUYING CRITERIA FOR BLOOD SCREENING PRODUCTS
                     TABLE 15 KEY BUYING CRITERIA, BY PRODUCT & SERVICE
    5.16 CASE STUDY ANALYSIS 
           5.16.1 CASE STUDY 1: OPTIMIZATION OF HBSAG QUANTITATIVE ELISA
           5.16.2 CASE STUDY 2: CLINICAL EFFICACY OF NAT WITH ELISA
 
6 BLOOD SCREENING MARKET, BY PRODUCT & SERVICE (Page No. - 82)
    6.1 INTRODUCTION 
          TABLE 16 BLOOD SCREENING MARKET, BY PRODUCT & SERVICE, 2021–2028 (USD MILLION)
    6.2 REAGENTS & KITS 
          TABLE 17 KEY PRODUCTS FOR REAGENTS & KITS
          TABLE 18 BLOOD SCREENING MARKET FOR REAGENTS & KITS, BY REGION, 2021–2028 (USD MILLION)
          TABLE 19 BLOOD SCREENING MARKET FOR REAGENTS & KITS, BY TYPE, 2021–2028 (USD MILLION)
           6.2.1 NAT REAGENTS & KITS
                    6.2.1.1 High sensitivity to drive market
                                TABLE 20 KEY PRODUCTS FOR NAT REAGENTS & KITS
                                TABLE 21 BLOOD SCREENING MARKET FOR NAT REAGENTS & KITS, BY REGION, 2021–2028 (USD MILLION)
                                TABLE 22 BLOOD SCREENING MARKET FOR NAT REAGENTS & KITS, BY TYPE, 2021–2028 (USD MILLION)
           6.2.2 ELISA REAGENTS & KITS
                    6.2.2.1 Ease of use and cost-effectiveness to drive market
                                TABLE 23 KEY PRODUCTS FOR ELISA REAGENTS & KITS
                                TABLE 24 BLOOD SCREENING MARKET FOR ELISA REAGENTS & KITS, BY REGION, 2021–2028 (USD MILLION)
                                TABLE 25 BLOOD SCREENING MARKET FOR ELISA REAGENTS & KITS, BY TYPE, 2021–2028 (USD MILLION)
           6.2.3 OTHER REAGENTS & KITS
                    TABLE 26 KEY PRODUCTS FOR OTHER REAGENTS & KITS
                    TABLE 27 BLOOD SCREENING MARKET FOR OTHER REAGENTS & KITS, BY REGION, 2021–2028 (USD MILLION)
    6.3 INSTRUMENTS 
          TABLE 28 KEY PRODUCTS FOR INSTRUMENTS
          TABLE 29 BLOOD SCREENING MARKET FOR INSTRUMENTS, BY REGION, 2021–2028 (USD MILLION)
          TABLE 30 BLOOD SCREENING MARKET FOR INSTRUMENTS, BY PURCHASE TYPE, 2021–2028 (USD MILLION)
           6.3.1 RENTAL PURCHASE
                    6.3.1.1 Reduced liability with limited financial losses to propel market
                                TABLE 31 BLOOD SCREENING MARKET FOR RENTAL PURCHASE INSTRUMENTS, BY REGION, 2021–2028 (USD MILLION)
           6.3.2 OUTRIGHT PURCHASE
                    6.3.2.1 Availability of government support to drive market
                                TABLE 32 BLOOD SCREENING MARKET FOR OUTRIGHT PURCHASE INSTRUMENTS, BY REGION, 2021–2028 (USD MILLION)
    6.4 SOFTWARE & SERVICES 
           6.4.1 RISING DEMAND ACROSS EMERGING ECONOMIES TO SUPPORT MARKET GROWTH
                    TABLE 33 KEY PRODUCTS FOR SOFTWARE & SERVICES
                    TABLE 34 BLOOD SCREENING MARKET FOR SOFTWARE & SERVICES, BY REGION, 2021–2028 (USD MILLION)
 
7 BLOOD SCREENING MARKET, BY TECHNOLOGY (Page No. - 96)
    7.1 INTRODUCTION 
          TABLE 35 BLOOD SCREENING MARKET, BY TECHNOLOGY, 2021–2028 (USD MILLION)
    7.2 NUCLEIC ACID TESTS (NAT) 
          TABLE 36 KEY PRODUCTS IN NAT MARKET
          TABLE 37 BLOOD SCREENING MARKET FOR NUCLEIC ACID TESTS, BY REGION, 2021–2028 (USD MILLION)
          TABLE 38 BLOOD SCREENING MARKET FOR NUCLEIC ACID TESTS, BY TYPE, 2021–2028 (USD MILLION)
           7.2.1 TRANSCRIPTION-MEDIATED AMPLIFICATION (TMA)
                    7.2.1.1 High sensitivity to support market growth
                                TABLE 39 BLOOD SCREENING MARKET FOR TMA, BY REGION, 2021–2028 (USD MILLION)
           7.2.2 REAL-TIME POLYMERASE CHAIN REACTION (RT-PCR)
                    7.2.2.1 Elimination of contamination risks to propel market
                                TABLE 40 BLOOD SCREENING MARKET FOR RT-PCR, BY REGION, 2021–2028 (USD MILLION)
    7.3 SEROLOGY/IMMUNOASSAYS 
          TABLE 41 KEY PRODUCTS FOR SEROLOGY/IMMUNOASSAYS
          TABLE 42 BLOOD SCREENING MARKET FOR SEROLOGY/IMMUNOASSAYS, BY REGION, 2021–2028 (USD MILLION)
          TABLE 43 BLOOD SCREENING MARKET FOR SEROLOGY/IMMUNOASSAYS, BY PLATFORM, 2021–2028 (USD MILLION)
           7.3.1 CHEMILUMINESCENT IMMUNOASSAYS (CLIA)
                    7.3.1.1 Ultra-sensitive and automated features to drive market
                                TABLE 44 BLOOD SCREENING MARKET FOR CHEMILUMINESCENT IMMUNOASSAYS, BY REGION, 2021–2028 (USD MILLION)
           7.3.2 FLUORESCENT IMMUNOASSAYS (FIA)
                    7.3.2.1 Rising demand for safe & stable reagents to propel market
                                TABLE 45 BLOOD SCREENING MARKET FOR FLUORESCENT IMMUNOASSAYS, BY REGION, 2021–2028 (USD MILLION)
           7.3.3 COLORIMETRIC IMMUNOASSAYS/ELISA (CI/ELISA)
                    7.3.3.1 Qualitative and quantitative antigen measurement for blood serum to drive market
                                TABLE 46 BLOOD SCREENING MARKT FOR COLORIMETRIC IMMUNOASSAYS/ELISA, BY REGION, 2021–2028 (USD MILLION)
    7.4 RAPID TESTS 
           7.4.1 HIGH EFFICIENCY IN POC DIAGNOSTICS TO PROPEL MARKET
                    TABLE 47 KEY PRODUCTS FOR RAPID TESTS
                    TABLE 48 BLOOD SCREENING MARKET FOR RAPID TESTS, BY REGION, 2021–2028 (USD MILLION)
    7.5 WESTERN BLOT ASSAYS 
           7.5.1 ABILITY TO DETECT RETROVIRUS ANTIBODIES TO DRIVE MARKET
                    TABLE 49 KEY PRODUCTS FOR WESTERN BLOT ASSAYS
                    TABLE 50 BLOOD SCREENING MARKET FOR WESTERN BLOT ASSAYS, BY REGION, 2021–2028 (USD MILLION)
    7.6 NEXT-GENERATION SEQUENCING (NGS) 
           7.6.1 EMERGING TECHNOLOGY FOR HIV TESTING TO SUPPORT MARKET GROWTH
                    TABLE 51 BLOOD SCREENING MARKET FOR NEXT-GENERATION SEQUENCING, BY REGION, 2021–2028 (USD MILLION)
 
8 BLOOD SCREENING MARKET, BY END USER (Page No. - 109)
    8.1 INTRODUCTION 
          TABLE 52 BLOOD SCREENING MARKET, BY END USER, 2021–2028 (USD MILLION)
    8.2 BLOOD BANKS 
           8.2.1 RISING INCIDENCE OF CHRONIC DISEASES TO DRIVE MARKET
                    TABLE 53 BLOOD SCREENING MARKET FOR BLOOD BANKS, BY REGION, 2021–2028 (USD MILLION)
    8.3 HOSPITALS 
           8.3.1 INCREASING SURGICAL PROCEDURES TO PROPEL MARKET
                    TABLE 54 BLOOD SCREENING MARKET FOR HOSPITALS, BY REGION, 2021–2028 (USD MILLION)
 
9 BLOOD SCREENING MARKET, BY REGION (Page No. - 113)
    9.1 INTRODUCTION 
          TABLE 55 BLOOD SCREENING MARKET, BY REGION, 2021–2028 (USD MILLION)
    9.2 NORTH AMERICA 
          FIGURE 23 NORTH AMERICA: BLOOD SCREENING MARKET SNAPSHOT
          TABLE 56 NORTH AMERICA: BLOOD SCREENING MARKET, BY COUNTRY, 2021–2028 (USD MILLION)
          TABLE 57 NORTH AMERICA: BLOOD SCREENING MARKET, BY PRODUCT & SERVICE, 2021–2028 (USD MILLION)
          TABLE 58 NORTH AMERICA: BLOOD SCREENING REAGENTS & KITS MARKET, BY TYPE, 2021–2028 (USD MILLION)
          TABLE 59 NORTH AMERICA: BLOOD SCREENING INSTRUMENTS MARKET, BY PURCHASE TYPE, 2021–2028 (USD MILLION)
          TABLE 60 NORTH AMERICA: BLOOD SCREENING MARKET, BY TECHNOLOGY, 2021–2028 (USD MILLION)
          TABLE 61 NORTH AMERICA: BLOOD SCREENING MARKET FOR NUCLEIC ACID TESTS, BY TYPE, 2021–2028 (USD MILLION)
          TABLE 62 NORTH AMERICA: BLOOD SCREENING MARKET FOR SEROLOGY/IMMUNOASSAYS, BY PLATFORM, 2021–2028 (USD MILLION)
          TABLE 63 NORTH AMERICA: BLOOD SCREENING MARKET, BY END USER, 2021–2028 (USD MILLION)
           9.2.1 NORTH AMERICA: RECESSION IMPACT
           9.2.2 US
                    9.2.2.1 Increasing prevalence of HIV and chronic diseases to drive market
                                TABLE 64 US: BLOOD SCREENING MARKET, BY PRODUCT & SERVICE, 2021–2028 (USD MILLION)
                                TABLE 65 US: BLOOD SCREENING REAGENTS & KITS MARKET, BY TYPE, 2021–2028 (USD MILLION)
                                TABLE 66 US: BLOOD SCREENING INSTRUMENTS MARKET, BY PURCHASE TYPE, 2021–2028 (USD MILLION)
                                TABLE 67 US: BLOOD SCREENING MARKET, BY TECHNOLOGY, 2021–2028 (USD MILLION)
                                TABLE 68 US: BLOOD SCREENING MARKET FOR NUCLEIC ACID TESTS, BY TYPE, 2021–2028 (USD MILLION)
                                TABLE 69 US: BLOOD SCREENING MARKET FOR SEROLOGY/IMMUNOASSAYS, BY PLATFORM, 2021–2028 (USD MILLION)
                                TABLE 70 US: BLOOD SCREENING MARKET, BY END USER, 2021–2028 (USD MILLION)
           9.2.3 CANADA
                    9.2.3.1 Rising volume of surgical procedures to drive market
                                TABLE 71 CANADA: BLOOD SCREENING MARKET, BY PRODUCT & SERVICE, 2021–2028 (USD MILLION)
                                TABLE 72 CANADA: BLOOD SCREENING REAGENTS & KITS MARKET, BY TYPE, 2021–2028 (USD MILLION)
                                TABLE 73 CANADA: BLOOD SCREENING INSTRUMENTS MARKET, BY PURCHASE TYPE, 2021–2028 (USD MILLION)
                                TABLE 74 CANADA: BLOOD SCREENING MARKET, BY TECHNOLOGY, 2021–2028 (USD MILLION)
                                TABLE 75 CANADA: BLOOD SCREENING MARKET FOR NUCLEIC ACID TESTS, BY TYPE, 2021–2028 (USD MILLION)
                                TABLE 76 CANADA: BLOOD SCREENING MARKET FOR SEROLOGY/IMMUNOASSAYS, BY PLATFORM, 2021–2028 (USD MILLION)
                                TABLE 77 CANADA: BLOOD SCREENING MARKET, BY END USER, 2021–2028 (USD MILLION)
    9.3 EUROPE 
          TABLE 78 EUROPE: BLOOD SCREENING MARKET, BY COUNTRY, 2021–2028 (USD MILLION)
          TABLE 79 EUROPE: BLOOD SCREENING MARKET, BY PRODUCT & SERVICE, 2021–2028 (USD MILLION)
          TABLE 80 EUROPE: BLOOD SCREENING REAGENTS & KITS MARKET, BY TYPE, 2021–2028 (USD MILLION)
          TABLE 81 EUROPE: BLOOD SCREENING INSTRUMENTS MARKET, BY PURCHASE TYPE, 2021–2028 (USD MILLION)
          TABLE 82 EUROPE: BLOOD SCREENING MARKET, BY TECHNOLOGY, 2021–2028 (USD MILLION)
          TABLE 83 EUROPE: BLOOD SCREENING MARKET FOR NUCLEIC ACID TESTS, BY TYPE, 2021–2028 (USD MILLION)
          TABLE 84 EUROPE: BLOOD SCREENING MARKET FOR SEROLOGY/IMMUNOASSAYS, BY PLATFORM, 2021–2028 (USD MILLION)
          TABLE 85 EUROPE: BLOOD SCREENING MARKET, BY END USER, 2021–2028 (USD MILLION)
           9.3.1 EUROPE: RECESSION IMPACT
           9.3.2 GERMANY
                    9.3.2.1 High incidence of cancer to drive market
                                TABLE 86 GERMANY: BLOOD SCREENING MARKET, BY PRODUCT & SERVICE, 2021–2028 (USD MILLION)
                                TABLE 87 GERMANY: BLOOD SCREENING REAGENTS & KITS MARKET, BY TYPE, 2021–2028 (USD MILLION)
                                TABLE 88 GERMANY: BLOOD SCREENING INSTRUMENTS MARKET, BY PURCHASE TYPE, 2021–2028 (USD MILLION)
                                TABLE 89 GERMANY: BLOOD SCREENING MARKET, BY TECHNOLOGY, 2021–2028 (USD MILLION)
                                TABLE 90 GERMANY: BLOOD SCREENING MARKET FOR NUCLEIC ACID TESTS, BY TYPE, 2021–2028 (USD MILLION)
                                TABLE 91 GERMANY: BLOOD SCREENING MARKET FOR SEROLOGY/IMMUNOASSAYS, BY PLATFORM, 2021–2028 (USD MILLION)
                                TABLE 92 GERMANY: BLOOD SCREENING MARKET, BY END USER, 2021–2028 (USD MILLION)
           9.3.3 FRANCE
                    9.3.3.1 Growing cases of HIV to propel market
                                TABLE 93 FRANCE: BLOOD SCREENING MARKET, BY PRODUCT & SERVICE, 2021–2028 (USD MILLION)
                                TABLE 94 FRANCE: BLOOD SCREENING REAGENTS & KITS MARKET, BY TYPE, 2021–2028 (USD MILLION)
                                TABLE 95 FRANCE: BLOOD SCREENING INSTRUMENTS MARKET, BY PURCHASE TYPE, 2021–2028 (USD MILLION)
                                TABLE 96 FRANCE: BLOOD SCREENING MARKET, BY TECHNOLOGY, 2021–2028 (USD MILLION)
                                TABLE 97 FRANCE: BLOOD SCREENING MARKET FOR NUCLEIC ACID TESTS, BY TYPE, 2021–2028 (USD MILLION)
                                TABLE 98 FRANCE: BLOOD SCREENING MARKET FOR SEROLOGY/IMMUNOASSAYS, BY PLATFORM, 2021–2028 (USD MILLION)
                                TABLE 99 FRANCE: BLOOD SCREENING MARKET, BY END USER, 2021–2028 (USD MILLION)
           9.3.4 UK
                    9.3.4.1 Favorable government support for infectious disease screening to drive market
                                TABLE 100 UK: BLOOD SCREENING MARKET, BY PRODUCT & SERVICE, 2021–2028 (USD MILLION)
                                TABLE 101 UK: BLOOD SCREENING REAGENTS & KITS MARKET, BY TYPE, 2021–2028 (USD MILLION)
                                TABLE 102 UK: BLOOD SCREENING INSTRUMENTS MARKET, BY PURCHASE TYPE, 2021–2028 (USD MILLION)
                                TABLE 103 UK: BLOOD SCREENING MARKET, BY TECHNOLOGY, 2021–2028 (USD MILLION)
                                TABLE 104 UK: BLOOD SCREENING MARKET FOR NUCLEIC ACID TESTS, BY TYPE, 2021–2028 (USD MILLION)
                                TABLE 105 UK: BLOOD SCREENING MARKET FOR SEROLOGY/IMMUNOASSAYS, BY PLATFORM, 2021–2028 (USD MILLION)
                                TABLE 106 UK: BLOOD SCREENING MARKET, BY END USER, 2021–2028 (USD MILLION)
           9.3.5 ITALY
                    9.3.5.1 Growing number of blood donors to support market growth
                                TABLE 107 ITALY: BLOOD SCREENING MARKET, BY PRODUCT & SERVICE, 2021–2028 (USD MILLION)
                                TABLE 108 ITALY: BLOOD SCREENING REAGENTS & KITS MARKET, BY TYPE, 2021–2028 (USD MILLION)
                                TABLE 109 ITALY: BLOOD SCREENING INSTRUMENTS MARKET, BY PURCHASE TYPE, 2021–2028 (USD MILLION)
                                TABLE 110 ITALY: BLOOD SCREENING MARKET, BY TECHNOLOGY, 2021–2028 (USD MILLION)
                                TABLE 111 ITALY: BLOOD SCREENING MARKET FOR NUCLEIC ACID TESTS, BY TYPE, 2021–2028 (USD MILLION)
                                TABLE 112 ITALY: BLOOD SCREENING MARKET FOR SEROLOGY/IMMUNOASSAYS, BY PLATFORM, 2021–2028 (USD MILLION)
                                TABLE 113 ITALY: BLOOD SCREENING MARKET, BY END USER, 2021–2028 (USD MILLION)
           9.3.6 SPAIN
                    9.3.6.1 Rising adoption of NAT technology to propel market
                                TABLE 114 SPAIN: BLOOD SCREENING MARKET, BY PRODUCT & SERVICE, 2021–2028 (USD MILLION)
                                TABLE 115 SPAIN: BLOOD SCREENING REAGENTS & KITS MARKET, BY TYPE, 2021–2028 (USD MILLION)
                                TABLE 116 SPAIN: BLOOD SCREENING INSTRUMENTS MARKET, BY PURCHASE TYPE, 2021–2028 (USD MILLION)
                                TABLE 117 SPAIN: BLOOD SCREENING MARKET, BY TECHNOLOGY, 2021–2028 (USD MILLION)
                                TABLE 118 SPAIN: BLOOD SCREENING MARKET FOR NUCLEIC ACID TESTS, BY TYPE, 2021–2028 (USD MILLION)
                                TABLE 119 SPAIN: BLOOD SCREENING MARKET FOR SEROLOGY/IMMUNOASSAYS, BY PLATFORM, 2021–2028 (USD MILLION)
                                TABLE 120 SPAIN: BLOOD SCREENING MARKET, BY END USER, 2021–2028 (USD MILLION)
           9.3.7 REST OF EUROPE
                    TABLE 121 GDP EXPENDITURE ON HEALTHCARE, BY COUNTRY (%)
                    TABLE 122 REST OF EUROPE: BLOOD SCREENING MARKET, BY PRODUCT & SERVICE, 2021–2028 (USD MILLION)
                    TABLE 123 REST OF EUROPE: BLOOD SCREENING REAGENTS & KITS MARKET, BY TYPE, 2021–2028 (USD MILLION)
                    TABLE 124 REST OF EUROPE: BLOOD SCREENING INSTRUMENTS MARKET, BY PURCHASE TYPE, 2021–2028 (USD MILLION)
                    TABLE 125 REST OF EUROPE: BLOOD SCREENING MARKET, BY TECHNOLOGY, 2021–2028 (USD MILLION)
                    TABLE 126 REST OF EUROPE: BLOOD SCREENING MARKET FOR NUCLEIC ACID TESTS, BY TYPE, 2021–2028 (USD MILLION)
                    TABLE 127 REST OF EUROPE: BLOOD SCREENING MARKET FOR SEROLOGY/IMMUNOASSAYS, BY PLATFORM, 2021–2028 (USD MILLION)
                    TABLE 128 REST OF EUROPE: BLOOD SCREENING MARKET, BY END USER, 2021–2028 (USD MILLION)
    9.4 ASIA PACIFIC 
          FIGURE 24 ASIA PACIFIC: BLOOD SCREENING MARKET SNAPSHOT
          TABLE 129 ASIA PACIFIC: BLOOD SCREENING MARKET, BY COUNTRY, 2021–2028 (USD MILLION)
          TABLE 130 ASIA PACIFIC: BLOOD SCREENING MARKET, BY PRODUCT & SERVICE, 2021–2028 (USD MILLION)
          TABLE 131 ASIA PACIFIC: BLOOD SCREENING REAGENTS & KITS MARKET, BY TYPE, 2021–2028 (USD MILLION)
          TABLE 132 ASIA PACIFIC: BLOOD SCREENING INSTRUMENTS MARKET, BY PURCHASE TYPE, 2021–2028 (USD MILLION)
          TABLE 133 ASIA PACIFIC: BLOOD SCREENING MARKET, BY TECHNOLOGY, 2021–2028 (USD MILLION)
          TABLE 134 ASIA PACIFIC: BLOOD SCREENING MARKET FOR NUCLEIC ACID TESTS, BY TYPE, 2021–2028 (USD MILLION)
          TABLE 135 ASIA PACIFIC: BLOOD SCREENING MARKET FOR SEROLOGY/IMMUNOASSAYS, BY PLATFORM, 2021–2028 (USD MILLION)
          TABLE 136 ASIA PACIFIC: BLOOD SCREENING MARKET, BY END USER, 2021–2028 (USD MILLION)
           9.4.1 ASIA PACIFIC: RECESSION IMPACT
           9.4.2 CHINA
                    9.4.2.1 High burden of infectious diseases to drive market
                                TABLE 137 CHINA: KEY MACROINDICATORS
                                TABLE 138 CHINA: BLOOD SCREENING MARKET, BY PRODUCT & SERVICE, 2021–2028 (USD MILLION)
                                TABLE 139 CHINA: BLOOD SCREENING REAGENTS & KITS MARKET, BY TYPE, 2021–2028 (USD MILLION)
                                TABLE 140 CHINA: BLOOD SCREENING INSTRUMENTS MARKET, BY PURCHASE TYPE, 2021–2028 (USD MILLION)
                                TABLE 141 CHINA: BLOOD SCREENING MARKET, BY TECHNOLOGY, 2021–2028 (USD MILLION)
                                TABLE 142 CHINA: BLOOD SCREENING MARKET FOR NUCLEIC ACID TESTS, BY TYPE, 2021–2028 (USD MILLION)
                                TABLE 143 CHINA: BLOOD SCREENING MARKET FOR SEROLOGY/IMMUNOASSAYS, BY PLATFORM, 2021–2028 (USD MILLION)
                                TABLE 144 CHINA: BLOOD SCREENING MARKET, BY END USER, 2021–2028 (USD MILLION)
           9.4.3 JAPAN
                    9.4.3.1 Growing adoption of advanced blood screening technologies to drive market
                                TABLE 145 JAPAN: BLOOD SCREENING MARKET, BY PRODUCT & SERVICE, 2021–2028 (USD MILLION)
                                TABLE 146 JAPAN: BLOOD SCREENING REAGENTS & KITS MARKET, BY TYPE, 2021–2028 (USD MILLION)
                                TABLE 147 JAPAN: BLOOD SCREENING INSTRUMENTS MARKET, BY PURCHASE TYPE, 2021–2028 (USD MILLION)
                                TABLE 148 JAPAN: BLOOD SCREENING MARKET, BY TECHNOLOGY, 2021–2028 (USD MILLION)
                                TABLE 149 JAPAN: BLOOD SCREENING MARKET FOR NUCLEIC ACID TESTS, BY TYPE, 2021–2028 (USD MILLION)
                                TABLE 150 JAPAN: BLOOD SCREENING MARKET FOR SEROLOGY/IMMUNOASSAYS, BY PLATFORM, 2021–2028 (USD MILLION)
                                TABLE 151 JAPAN: BLOOD SCREENING MARKET, BY END USER, 2021–2028 (USD MILLION)
           9.4.4 INDIA
                    9.4.4.1 Increasing road accidents to support market growth
                                TABLE 152 INDIA: BLOOD SCREENING MARKET, BY PRODUCT & SERVICE, 2021–2028 (USD MILLION)
                                TABLE 153 INDIA: BLOOD SCREENING REAGENTS & KITS MARKET, BY TYPE, 2021–2028 (USD MILLION)
                                TABLE 154 INDIA: BLOOD SCREENING INSTRUMENTS MARKET, BY PURCHASE TYPE, 2021–2028 (USD MILLION)
                                TABLE 155 INDIA: BLOOD SCREENING MARKET, BY TECHNOLOGY, 2021–2028 (USD MILLION)
                                TABLE 156 INDIA: BLOOD SCREENING MARKET FOR NUCLEIC ACID TESTS, BY TYPE, 2021–2028 (USD MILLION)
                                TABLE 157 INDIA: BLOOD SCREENING MARKET FOR SEROLOGY/IMMUNOASSAYS, BY PLATFORM, 2021–2028 (USD MILLION)
                                TABLE 158 INDIA: BLOOD SCREENING MARKET, BY END USER, 2021–2028 (USD MILLION)
           9.4.5 AUSTRALIA
                    9.4.5.1 Increasing cases of leukemia to drive market
                                TABLE 159 AUSTRALIA: BLOOD SCREENING MARKET, BY PRODUCT & SERVICE, 2021–2028 (USD MILLION)
                                TABLE 160 AUSTRALIA: BLOOD SCREENING REAGENTS & KITS MARKET, BY TYPE, 2021–2028 (USD MILLION)
                                TABLE 161 AUSTRALIA: BLOOD SCREENING INSTRUMENTS MARKET, BY PURCHASE TYPE, 2021–2028 (USD MILLION)
                                TABLE 162 AUSTRALIA: BLOOD SCREENING MARKET, BY TECHNOLOGY, 2021–2028 (USD MILLION)
                                TABLE 163 AUSTRALIA: BLOOD SCREENING MARKET FOR NUCLEIC ACID TESTS, BY TYPE, 2021–2028 (USD MILLION)
                                TABLE 164 AUSTRALIA: BLOOD SCREENING MARKET FOR SEROLOGY/IMMUNOASSAYS, BY PLATFORM, 2021–2028 (USD MILLION)
                                TABLE 165 AUSTRALIA: BLOOD SCREENING MARKET, BY END USER, 2021–2028 (USD MILLION)
           9.4.6 REST OF ASIA PACIFIC
                    TABLE 166 REST OF ASIA PACIFIC: BLOOD SCREENING MARKET, BY PRODUCT & SERVICE, 2021–2028 (USD MILLION)
                    TABLE 167 REST OF ASIA PACIFIC: BLOOD SCREENING REAGENTS & KITS MARKET, BY TYPE, 2021–2028 (USD MILLION)
                    TABLE 168 REST OF ASIA PACIFIC: BLOOD SCREENING INSTRUMENTS MARKET, BY PURCHASE TYPE, 2021–2028 (USD MILLION)
                    TABLE 169 REST OF ASIA PACIFIC: BLOOD SCREENING MARKET, BY TECHNOLOGY, 2021–2028 (USD MILLION)
                    TABLE 170 REST OF ASIA PACIFIC: BLOOD SCREENING MARKET FOR NUCLEIC ACID TESTS, BY TYPE, 2021–2028 (USD MILLION)
                    TABLE 171 REST OF ASIA PACIFIC: BLOOD SCREENING MARKET FOR SEROLOGY/IMMUNOASSAYS, BY PLATFORM, 2021–2028 (USD MILLION)
                    TABLE 172 REST OF ASIA PACIFIC: BLOOD SCREENING MARKET, BY END USER, 2021–2028 (USD MILLION)
    9.5 LATIN AMERICA 
          TABLE 173 LATIN AMERICA: BLOOD SCREENING MARKET, BY COUNTRY, 2021–2028 (USD MILLION)
          TABLE 174 LATIN AMERICA: BLOOD SCREENING MARKET, BY PRODUCT & SERVICE, 2021–2028 (USD MILLION)
          TABLE 175 LATIN AMERICA: BLOOD SCREENING REAGENTS & KITS MARKET, BY TYPE, 2021–2028 (USD MILLION)
          TABLE 176 LATIN AMERICA: BLOOD SCREENING INSTRUMENTS MARKET, BY PURCHASE TYPE, 2021–2028 (USD MILLION)
          TABLE 177 LATIN AMERICA: BLOOD SCREENING MARKET, BY TECHNOLOGY, 2021–2028 (USD MILLION)
          TABLE 178 LATIN AMERICA: BLOOD SCREENING MARKET FOR NUCLEIC ACID TESTS, BY TYPE, 2021–2028 (USD MILLION)
          TABLE 179 LATIN AMERICA: BLOOD SCREENING MARKET FOR SEROLOGY/IMMUNOASSAYS, BY PLATFORM, 2021–2028 (USD MILLION)
          TABLE 180 LATIN AMERICA: BLOOD SCREENING MARKET, BY END USER, 2021–2028 (USD MILLION)
           9.5.1 LATIN AMERICA: RECESSION IMPACT
           9.5.2 BRAZIL
                    9.5.2.1 Growing cancer burden to support market growth
                                TABLE 181 INCIDENCE OF CANCERS IN BRAZIL, 2020 VS. 2025
                                TABLE 182 BRAZIL: BLOOD SCREENING MARKET, BY PRODUCT & SERVICE, 2021–2028 (USD MILLION)
                                TABLE 183 BRAZIL: BLOOD SCREENING REAGENTS & KITS MARKET, BY TYPE, 2021–2028 (USD MILLION)
                                TABLE 184 BRAZIL: BLOOD SCREENING INSTRUMENTS MARKET, BY PURCHASE TYPE, 2021–2028 (USD MILLION)
                                TABLE 185 BRAZIL: BLOOD SCREENING MARKET, BY TECHNOLOGY, 2021–2028 (USD MILLION)
                                TABLE 186 BRAZIL: BLOOD SCREENING MARKET FOR NUCLEIC ACID TESTS, BY TYPE, 2021–2028 (USD MILLION)
                                TABLE 187 BRAZIL: BLOOD SCREENING MARKET FOR SEROLOGY/IMMUNOASSAYS, BY PLATFORM, 2021–2028 (USD MILLION)
                                TABLE 188 BRAZIL: BLOOD SCREENING MARKET, BY END USER, 2021–2028 (USD MILLION)
           9.5.3 MEXICO
                    9.5.3.1 Rising blood donations to support market growth
                                TABLE 189 MEXICO: BLOOD SCREENING MARKET, BY PRODUCT & SERVICE, 2021–2028 (USD MILLION)
                                TABLE 190 MEXICO: BLOOD SCREENING REAGENTS & KITS MARKET, BY TYPE, 2021–2028 (USD MILLION)
                                TABLE 191 MEXICO: BLOOD SCREENING INSTRUMENTS MARKET, BY PURCHASE TYPE, 2021–2028 (USD MILLION)
                                TABLE 192 MEXICO: BLOOD SCREENING MARKET, BY TECHNOLOGY, 2021–2028 (USD MILLION)
                                TABLE 193 MEXICO: BLOOD SCREENING MARKET FOR NUCLEIC ACID TESTS, BY TYPE, 2021–2028 (USD MILLION)
                                TABLE 194 MEXICO: BLOOD SCREENING MARKET FOR SEROLOGY/IMMUNOASSAYS, BY PLATFORM, 2021–2028 (USD MILLION)
                                TABLE 195 MEXICO: BLOOD SCREENING MARKET, BY END USER, 2021–2028 (USD MILLION)
           9.5.4 REST OF LATIN AMERICA
                    TABLE 196 REST OF LATIN AMERICA: BLOOD SCREENING MARKET, BY PRODUCT & SERVICE, 2021–2028 (USD MILLION)
                    TABLE 197 REST OF LATIN AMERICA: BLOOD SCREENING REAGENTS & KITS MARKET, BY TYPE, 2021–2028 (USD MILLION)
                    TABLE 198 REST OF LATIN AMERICA: BLOOD SCREENING INSTRUMENTS MARKET, BY PURCHASE TYPE, 2021–2028 (USD MILLION)
                    TABLE 199 REST OF LATIN AMERICA: BLOOD SCREENING MARKET, BY TECHNOLOGY, 2021–2028 (USD MILLION)
                    TABLE 200 REST OF LATIN AMERICA: BLOOD SCREENING MARKET FOR NUCLEIC ACID TESTS, BY TYPE, 2021–2028 (USD MILLION)
                    TABLE 201 REST OF LATIN AMERICA: BLOOD SCREENING MARKET FOR SEROLOGY/IMMUNOASSAYS, BY PLATFORM, 2021–2028 (USD MILLION)
                    TABLE 202 REST OF LATIN AMERICA: BLOOD SCREENING MARKET, BY END USER, 2021–2028 (USD MILLION)
    9.6 MIDDLE EAST & AFRICA 
           9.6.1 RISING SURGICAL PROCEDURES DUE TO CHRONIC DISEASES TO FUEL MARKET
                    TABLE 203 MIDDLE EAST & AFRICA: BLOOD SCREENING MARKET, BY PRODUCT & SERVICE, 2021–2028 (USD MILLION)
                    TABLE 204 MIDDLE EAST & AFRICA: BLOOD SCREENING REAGENTS & KITS MARKET, BY TYPE, 2021–2028 (USD MILLION)
                    TABLE 205 MIDDLE EAST & AFRICA: BLOOD SCREENING INSTRUMENTS MARKET, BY PURCHASE TYPE, 2021–2028 (USD MILLION)
                    TABLE 206 MIDDLE EAST & AFRICA: BLOOD SCREENING MARKET, BY TECHNOLOGY, 2021–2028 (USD MILLION)
                    TABLE 207 MIDDLE EAST & AFRICA: BLOOD SCREENING MARKET FOR NUCLEIC ACID TESTS, BY TYPE, 2021–2028 (USD MILLION)
                    TABLE 208 MIDDLE EAST & AFRICA: BLOOD SCREENING MARKET FOR SEROLOGY/IMMUNOASSAYS, BY PLATFORM, 2021–2028 (USD MILLION)
                    TABLE 209 MIDDLE EAST & AFRICA: BLOOD SCREENING MARKET, BY END USER, 2021–2028 (USD MILLION)
           9.6.2 MIDDLE EAST & AFRICA: RECESSION IMPACT
 
10 COMPETITIVE LANDSCAPE (Page No. - 184)
     10.1 OVERVIEW 
     10.2 STRATEGIES OF KEY PLAYERS 
             10.2.1 BLOOD SCREENING MARKET: OVERVIEW OF STRATEGIES DEPLOYED BY KEY PLAYERS
                       TABLE 210 OVERVIEW OF STRATEGIES DEPLOYED BY KEY COMPANIES
     10.3 REVENUE SHARE ANALYSIS 
             FIGURE 25 REVENUE SHARE ANALYSIS OF LEADING PLAYERS IN BLOOD SCREENING MARKET
     10.4 MARKET SHARE ANALYSIS 
             10.4.1 BLOOD SCREENING MARKET
                       FIGURE 26 MARKET SHARE ANALYSIS BY KEY PLAYER (2022)
                       TABLE 211 BLOOD SCREENING MARKET: INTENSITY OF COMPETITIVE RIVALRY
     10.5 COMPANY EVALUATION MATRIX 
             10.5.1 LIST OF EVALUATED VENDORS
             10.5.2 STARS
             10.5.3 EMERGING LEADERS
             10.5.4 PERVASIVE PLAYERS
             10.5.5 PARTICIPANTS
                       FIGURE 27 BLOOD SCREENING MARKET: COMPANY EVALUATION MATRIX FOR KEY PLAYERS (2022)
     10.6 COMPANY EVALUATION MATRIX FOR STARTUPS/SMES (2022) 
             10.6.1 PROGRESSIVE COMPANIES
             10.6.2 STARTING BLOCKS
             10.6.3 RESPONSIVE COMPANIES
             10.6.4 DYNAMIC COMPANIES
                       FIGURE 28 BLOOD SCREENING MARKET: COMPANY EVALUATION MATRIX FOR STARTUPS/SMES (2022)
     10.7 COMPETITIVE BENCHMARKING 
             10.7.1 PRODUCT AND GEOGRAPHIC FOOTPRINT ANALYSIS
                       FIGURE 29 BLOOD SCREENING MARKET: PRODUCT AND GEOGRAPHIC FOOTPRINT ANALYSIS
                       TABLE 212 BLOOD SCREENING MARKET: COMPETITIVE BENCHMARKING OF KEY PLAYERS
                       TABLE 213 BLOOD SCREENING MARKET: COMPANY PRODUCT & SERVICE FOOTPRINT ANALYSIS
                       TABLE 214 BLOOD SCREENING MARKET: COMPANY REGIONAL FOOTPRINT ANALYSIS
                       TABLE 215 BLOOD SCREENING MARKET: DETAILED LIST OF KEY STARTUPS/SMES
     10.8 COMPETITIVE SCENARIO 
             10.8.1 PRODUCT LAUNCHES
                       TABLE 216 BLOOD SCREENING MARKET: KEY PRODUCT LAUNCHES & APPROVALS (JANUARY 2020−SEPTEMBER 2023)
             10.8.2 DEALS
                       TABLE 217 BLOOD SCREENING MARKET: KEY DEALS (JANUARY 2020−SEPTEMBER 2023)
 
11 COMPANY PROFILES (Page No. - 198)
     11.1 KEY PLAYERS 
(Business Overview, Products Offered, Recent Developments, and MnM View (Key strengths/Right to Win, Strategic Choices Made, and Weaknesses and Competitive Threats))*
             11.1.1 F. HOFFMANN-LA ROCHE LTD.
                       TABLE 218 F. HOFFMANN-LA ROCHE LTD.: BUSINESS OVERVIEW
                       FIGURE 30 F. HOFFMANN-LA ROCHE LTD.: COMPANY SNAPSHOT (2022)
             11.1.2 GRIFOLS, S.A.
                       TABLE 219 GRIFOLS, S.A.: BUSINESS OVERVIEW
                       FIGURE 31 GRIFOLS S.A.: COMPANY SNAPSHOT (2022)
             11.1.3 ABBOTT LABORATORIES
                       TABLE 220 ABBOTT LABORATORIES: BUSINESS OVERVIEW
                       FIGURE 32 ABBOTT LABORATORIES: COMPANY SNAPSHOT (2022)
             11.1.4 BIO-RAD LABORATORIES, INC.
                       TABLE 221 BIO-RAD LABORATORIES, INC.: BUSINESS OVERVIEW
                       FIGURE 33 BIO-RAD LABORATORIES, INC.: COMPANY SNAPSHOT (2022)
             11.1.5 DIASORIN
                       TABLE 222 DIASORIN: BUSINESS OVERVIEW
                       FIGURE 34 DIASORIN: COMPANY SNAPSHOT (2022)
             11.1.6 BIOMÉRIEUX
                       TABLE 223 BIOMÉRIEUX: BUSINESS OVERVIEW
                       FIGURE 35 BIOMÉRIEUX: COMPANY SNAPSHOT (2022)
             11.1.7 BD
                       TABLE 224 BD: BUSINESS OVERVIEW
                       FIGURE 36 BD: COMPANY SNAPSHOT (2022)
             11.1.8 DANAHER (BECKMAN COULTER, INC.)
                       TABLE 225 DANAHER: BUSINESS OVERVIEW
                       FIGURE 37 DANAHER: COMPANY SNAPSHOT (2022)
             11.1.9 HOLOGIC, INC.
                       TABLE 226 HOLOGIC, INC.: BUSINESS OVERVIEW
                       FIGURE 38 HOLOGIC, INC.: COMPANY SNAPSHOT (2022)
             11.1.10 SIEMENS HEALTHINEERS AG
                       TABLE 227 SIEMENS HEALTHINEERS AG: BUSINESS OVERVIEW
                       FIGURE 39 SIEMENS HEALTHINEERS AG: COMPANY SNAPSHOT (2022)
             11.1.11 THERMO FISHER SCIENTIFIC, INC.
                       TABLE 228 THERMO FISHER SCIENTIFIC, INC.: BUSINESS OVERVIEW
                       FIGURE 40 THERMO FISHER SCIENTIFIC, INC.: COMPANY SNAPSHOT (2022)
     11.2 OTHER PLAYERS 
             11.2.1 ORTHO CLINICAL DIAGNOSTICS
             11.2.2 MERCK KGAA
             11.2.3 REVVITY (PART OF PERKINELMER INC.)
             11.2.4 BIO-TECHNE
             11.2.5 GFE
             11.2.6 TRINITY BIOTECH
             11.2.7 J. MITRA & CO. PVT. LTD.
             11.2.8 MINDRAY
             11.2.9 MACCURA BIOTECHNOLOGY CO., LTD.
             11.2.10 IMMUCOR, INC.
             11.2.11 CELLABS
             11.2.12 ABNOVA CORPORATION
             11.2.13 ENZO BIOCHEM, INC.
             11.2.14 TULIP DIAGNOSTICS PVT. LTD.
 
*Details on Business Overview, Products Offered, Recent Developments, and MnM View (Key strengths/Right to Win, Strategic Choices Made, and Weaknesses and Competitive Threats) might not be captured in case of unlisted companies.
 
12 APPENDIX (Page No. - 255)
     12.1 DISCUSSION GUIDE 
     12.2 KNOWLEDGESTORE: MARKETSANDMARKETS’ SUBSCRIPTION PORTAL 
     12.3 CUSTOMIZATION OPTIONS 
     12.4 RELATED REPORTS 
     12.5 AUTHOR DETAILS 

The objective of the study is analyzing the key market dynamics such as drivers, opportunities, challenges, restraints, and key player strategies. To track companies’ developments such as acquisitions, product launches, expansions, agreements and partnerships of the leading players, the competitive landscape of the Blood screening market to analyzes market players on various parameters within the broad categories of business and product strategy. Top-down and bottom-up approaches were used to estimate the market size. To estimate the market size of segments and subsegments the market breakdown and data triangulation were used.

The four steps involved in estimating the market size are

Secondary Research

In the secondary research process, various secondary sources such as annual reports, press releases & investor presentations of companies, white papers, certified publications, articles by recognized authors, gold-standard & silver-standard websites, regulatory bodies, and databases (such as D&B Hoovers, Bloomberg Business, and Factiva) were referred to identify and collect information for this study.

Primary Research

In the primary research process, various sources from both the supply and demand sides were interviewed to obtain qualitative and quantitative information for this report. Primary sources were mainly industry experts from the core and related industries and preferred suppliers, manufacturers, distributors, service providers, technology developers, researchers, and organizations related to all segments of this industry’s value chain. In-depth interviews were conducted with various primary respondents, including key industry participants, subject-matter experts, C-level executives of key market players, and industry consultants, to obtain and verify the critical qualitative and quantitative information as well as assess prospects.

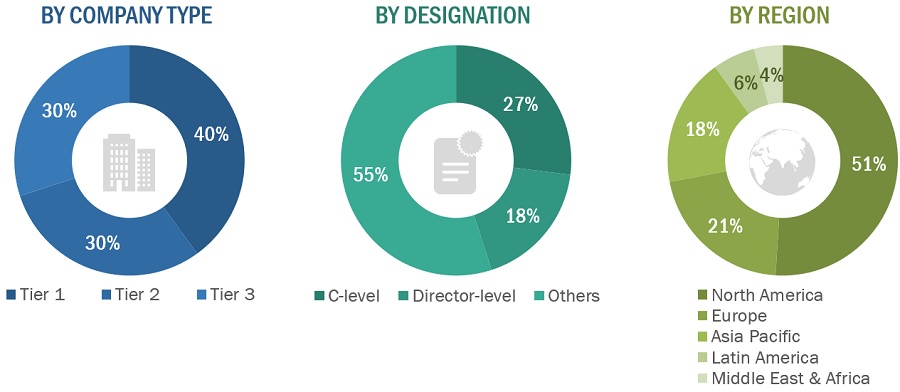
The following is a breakdown of the primary respondents:

Breakdown of Primary Participants:
Blood Screening Market Size, and Share

Note 1: Others include sales managers, marketing managers, and product managers.

Note 2: Companies are classified into tiers based on their total revenues. As of 2022, Tier 1 = >USD 100 million, Tier 2 = USD 10 million to USD 100 million, and Tier 3 = <USD 10 million.

To know about the assumptions considered for the study, download the pdf brochure

COMPANY NAME

DESIGNATION

Abbott

Marketing Manager

F. Hoffmann-La Roche Ltd

Senior Product Manager

Danaher

Marketing Manager

Market Size Estimation

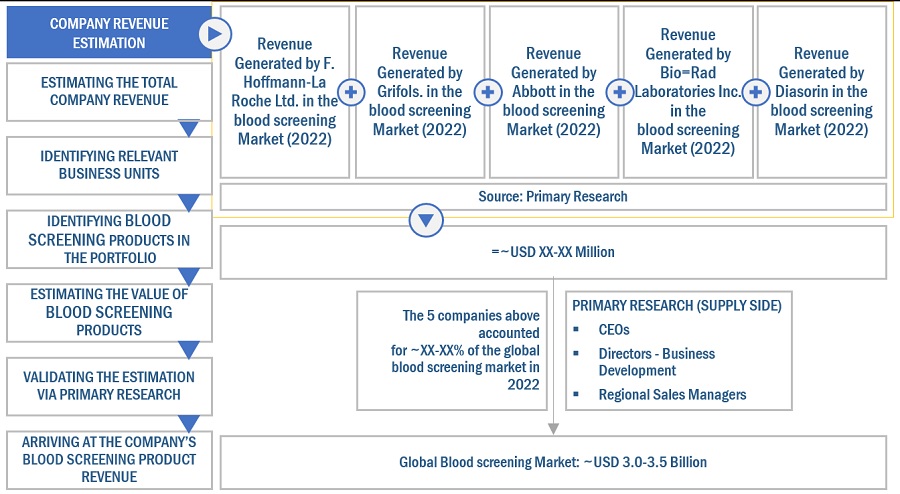
Both top-down and bottom-up approaches were used to estimate and validate the Blood screening market's total size. These methods were also used extensively to estimate the size of various subsegments in the market. The research methodology used to estimate the market size includes the following:

  • The key players in the industry have been identified through extensive secondary research
  • The revenues generated by leading players operating in the Blood screening market have been determined through primary and secondary research
  • All percentage shares, splits, and breakdowns have been determined using secondary sources and verified through primary sources

Global Blood screening Market Size: Bottom-Up Approach
Blood Screening Market Size, and Share

To know about the assumptions considered for the study, Request for Free Sample Report

Global Blood Screening Market Size: Top-Down Approach

Blood Screening Market Size, and Share

Data Triangulation

After arriving at the overall market size applying the process mentioned above, the total market was split into several segments and subsegments. To complete the overall market engineering process and arrive at the exact statistics for all segments and subsegments, data triangulation and market breakdown procedures were employed, wherever applicable. The data was triangulated by studying various factors and trends from both the demand and supply sides.

Market Definition

Blood screening is a medical process wherein donated blood is mainly tested for HIV1, HIV2, HBV, HCV, malaria, syphilis, and other infectious diseases. Donated blood is screened for these infectious diseases to reduce the risk of transfusion-transmissible infections (TTIs).

Key Stakeholders

  • Senior Management
  • End User
  • Finance/Procurement Department
  • R&D Department

Report Objectives

  • To define, describe, segment, and forecast the global Blood screening market, by products & service, technology, end user, and region
  • To provide detailed information regarding the major factors influencing the market growth (such as drivers, restraints, opportunities, and challenges)
  • To analyze the micromarkets1 with respect to individual growth trends, prospects, and contributions to the overall Blood screening market
  • To analyze market opportunities for stakeholders and provide details of the competitive landscape for key players
  • To forecast the size of the market segments with respect to five regions, namely, North America, Europe, the Asia Pacific, Latin America, and the Middle East & Africa
  • To profile the key players and comprehensively analyze their product portfolios, market positions, and core competencies2
  • To track and analyze company developments such as product launches & approvals, partnerships, acquisitions, agreements, and other developments
  • To benchmark players within the market using the proprietary Competitive Leadership Mapping framework, which analyzes market players on various parameters within the broad categories of business and product excellence

Available Customizations

MarketsandMarkets offers the following customizations for this market report

Country Information

  • Additional country-level analysis of the Blood screening market

Company profiles

  • Additional five company profiles of players operating in the Blood screening market.

Product Analysis

  • Product matrix, which provides a detailed comparison of the product portfolio of each company in the Blood screening market
Custom Market Research Services

We will customize the research for you, in case the report listed above does not meet with your exact requirements. Our custom research will comprehensively cover the business information you require to help you arrive at strategic and profitable business decisions.

Request Customization

Instant Answers with GPT - Ask Now!

Ask real questions. Get complete answers !
Report Code
MD 3687
Published ON
Sep, 2023
Choose License Type
BUY NOW
  • SHARE
X
Request Customization
Speak to Analyst
Speak to Analyst
OR FACE-TO-FACE MEETING
PERSONALIZE THIS RESEARCH
  • Triangulate with your Own Data
  • Get Data as per your Format and Definition
  • Gain a Deeper Dive on a Specific Application, Geography, Customer or Competitor
  • Any level of Personalization
REQUEST A FREE CUSTOMIZATION
LET US HELP YOU!
  • What are the Known and Unknown Adjacencies Impacting the Blood Screening Market
  • What will your New Revenue Sources be?
  • Who will be your Top Customer; what will make them switch?
  • Defend your Market Share or Win Competitors
  • Get a Scorecard for Target Partners
CUSTOMIZED WORKSHOP REQUEST
+1-888-600-6441
  • Call Us
  • +1-888-600-6441 (Corporate office hours)
  • +1-888-600-6441 (US/Can toll free)
  • +44-800-368-9399 (UK office hours)
CONNECT WITH US
ABOUT TRUST ONLINE
©2024 MarketsandMarkets Research Private Ltd. All rights reserved
DMCA.com Protection Status Website Feedback