Chemical Enhanced Oil Recovery (EOR / IOR) Market by Origin (Petro-based, & Bio-based), by Type (Surfactants, Water soluble polymers, Polymer gels, Biopolymers, Alkaline chemicals), by Technique (Polymer flooding, Surfactant-polymer flooding, Alkaline surfactant polymer flooding), by Application (Onshore, & Offshore) - Regional Trend & Forecast to 2020


The chemical enhanced oil recovery (EOR / IOR) market chemicals are used for enhancing the recovery of hydrocarbons from the well. Various types of EOR chemicals include water soluble polymers, surfactants, polymer gels, biopolymers, alkaline chemicals, and others. These chemicals are used in EOR applications to achieve the optimum performance and enhance the effectiveness of the oil recovery.
The chemical enhanced oil recovery (EOR / IOR) market is projected to reach $891.02 Million by 2020, at a CAGR of 5.00% between 2015 and 2020.
Recent focus on optimizing oil production from mature reserves and difficult terrains in North America is driving the demand for EOR chemicals. The factors driving growth in the chemical EOR market are increasing effectiveness in production of crude oil, and growing deep drilling activities. The chemical enhanced oil recovery (EOR / IOR) market is expected to experience decent growth due to the potential offered by these drivers.
EOR chemical manufacturers mainly focus on agreements to be able to cater to the continuously growing demand for EOR chemicals. New product developments in growing markets such as Asia & the Middle East, has been and could be the key success for EOR chemicals producers if they intend to increase their overall sales and revenue.
The report covers the global chemical EOR market in major regions namely North America, Europe, Asia & the Middle East, Africa, and Central & South America for onshore as well as offshore applications. This report analyzes different marketing trends and establishes the most effective growth strategy in the market. It identifies market dynamics such as drivers, restraints, opportunities, and winning imperatives. Major companies such as BASF SE (Germany), DuPont (U.S.), Baker Hughes (U.S.), Halliburton, and Schlumberger Limited (U.S.) have also been profiled.
By Type:
- Water soluble polymers
- Surfactants
- Polymer gels
- Biopolymers
- Alkaline chemicals
- Others
By Origin:
- Petro-based
- Bio-based
By Applications:
- Onshore
- Offshore
By Technique:
- Polymer flooding
- Surfactant polymer flooding
- Alkaline surfactant polymer flooding
By Region:
- North America
- Europe
- Asia & the Middle East
- Africa
- Central & South America
EOR chemicals are used in the oilfield operations mainly to improve well performance and eventually the recovery from reserves. They are used through several techniques such as polymer flooding, surfactant polymer flooding, and alkaline surfactant polymer flooding. Increasing oil production, extraction of oils from technologically challenging hydrocarbon geologies, and necessity of more efficient extraction are boosting interest in the EOR chemicals market.
This market is driven by increasing production of crude oil, growing deep drilling activities, and high demand for EOR processes. The demand for EOR chemicals is increasing in the onshore activities to enhance crude oil production from mature or declining reserves. North America region is estimated to be the fastest growing region as EOR chemicals are registering a high growth in the region.
The North American region dominated the EOR chemicals market in 2014, globally. Canada, Mexico, Saudi Arabia, China and India are the major countries with a huge demand for EOR chemicals. Asia-Pacific is expected to show the highest growth rate of 5.45% between 2015 and 2020 for the chemical EOR market.
Chemical EOR Market Share, by Region, 2014
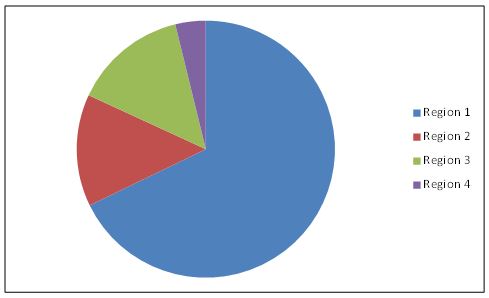
Source: MarketsandMarkets Analysis
The key market players focus on agreements as their growth strategy in order to be able to cater to the growing demand for EOR chemicals and serve more consumers. They are also focusing on trying to capture market share by making more and more consumers aware of their products by participating in product showcasing.
The chemical EOR market is expected to witness a high growth from mature wells and developed regions as well as from offshore applications. One of the chief problems in the chemical EOR market is the constantly decreasing oil prices.
The report analyzes the market based on the key applications, origin, techniques, types, and regions. It also covers the market behavior of leading producers, key developments, and strategies implemented to sustain and succeed in the market.
Table of Contents
1 Introduction (Page No. - 15)
1.1 Objectives of the Study
1.2 Market Definition
1.3 Market Scope
1.3.1 Markets Covered
1.3.2 Chemical EOR Market, By Region
1.3.3 Years Considered for This Study
1.4 Currency
1.5 Package Size
1.6 Limitations
1.7 Stakeholders
2 Research Methodology (Page No. - 19)
2.1 Market Size Estimation
2.2 Market Share Estimation
2.2.1 Data From Secondary Sources
2.2.2 Data From Primary Sources
2.2.3 Assumptions
3 Executive Summary (Page No. - 24)
4 Premium Insights (Page No. - 27)
4.1 Significant Market Opportunities for Chemical EOR
4.2 Lifecycle Analysis, By Region
5 Market Overview (Page No. - 31)
5.1 Introduction
5.2 Market Segmentation
5.2.1 Chemical EOR Market, By Application
5.2.2 Chemical EOR Market, By Type
5.2.3 Chemical EOR Market, By Technique
5.2.4 Chemical EOR Market, By Origin
5.3 Market Dynamics
5.3.1 Drivers
5.3.1.1 Increasing Crude Oil Production
5.3.1.2 Rising Deep Drilling Operations
5.3.2 Restraint
5.3.2.1 Market for Chemical EOR Becomes Unattractive as Rapidly Declining Prices of Oil Make the Overall Extraction Process A Costly Affair
5.3.3 Opportunities
5.3.3.1 Discovery of New Oilfields
5.3.3.2 Environmentally Friendly Biopolymers Can Drive the Growth of the Chemical EOR Market in the Future
5.3.4 Challenge
5.3.4.1 Development of Cheaper Substitutes
6 Industry Trends (Page No. - 39)
6.1 Introduction
6.2 Pricing Analysis
6.3 Porter’s Five Forces Analysis
6.3.1 Threat of New Entrants
6.3.2 Threat of Substitutes
6.3.3 Bargaining Power of Buyers
6.3.4 Bargaining Power of Suppliers
6.3.5 Intensity of Rivalry
6.4 Strategic Benchmarking
6.4.1 Regional Integration & Product Enhancement
6.4.2 Entry Into Prospective Markets for Chemical EOR
7 Chemical EOR Market, By Type (Page No. - 44)
7.1 Introduction
7.2 Water Soluble Polymers
7.3 Surfactants
7.4 Polymer Gels
7.5 Biopolymers
7.6 Alkaline Chemicals
7.7 Others
8 Chemical EOR Market, By Application (Page No. - 53)
8.1 Introduction
8.2 Onshore
8.3 Offshore
9 Chemical EOR Market, By Technique (Page No. - 58)
9.1 Introduction
9.2 Polymer Flooding
9.3 Surfactant-Polymer Flooding
9.4 Alkaline-Surfactant-Polymer Flooding
10 Chemical EOR Market, By Origin (Page No. - 65)
10.1 Introduction
10.2 Petro-Based EOR Chemicals
10.3 Bio-Based EOR Chemicals
11 Chemical EOR Market, By Region (Page No. - 69)
11.1 Introduction
11.2 North America
11.2.1 U.S.
11.2.2 Canada
11.2.3 Mexico
11.3 Europe
11.3.1 Russia
11.3.2 U.K.
11.3.3 Norway
11.3.4 France
11.3.5 Others
11.4 Asia & the Middle East
11.4.1 China
11.4.2 India
11.4.3 Saudi Arabia
11.4.4 U.A.E.
11.4.5 Qatar
11.4.6 Others
11.5 Africa
11.5.1 Nigeria
11.5.2 Angola
11.5.3 Libya
11.5.4 Others
11.6 Central & South America
11.6.1 Colombia
11.6.2 Venezuela
11.6.3 Brazil
11.6.4 Others
12 Competitive Landscape (Page No. - 112)
12.1 Overview
12.2 Competitive Situation and Trends
12.2.1 New Product/Service/Technology Launch
12.2.2 Agreements/Collaborations/Alliances
12.2.3 Joint Ventures
12.2.4 Mergers & Acquisitions
13 Company Profiles (Page No. - 117)
(Overview, Financial*, Products & Services, Strategy, and Developments)
13.1 Introduction
13.2 Shell Chemicals (Subsidiary of Royal Dutch Shell Plc)
13.3 Halliburton Company
13.4 Schlumburger Ltd.
13.5 Baker Hughes Inc
13.6 Basf SE
13.7 The DOW Chemical Company
13.8 Huntsman Corporation
13.9 Champion Technologies
13.10 Tiorco LLC (Joint Venture of Nalco and Stepan Company)
13.11 Stepan Company
13.12 Oil Chem Technologies LLC
*Details Might Not Be Captured in Case of Unlisted Companies.
14 Appendix (Page No. - 145)
14.1 Industry Expert Insights
14.2 Discussion Guide
14.3 Introducing RT: Real Time Market Intelligence
14.4 Available Customizations
14.5 Related Reports
List of Tables (95 Tables)
Table 1 Increasing Oil Extraction and Increasing Average Depth of Drilling are Leading to the Growth of Chemical EOR Market
Table 2 Prices of Crude Oil Continue to Drop
Table 3 Newer Oil Reserves to Resurrect the Chemical EOR Market in the Near Future
Table 4 Cheaper Substitutes Offering Same Level of Effectiveness as Conventional Chemicals
Table 5 Chemical EOR Market Size, By Type, 2013–2020 ($Million)
Table 6 Water Soluble Polymers Market Size, By Region, 2013–2020 ($Million)
Table 7 Surfactants Market Size, By Region, 2013–2020 ($Million)
Table 8 Polymer Gels Market Size, By Region, 2013–2020 ($Million)
Table 9 Biopolymers Market Size, By Region, 2013–2020 ($Million)
Table 10 Alkaline Chemicals Market Size, By Region, 2013–2020 ($Million)
Table 11 Others Market Size, By Region, 2012–2019 ($Million)
Table 12 Chemical Enhanced Oil Recovery Market Size, By Application, 2013–2020 ($Million)
Table 13 Chemical EOR Market Size in Onshore Application, By Region, 2013–2020 ($Million)
Table 14 Chemical Enhanced Oil Recovery Market Size in Offshore Application, By Region, 2013–2020 ($Million)
Table 15 Chemical EOR Market Size, By Technique, 2013–2020 ($Million)
Table 16 Chemical Enhanced Oil Recovery Market Size in Polymer Flooding Technique, By Region, 2013–2020 ($Million)
Table 17 Chemical EOR Market Size in Surfactant-Polymer Flooding Technique, By Region, 2013–2020 ($Million)
Table 18 Chemical Enhanced Oil Recovery Market Size in Alkaline-Surfactant-Polymer Flooding Technique, By Region, 2013–2020 ($Million)
Table 19 Chemical EOR Market Size, By Origin, 2013–2020 ($Million)
Table 20 Chemical Enhanced Oil Recovery Market Size in Petro-Based Chemicals, By Region, 2013–2020 ($Million)
Table 21 Chemical EOR Market Size in Bio-Based Chemicals, By Region, 2013–2020 ($Million)
Table 22 Chemical Enhanced Oil Recovery Market Size, By Region, 2013–2020 ($Million)
Table 23 North America: Chemical EOR Market Size, By Type, 2013–2020 ($Million)
Table 24 North America: Chemical Enhanced Oil Recovery Market Size, By Technique, 2013–2020 ($Million)
Table 25 North America: Chemical EOR Market Size, By Origin, 2013–2020 ($Million)
Table 26 North America: Chemical Enhanced Oil Recovery Market Size, By Application, 2013–2020 ($Million)
Table 27 North America: Chemical EOR Market Size, By Country, 2013–2020 ($Million)
Table 28 U.S.: Chemical Enhanced Oil Recovery Market Size, By Type, 2013–2020 ($Million)
Table 29 U.S.: Chemical EOR Market Size, By Technique, 2013–2020 ($Million)
Table 30 Canada: Chemical EOR Market Size, By Type, 2013–2020 ($Million)
Table 31 Canada: Chemical Enhanced Oil Recovery Market Size, By Technique, 2013–2020 ($Million)
Table 32 Mexico: Chemical EOR Market Size, By Type, 2013–2020 ($Million)
Table 33 Mexico: Chemical Enhanced Oil Recovery Market Size, By Technique, 2013–2020 ($Million)
Table 34 Europe: Chemical EOR Market Size, By Type, 2013–2020 ($Million)
Table 35 Europe: Chemical EOR Market Size, By Technique, 2013–2020 ($Million)
Table 36 Europe: Chemical Enhanced Oil Recovery Market Size, By Origin, 2013–2020 ($Million)
Table 37 Europe: Chemical EOR Market Size, By Application, 2013–2020 ($Million)
Table 38 Europe: Chemical EOR Market Size, By Country, 2013–2020 ($Million)
Table 39 Russia: Chemical EOR Market Size, By Type, 2013–2020 ($Million)
Table 40 Russia: Chemical EOR Market Size, By Technique, 2013–2020 ($Million)
Table 41 U.K.: Chemical Enhanced Oil Recovery Market Size, By Type, 2013–2020 ($Million)
Table 42 U.K.: Chemical EOR Market Size, By Technique, 2013–2020 ($Million)
Table 43 Norway: Chemical EOR Market Size, By Type, 2013–2020 ($Million)
Table 44 Norway: Chemical EOR Market Size, By Technique, 2013–2020 ($Million)
Table 45 France: Chemical EOR Market Size, By Type, 2013–2020 ($Million)
Table 46 France: Chemical EOR Market Size, By Technique, 2013–2020 ($Million)
Table 47 Others: Chemical EOR Market Size, By Type, 2013–2020 ($Million)
Table 48 Others: Chemical EOR Market Size, By Technique, 2013–2020 ($Million)
Table 49 Asia & the Middle East: Chemical Enhanced Oil Recovery Market Size, By Type, 2013–2020 ($Million)
Table 50 Asia & the Middle East: Chemical EOR Market Size, By Technique, 2013–2020 ($Million)
Table 51 Asia & the Middle East: Chemical EOR Market Size, By Origin, 2013–2020 ($Million)
Table 52 Asia & the Middle East: Chemical EOR Market Size, By Application, 2013–2020 ($Million)
Table 53 Asia & the Middle East: Chemical EOR Market Size, By Country, 2013–2020 ($Million)
Table 54 China: Chemical Enhanced Oil Recovery Market Size, By Type, 2013–2020 ($Million)
Table 55 China: Chemical EOR Market Size, By Technique, 2013–2020 ($Million)
Table 56 India: Chemical EOR Market Size, By Type, 2013–2020 ($Million)
Table 57 India: Chemical EOR Market Size, By Technique, 2013–2020 ($Million)
Table 58 Saudi Arabia: Chemical EOR Market Size, By Type, 2013–2020 ($Million)
Table 59 Saudi Arabia: Chemical EOR Market Size, By Technique, 2013–2020 ($Million)
Table 60 U.A.E.: Chemical Enhanced Oil Recovery Market Size, By Type, 2013–2020 ($Million)
Table 61 U.A.E.: Chemical EOR Market Size, By Technique, 2013–2020 ($Million)
Table 62 Qatar: Chemical Enhanced Oil Recovery Market Size, By Type, 2013–2020 ($Million)
Table 63 Qatar: Chemical EOR Market Size, By Technique, 2013–2020 ($Million)
Table 64 Others: Chemical EOR Market Size, By Type, 2013–2020 ($Million)
Table 65 Others: Chemical EOR Market Size, By Technique, 2013–2020 ($Million)
Table 66 Africa: Chemical Enhanced Oil Recovery Market Size, By Type, 2013–2020 ($Million)
Table 67 Africa: Chemical EOR Market Size, By Technique, 2013–2020 ($Million)
Table 68 Africa: Chemical EOR Market Size, By Origin, 2013–2020 ($Million)
Table 69 Africa: Chemical EOR Market Size, By Application, 2013–2020 ($Million)
Table 70 Africa: Chemical EOR Market Size, By Country, 2013–2020 ($Million)
Table 71 Nigeria: Chemical EOR Market Size, By Type, 2013–2020 ($Million)
Table 72 Nigeria: Chemical EOR Market Size, By Technique, 2013–2020 ($Million)
Table 73 Angola: Chemical EOR Market Size, By Type, 2013–2020 ($Million)
Table 74 Angola: Chemical EOR Market Size, By Technique, 2013–2020 ($Million)
Table 75 Libya: Chemical EOR Market Size, By Type, 2013–2020 ($Million)
Table 76 Libya: Chemical EOR Market Size, By Technique, 2013–2020 ($Million)
Table 77 Others: Chemical EOR Market Size, By Type, 2013–2020 ($Million)
Table 78 Others: Chemical EOR Market Size, By Technique, 2013–2020 ($Million)
Table 79 Central & South America: Chemical Enhanced Oil Recovery Market Size, By Type, 2013–2020 ($Million)
Table 80 Central & South America: Chemical EOR Market Size, By Technique, 2013–2020 ($Million)
Table 81 Central & South America: Chemical EOR Market Size, By Origin, 2013–2020 ($Million)
Table 82 Central & South America: Chemical EOR Market Size, By Application, 2013–2020 ($Million)
Table 83 Central & South America: Chemical EOR Market Size, By Country, 2013–2020 ($Million)
Table 84 Colombia: Chemical Enhanced Oil Recovery Market Size, By Type, 2013–2020 ($Million)
Table 85 Colombia: Chemical EOR Market Size, By Technique, 2013–2020 ($Million)
Table 86 Venezuela: Chemical EOR Market Size, By Type, 2013–2020 ($Million)
Table 87 Venezuela: Chemical EOR Market Size, By Technique, 2013–2020 ($Million)
Table 88 Brazil: Chemical EOR Market Size, By Type, 2013–2020 ($Million)
Table 89 Brazil: Chemical EOR Market Size, By Technique, 2013–2020 ($Million)
Table 90 Others: Chemical Enhanced Oil Recovery Market Size, By Type, 2013–2020 ($Million)
Table 91 Others: Chemical EOR Market Size, By Technique, 2013–2020 ($Million)
Table 92 New Product/Service/Technology Development, 201o–2015
Table 93 Agreements/Collaborations/Alliances, 2010–2015
Table 94 Joint Ventures, 2011–2015
Table 95 Mergers & Acquisitions, 2010–2015
List of Figures (53 Figures)
Figure 1 Chemical Enhanced Oil Recovery Market Segmentation
Figure 2 Chemical EOR Market: Research Methodology
Figure 3 Market Size Estimation Methodology: Bottom-Up Approach
Figure 4 Market Size Estimation Methodology: Top-Down Approach
Figure 5 Break Down of Primary Interviews: By Company Type, Designation & Region
Figure 6 Surfactant-Polymer Flooding Projected to Be the Fastest-Growing Market, By Technique
Figure 7 Biopolymers Market Projected to Grow at the Highest CAGR
Figure 8 Fastest-Growing Countries in the Global Chemical EOR Market, 2015–2020 ($Million)
Figure 9 Attractive Opportunities in the Chemical EOR Market
Figure 10 Water Soluble Polymers Was the Largest Segment By Type for the Chemical EOR Market in 2014
Figure 11 Saudi Arabia, U.A.E & Qatar Will Grow Faster as Compared to Other Countries for the Chemical EOR Market, By 2020
Figure 12 Offshore is Projected to Be the Fastest-Growing Application Segment, 2015–2020
Figure 13 North America Held the Largest Market Share By Value in 2014
Figure 14 North America is Entering Into the Maturity Stage; Europe has Entered Into the Declining Phase
Figure 15 Chemical EOR Market Segmentation, By Application
Figure 16 Chemical Enhanced Oil Recovery Market Segmentation, By Type
Figure 17 Chemical EOR Market Segmentation, By Technique
Figure 18 Chemical Enhanced Oil Recovery Market Segmentation, By Origin
Figure 19 Chemical EOR: Market Dynamics
Figure 20 Chemical Enhanced Oil Recovery: Pricing Analysis
Figure 21 Chemical EOR: Porter’s Five Forces Analysis
Figure 22 Strategic Benchmarking: Companies Focusing on Product Enhancement
Figure 23 Strategic Benchmarking: Agreements to Leverage the Attractive Markets for Chemical EOR
Figure 24 Chemical EOR Market, By Type
Figure 25 Water Soluble Polymers Have the Largestmarket Sze, 2015–2020
Figure 26 Surfactants Market in Asia & the Middle East to Grow the Fastest, Followed By Central & South America, 2015–2020
Figure 27 Onshore is the Largest Application in Chemical EOR Market, 2015 vs 2020
Figure 28 North America is Projected to Account for ~64% of the Onshore Application By 2020
Figure 29 Asia & the Middle East is the Fastest-Growing Market for Offshore Application, 2015—2020
Figure 30 Polymer Flooding is the Most Widely Used Technique in the Chemical EOR Market, 2015 vs 2020
Figure 31 North America Projected to Account for the Highest Share in Polymer Flooding Technique in Chemical EOR Market By 2020
Figure 32 Asia & the Middle East is the Fastest-Growing Market for Surfactant-Polymer Technique, 2015–2020
Figure 33 Demand for Chemical EOR Process in North America is Driven By the Depleting Onshore Reserves
Figure 34 Increasing Drilling Activities in New and Existing Onshore and Offshore Fieldsdriving the Asia & the Middle East’s Chemical EOR Market
Figure 35 Growth Strategies Adopted By Leading Companies Between 2010 and 2015
Figure 36 New Product/Service/Technology Development is the Key Strategy Adopted By Companies and 2013 & 2014 Were the Most Active Years
Figure 37 Battle for Market Share: New Product/Service/Technology Development Was the Key Strategy
Figure 38 Geographical Revenue Mix of Leading Market Players
Figure 39 Shell Chemicals: Company Snapshot
Figure 40 Shell Chemicals: SWOT Analysis
Figure 41 Halliburton: Company Snapshot
Figure 42 Schlumberger: Company Snapshot
Figure 43 Baker Hughes: Company Snapshot
Figure 44 Basf SE: Company Snapshot
Figure 45 Basf SE: SWOT Analysis
Figure 46 The DOW Chemical Company: Company Snapshot
Figure 47 DOW Chemical Company: SWOT Analysis
Figure 48 Huntsman Corporation: Company Snapshot
Figure 49 Champion Technologies: Company Snapshot
Figure 50 Tiorco LLC: Company Snapshot
Figure 51 Stepan Company: Company Snapshot
Figure 52 Stepan Company: SWOT Analysis
Figure 53 Oil Chem Technologies LLC: Company Snapshot


Growth opportunities and latent adjacency in Chemical Enhanced Oil Recovery (EOR / IOR) Market