Oil and Gas Cloud Applications Market by Component (Solutions (EAM, Enterprise Applications, EHS, and Security) and Services), Deployment Type (Private and Public Cloud), Operation (Upstream, Midstream, and Downstream), and Region - Global Forecast to 2024


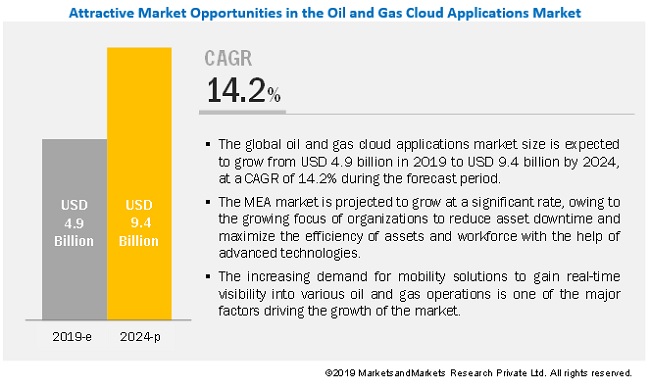
[157 Pages Report] MarketsandMarkets forecasts the global oil and gas cloud applications market size to grow from USD 4.9 billion in 2019 to USD 9.4 billion by 2024, at a Compound Annual Growth Rate (CAGR) of 14.2% during the forecast period. The major growth drivers of the market include the growing adoption of private cloud for encryption of data and lower operational costs.
Among solutions, the enterprise asset management segment to grow at the highest CAGR during the forecast period
The oil and gas cloud applications market is segmented by solution, into Enterprise Asset Management (EAM), enterprise applications, Environmental, Health, and Safety (EHS), security and others (simulation and modeling, and operational analytics). The EAM segment is the fastest-growing segment in the oil and gas cloud applications market. With the right EAM solution, oil and gas companies can not only keep their assets operating and reduce energy usage but also increase their efficiency and proactively identify problems before they may hamper any crucial operations.
By deployment type, private cloud to grow at a rapid pace during the forecast period
On the basis of deployment type, the oil and gas cloud applications market is segmented into public cloud and private cloud. Private cloud is a secured cloud-based environment that provides high levels of security and encryption, thereby enabling end users to store and process their critical data within the firewall of organizations.Large enterprises prefer private clouds more than SMEs. The reason behind large enterprises� inclination toward private cloud is their ability to spend more on the hardware and storage options.
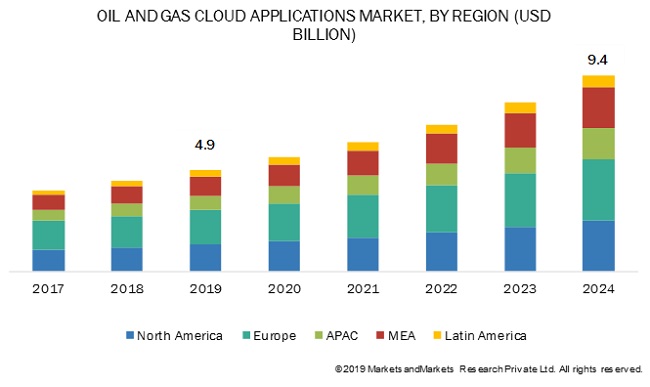
Europe to hold the largest market size during the forecast period
Europe is expected to hold the largest market size in the global oil and gas cloud applications market, while Middle East and Africa (MEA) is expected to grow at the highest CAGR during the forecast period. In MEA, the high growth rate can be attributed to cloud-enabled technologies gaining unprecedented traction. MEA is the largest producer and exporter of oil and gas. After a major drop in oil prices in 2015�16, the region is engaging itself in digitalization and other areas to lower costs and improve the cost-effectiveness in overall production.
Europe is dominating the oil and gas cloud applications market, as it is the fourth-largest producer of oil and gas and is already on its way to digital transformation. The region, with an abundance of oil and gas reserves, especially in the Norwegian belt and North Sea areas, is expected to embrace the cloud computing technology to achieve cost and operational efficiencies.
Key Market Players
Major vendors in the global oil and gas cloud applications market include Microsoft (US), IBM (US), SAP (Germany), Oracle (US), Salesforce (US), AspenTech (US), Dassault Syst�mes (France), Workday (US), ABB (Switzerland), IFS (Sweden), Infor (US), Risk Edge Solutions (India), Seven Lakes Solutions (US), Bentley Systems (US), Aucerna (Canada), TIBCO (US), PetroDE (US), Sage Software Solutions (India), HPE (US), and Quorum Software (US). These vendors have adopted various organic and inorganic growth strategies, such as new product launches, partnerships and collaborations, and mergers and acquisitions, to expand their presence in the global oil and gas cloud applications market.
Oracle (US) develops database platforms, middleware software, application software, cloud infrastructure systems, computer servers, storage, and networking products. To cater to the demands of its clientele from the oil and gas industry, Oracle offers complete, secure, and integrated cloud solutions for strategic planning, materials management, finance, asset management, Human Resources (HR), marketing, customer engagement, and other core functions. Oracle Cloud solutions enable oil and gas organizations to modernize and integrate business processes and technology in a simple, straightforward way to bring the company�s legacy operations into modern age functioning. With a better understanding of the evolving market trends in cloud, analytics, and software, the company has been developing customized client-centric solutions to further cater to demands of its customers from the oil and gas industry.
Get online access to the report on the World's First Market Intelligence Cloud
- Easy to Download Historical Data & Forecast Numbers
- Company Analysis Dashboard for high growth potential opportunities
- Research Analyst Access for customization & queries
- Competitor Analysis with Interactive dashboard
- Latest News, Updates & Trend analysis
Request Sample Scope of the Report
Get online access to the report on the World's First Market Intelligence Cloud
- Easy to Download Historical Data & Forecast Numbers
- Company Analysis Dashboard for high growth potential opportunities
- Research Analyst Access for customization & queries
- Competitor Analysis with Interactive dashboard
- Latest News, Updates & Trend analysis

|
Report Metrics |
Details |
|
Market size available for years |
2017�2024 |
|
Base year considered |
2018 |
|
Forecast period |
2019�2024 |
|
Forecast units |
Million (USD) |
|
Segments covered |
Component, Operation, Deployment Type, and Region |
|
Geographies covered |
North America, Europe, APAC, Latin America, and MEA |
|
Companies covered |
IBM (US), Oracle (US), Microsoft (US), SAP (Germany), Salesforce (US), AspenTech (US), Dassault Syst�mes (France), Workday (US), ABB (Switzerland), IFS (Sweden), Infor (US), RiskEdge Solutions (India), Seven Lakes Technologies (US), Bentley Systems (US), Aucerna (Canada), TIBCO (US), PetroDE (US), Sage Software Solutions (India), HPE (US), and Quorum software (US) |
This research report categorizes the oil and gas cloud applications market based on component, operation, deployment type, and region.
By Component:
- Solutions
- Enterprise Asset Management (EAM)
- Enterprise Applications
- Environmental, Health and Safety (EHS)
- Security
- Others (Simulation and Modeling, and Operational Analytics)
- Services
- Consulting and Implementation
- Training, Support and Maintenance
By Operation:
- Upstream
- Midstream
- Downstream
By Deployment Type:
- Private Cloud
- Public Cloud
By Region:
- North America
- US
- Canada
- Europe
- UK
- Norway
- Russia
- Rest of Europe
- Asia Pacific (APAC)
- China
- India
- Rest of APAC
- Middle East and Africa (MEA)
- Kingdom of Saudi Arabia (KSA)
- Kuwait
- Rest of MEA
- Latin America
- Brazil
- Rest of Latin America
Recent Developments
- In July 2019, IBM acquired RedHat to strengthen its position as the leading hybrid cloud provider. Together, IBM and RedHat will accelerate innovation by offering a next-generation hybrid multicloud platform.
- In June 2019, Microsoft partnered with Oracle to enable both the company�s customers� to run mission-critical applications in an interconnected cloud environment. Connecting Microsoft Azure and Oracle Cloud would offer their customers a one-stop shop for all cloud services and applications required to run their entire business.
- In January 2019, Oracle setup a data center in Toronto, Canada. The new data center is expected to empower Oracle to deliver the industry�s broadest, deepest, and fastest-growing suite of cloud applications.
Critical questions the Report Answers
- What are the current trends driving the oil and gas cloud applications market?
- In which operations are most oil and gas companies deploying cloud applications?Where will all these developments take the industry in the mid- to long-term?
- Who are the top vendors in the market and what is their competitive analysis?
- What are the drivers and challenges faced by vendors of the oil and gas cloud applications market?
To speak to our analyst for a discussion on the above findings, click Speak to Analyst
Table of Contents
1 Introduction (Page No. - 19)
1.1 Objectives of the Study
1.2 Market Definition
1.2.1 Inclusions and Exclusions
1.3 Market Scope
1.3.1 Market Segmentation
1.3.2 Regions Covered
1.3.3 Years Considered for the Study
1.4 Currency Considered
1.5 Stakeholders
2 Research Methodology (Page No. - 23)
2.1 Research Data
2.1.1 Secondary Data
2.1.2 Primary Data
2.1.2.1 Breakup of Primary Profiles
2.1.2.2 Key Industry Insights
2.2 Market Breakup and Data Triangulation
2.3 Market Size Estimation
2.3.1 Top-Down Approach
2.3.2 Bottom-Up Approach
2.4 Market Forecast
2.5 Assumptions for the Study
2.6 Limitations of the Study
3 Executive Summary (Page No. - 30)
4 Premium Insights (Page No. - 33)
4.1 Attractive Market Opportunities in the Market
4.2 Europe Oil and Gas Cloud Applications Market, By Operation and Country
4.3 Market Major Countries
5 Market Overview and Industry Trends (Page No. - 36)
5.1 Introduction
5.2 Market Dynamics
5.2.1 Drivers
5.2.1.1 Growing Adoption of Private Cloud for Encrypting Data and Lowering Operational Costs
5.2.1.2 Increasing Demand for Mobility-Enabled Cloud Applications to Gain Real-Time Visibility of Oil and Gas Operations
5.2.2 Restraints
5.2.2.1 Stringent Government Rules and Regulatory Compliances
5.2.3 Opportunities
5.2.3.1 Maximizing Productivity of Assets and Workforce By Leveraging Advanced Technologies
5.2.3.2 Growing Investments in Digital Technologies to Create Digital Oilfields
5.2.4 Challenges
5.2.4.1 Growing Data Security Concerns
5.3 Industry Trends
5.3.1 Use Case 1: Felix Energy Choosen WellEz On-Demand Solution Offered By Quorum Software to Reduce It Costs and Streamline Post Job Performance Reviews of Their Employees
5.3.2 Use Case 2: Petrofac Implemented Aspentech Hysys Solution to Increase the Capacity of the Gas Plant and Minimize Capex
5.3.3 Use Case 3: Petronas Deployed the Aspen Petroleum Scheduler to Increase Alignment Between Planning Ans Scheduling Processes
5.3.4 Use Case 4: Astron Energy Reduces Assay Creation Time By 50% By Implementation of Aveva Unified Supply Chain Soultion
5.4 Regulatory Compliances
5.4.1 International Organization for Standardization 29001 Oil and Gas
5.4.2 Federal Energy Regulatory Commission
6 Oil and Gas Cloud Applications Market By Component (Page No. - 43)
6.1 Introduction
6.2 Solutions
6.2.1 Enterprise Asset Management
6.2.1.1 Demand for High-Functioning Assets and Uninterrupted Uptime in the Oil and Gas Industry to Drive the Growth of Eam Solutions
6.2.2 Enterprise Applications
6.2.2.1 Enterprise Resource Planning
6.2.2.1.1 Growing Need for 360-Degree Views on Operations to Drive the Growth of Enterprise Resource Planning Application
6.2.2.2 Customer Relationship Management
6.2.2.2.1 Increasing Focus on Managing Customer Data and Improving Sales and Marketing Processes in Real Time to Drive the Growth of Customer Relationship Management Application
6.2.2.3 Human Capital Management
6.2.2.3.1 Growing Need for a Holistic View of the Entire Workforce Lifecycle to Drive the Growth of Enterprise Applications
6.2.2.4 Supply Chain Management
6.2.2.4.1 Growing Focus of Organizations on a Uniform Scm Framework to Drive the Growth of the Scm Application
6.2.2.5 Business Intelligence
6.2.2.5.1 Need for Improving Operational Processes With Insights Gathered From Quality Data to Drive the Demand for BI Application
6.2.2.6 Project Portfolio Management
6.2.2.6.1 Need to Manage Complex Projects and Reduce Associated Costs and Risks to Drive the Growth of Project Portfolio Management Application
6.2.2.7 Others
6.2.3 Environmental, Health, and Safety
6.2.3.1 Growing Demand to Meet Compliance and Safety Standards for the Betterment of Workforce and Social Community to Drive the Growth of Ehs Solution
6.2.4 Security
6.2.4.1 Growing Focus to Safely Encrypt Enterprise-Wide Data and Mitigate Cyberattack Damage to Drive the Demand for Cloud Security Solutions
6.2.5 Others
6.3 Services
6.3.1 Consulting and Implementation
6.3.1.1 Need for Organizations to Identify the Right Set of Solutions for Improving Business Operations to Drive the Growth of Consulting and Implementation Services
6.3.2 Training, Support, and Maintenance
6.3.2.1 Need to Improve the Skills of Employees Working in Dynamic Environments to Drive the Growth of Training, Support, and Maintenance Services
7 Oil and Gas Cloud Applications Market By Deployment Type (Page No. - 56)
7.1 Introduction
7.2 Private Cloud
7.2.1 Oil and Gas Companies With High Security Concerns to Adopt the Private Cloud Model
7.3 Public Cloud
7.3.1 Organizations With a Focus on Scalability and Cost-Effectiveness to Adopt Public Cloud Model
8 Oil and Gas Cloud Applications Market By Operation (Page No. - 60)
8.1 Introduction
8.2 Upstream
8.2.1 Growing Focus of Organizations to Streamline Operational Workflows and Improve Incident Response Time to Drive the Growth of Cloud Applications in the Upstream Segment
8.3 Midstream
8.3.1 Focus of Oil and Gas Companies to Enhance Operational Efficiency and Safety of Pipelines and Storage Terminals to Drive the Growth of Cloud Applications in the Midstream Segment
8.4 Downstream
8.4.1 Focus of Organizations to Improve Supply and Distribution of Various Oil By-Products to Drive the Cloud Applications in the Downstream Segment
9 Oil and Gas Cloud Applications Market By Region (Page No. - 65)
9.1 Introduction
9.2 North America
9.2.1 United States
9.2.1.1 Growing Need to Secure Sensitive Data and Reduce the Operational Cost to Pave the Way for the Oil and Gas Industry to Adopt Cloud Applications in the United States
9.2.2 Canada
9.2.2.1 Organizations Operating in Canada Deploy Oil and Gas Cloud Applications Solutions to Increase the Value of Assets and Reduce Operating Costs
9.3 Europe
9.3.1 United Kingdom
9.3.1.1 Growing Need for Streamlined Business Process and Reduce Time to Market to Boost the Market in the United Kingdom
9.3.2 Norway
9.3.2.1 Increasing Demand for Digital Oilfields for Reducing Operational Costs to Boost the Market in Norway
9.3.3 Russia
9.3.3.1 Growing Need to Enhance the Production Process and Manage Assets Life Cycle to Fuel the Growth of Oil and Gas Cloud Applications in Russia
9.3.4 Rest Europe
9.4 Asia Pacific
9.4.1 China
9.4.1.1 Growing Need Among Industries to Adopt Simulation Techniques for Digitalizing Oilfields to Fuel the Oil and Gas Cloud Applications Market Growth in China
9.4.2 India
9.4.2.1 Leading Organizations in India Prefer Oil and Gas Cloud Applications to Reduce Operational Costs and Manage the Overall Production Process
9.4.3 Rest of Asia Pacific
9.5 Middle East and Africa
9.5.1 Kingdom of Saudi Arabia
9.5.1.1 Increasing Number of Oil and Gas Firms to Manage Asset Life Cycle Process and Reduce Operational Costs to Drive the Demand for Oil and Gas Cloud Applications in Kingdom of Saudi Arabia
9.5.2 Kuwait
9.5.2.1 Government Initiatives to Improve Oilfields and Increase Offshore Production to Boost the Growth of the Market in Kuwait
9.5.3 Rest of Middle East and Africa
9.6 Latin America
9.6.1 Brazil
9.6.1.1 Increasing Awareness of Oil and Gas Firms to Implement Cloud Applications for Improving Asset Life Cycle Process to Drive the Market Growth in Brazil
9.6.2 Rest of Latin America
10 Competitive Landscape (Page No. - 106)
10.1 Overview
10.2 Competitive Scenario
10.2.1 New Product Launches and Product Enhancements
10.2.2 Business Expansions
10.2.3 Acquisitions
10.2.4 Partnerships and Agreements
11 Company Profiles (Page No. - 112)
11.1 Introduction
(Business Overview, Solutions & Services, Key Insights, Recent Developments, SWOT Analysis, MnM View)*
11.2 IBM
11.3 Oracle
11.4 Microsoft
11.5 SAP
11.6 Salesforce
11.7 Aspentech
11.8 Dassault Syst�mes
11.9 Workday
11.10 ABB
11.11 IFS
11.12 Infor
11.13 Risk Edge Solutions
11.14 Seven Lakes Technologies
11.15 Bentley Systems
11.16 Aucerna
11.17 TIBCO
11.18 Petrode
11.19 Sage Software Solutions
11.20 HPE
11.21 Quorum Software
11.22 Right-To-Win
*Details on Business Overview, Solutions & Services, Key Insights, Recent Developments, SWOT Analysis, MnM View Might Not be Captured in Case of Unlisted Companies.
12 Appendix (Page No. - 150)
12.1 Discussion Guide
12.2 Knowledge Store: Marketsandmarkets� Subscription Portal
12.3 Available Customizations
12.4 Related Reports
12.5 Author Details
List of Tables (123 Tables)
Table 1 United States Dollar Exchange Rate, 2016�2018
Table 2 Factor Analysis
Table 3 Oil and Gas Cloud Applications Market Size, By Component, 2017�2024 (USD Million)
Table 4 Market Size By Solution, 2017�2024 (USD Million)
Table 5 Solutions: Oil and Gas Cloud Applications Market Size, By Region, 2017�2024 (USD Million)
Table 6 Enterprise Asset Management: Market Size By Region, 2017�2024 (USD Million)
Table 7 Enterprise Applications: Market Size By Region, 2017�2024 (USD Million)
Table 8 Environmental, Health, and Safety: Market Size By Region, 2017�2024 (USD Million)
Table 9 Security: Market Size By Region, 2017�2024 (USD Million)
Table 10 Others: Market Size By Region, 2017�2024 (USD Million)
Table 11 Services: Market Size By Type, 2017�2024 (USD Million)
Table 12 Services: Market Size By Region, 2017�2024 (USD Million)
Table 13 Consulting and Implementation: Market Size By Region, 2017�2024 (USD Million)
Table 14 Training, Support, and Maintenance: Market Size By Region, 2017�2024 (USD Million)
Table 15 Oil and Gas Cloud Applications Market Size, By Deployment Type, 2017�2024 (USD Million)
Table 16 Private Cloud: Market Size By Region, 2017�2024 (USD Million)
Table 17 Public Cloud: Market Size By Region, 2017�2024 (USD Million)
Table 18 Oil and Gas Cloud Applications Market Size, By Operation, 2017�2024 (USD Million)
Table 19 Upstream: Market Size By Region, 2017�2024 (USD Million)
Table 20 Midstream: Market Size By Region, 2017�2024 (USD Million)
Table 21 Downstream: Market Size By Region, 2017�2024 (USD Million)
Table 22 Oil and Gas Cloud Applications Market Size, By Region, 2017�2024 (USD Million)
Table 23 North America: Market Size By Component, 2017�2024 (USD Million)
Table 24 North America: Market Size By Solutions, 2017�2024 (USD Million)
Table 25 North America: Market Size By Services, 2017�2024 (USD Million)
Table 26 North America: Market Size By Operation, 2017�2024 (USD Million)
Table 27 North America: Market Size By Deployment Type, 2017�2024 (USD Million)
Table 28 North America: Market Size By Country 2017�2024 (USD Million)
Table 29 United States: Oil and Gas Cloud Applications Market Size, By Component, 2017�2024 (USD Million)
Table 30 United States: Market Size By Solutions, 2017�2024 (USD Million)
Table 31 United States: Market Size By Services, 2017�2024 (USD Million)
Table 32 United States: Market Size By Operation, 2017�2024 (USD Million)
Table 33 United States: Market Size By Deployment Type, 2017�2024 (USD Million)
Table 34 Canada: Oil and Gas Cloud Applications Market Size, By Component, 2017�2024 (USD Million)
Table 35 Canada: Market Size By Solutions, 2017�2024 (USD Million)
Table 36 Canada: Market Size By Services, 2017�2024 (USD Million)
Table 37 Canada: Market Size By Operation, 2017�2024 (USD Million)
Table 38 Canada: Market Size By Deployment Type, 2017�2024 (USD Million)
Table 39 Europe: Oil and Gas Cloud Applications Market Size, By Component, 2017�2024 (USD Million)
Table 40 Europe: Market Size By Solutions, 2017�2024 (USD Million)
Table 41 Europe: Market Size By Services, 2017�2024 (USD Million)
Table 42 Europe: Market Size By Operation, 2017�2024 (USD Million)
Table 43 Europe: Market Size By Deployment Type, 2017�2024 (USD Million)
Table 44 Europe: Market Size By Country, 2017�2024 (USD Million)
Table 45 United Kingdom: Oil and Gas Cloud Applications Market Size, By Component, 2017�2024 (USD Million)
Table 46 United Kingdom: Market Size By Solutions, 2017�2024 (USD Million)
Table 47 United Kingdom: Market Size By Services, 2017�2024 (USD Million)
Table 48 United Kingdom: Market Size By Operation, 2017�2024 (USD Million)
Table 49 United Kingdom: Market Size By Deployment Type, 2017�2024 (USD Million)
Table 50 Norway: Oil and Gas Cloud Applications Market Size, By Component, 2017�2024 (USD Million)
Table 51 Norway: Market Size By Solutions, 2017�2024 (USD Million)
Table 52 Norway: Market Size By Services, 2017�2024 (USD Million)
Table 53 Norway: Market Size By Operation, 2017�2024 (USD Million)
Table 54 Norway: Market Size By Deployment Type, 2017�2024 (USD Million)
Table 55 Russia: Oil and Gas Cloud Applications Market Size, By Component, 2017�2024 (USD Million)
Table 56 Russia: Market Size By Solutions, 2017�2024 (USD Million)
Table 57 Russia: Market Size By Services, 2017�2024 (USD Million)
Table 58 Russia: Market Size By Operation, 2017�2024 (USD Million)
Table 59 Russia: Market Size By Deployment Type, 2017�2024 (USD Million)
Table 60 Asia Pacific: Oil and Gas Cloud Applications Market Size, By Component, 2017�2024 (USD Million)
Table 61 Asia Pacific: Market Size By Solutions, 2017�2024 (USD Million)
Table 62 Asia Pacific: Market Size By Services, 2017�2024 (USD Million)
Table 63 Asia Pacific: Market Size By Operation, 2017�2024 (USD Million)
Table 64 Asia Pacific: Market Size By Deployment Type, 2017�2024 (USD Million)
Table 65 Asia Pacific: Market Size By Country, 2017�2024 (USD Million)
Table 66 China: Oil and Gas Cloud Applications Market Size, By Component, 2017�2024 (USD Million)
Table 67 China: Market Size By Solutions, 2017�2024 (USD Million)
Table 68 China: Market Size By Services, 2017�2024 (USD Million)
Table 69 China: Market Size By Operation, 2017�2024 (USD Million)
Table 70 China: Market Size By Deployment Type, 2017�2024 (USD Million)
Table 71 India: Oil and Gas Cloud Applications Market Size, By Component, 2017�2024 (USD Million)
Table 72 India: Market Size By Solutions, 2017�2024 (USD Million)
Table 73 India: Market Size By Services, 2017�2024 (USD Million)
Table 74 India: Market Size By Operation, 2017�2024 (USD Million)
Table 75 India: Market Size By Deployment Type, 2017�2024 (USD Million)
Table 76 Middle East and Africa: Oil and Gas Cloud Applications Market Size, By Component, 2017�2024 (USD Million)
Table 77 Middle East and Africa: Market Size By Solutions, 2017�2024 (USD Million)
Table 78 Middle East and Africa: Market Size By Services, 2017�2024 (USD Million)
Table 79 Middle East and Africa: Market Size By Operation, 2017�2024 (USD Million)
Table 80 Middle East and Africa: Market Size By Deployment Type, 2017�2024 (USD Million)
Table 81 Middle East and Africa: Market Size By Country, 2017�2024 (USD Million)
Table 82 Kingdom of Saudi Arabia: Oil and Gas Cloud Applications Market Size, By Component, 2017�2024 (USD Million)
Table 83 Kingdom of Saudi Arabia: Market Size By Solutions, 2017�2024 (USD Million)
Table 84 Kingdom of Saudi Arabia: Market Size By Services, 2017�2024 (USD Million)
Table 85 Kingdom of Saudi Arabia: Market Size By Operation, 2017�2024 (USD Million)
Table 86 Kingdom of Saudi Arabia: Market Size By Deployment Type, 2017�2024 (USD Million)
Table 87 Kuwait: Oil and Gas Cloud Applications Market Size, By Component, 2017�2024 (USD Million)
Table 88 Kuwait: Market Size By Solutions, 2017�2024 (USD Million)
Table 89 Kuwait: Market Size By Services, 2017�2024 (USD Million)
Table 90 Kuwait: Market Size By Operation, 2017�2024 (USD Million)
Table 91 Kuwait: Market Size By Deployment Type, 2017�2024 (USD Million)
Table 92 Latin America: Oil and Gas Cloud Applications Market Size, By Component, 2017�2024 (USD Million)
Table 93 Latin America: Market Size By Solutions, 2017�2024 (USD Million)
Table 94 Latin America: Market Size By Services, 2017�2024 (USD Million)
Table 95 Latin America: Market Size By Operation, 2017�2024 (USD Million)
Table 96 Latin America: Market Size By Deployment Type, 2017�2024 (USD Million)
Table 97 Latin America: Market Size By Country, 2017�2024 (USD Million)
Table 98 Brazil: Oil and Gas Cloud Applications Market Size, By Component, 2017�2024 (USD Million)
Table 99 Brazil: Market Size By Solutions, 2017�2024 (USD Million)
Table 100 Brazil: Market Size By Services, 2017�2024 (USD Million)
Table 101 Brazil: Market Size By Operation, 2017�2024 (USD Million)
Table 102 Brazil: Market Size By Deployment Type, 2017�2024 (USD Million)
Table 103 New Product/Solution Launches and Product Enhancements, 2017�2019
Table 104 Business Expansions, 2018�2019
Table 105 Acquisitions, 2018�2019
Table 106 Partnerships and Agreements, 2017�2019
Table 107 IBM: Organic Growth Strategies
Table 108 IBM: Inorganic Growth Strategies
Table 109 Oracle: Organic Growth Strategies
Table 110 Oracle: Inorganic Growth Strategies
Table 111 Microsoft: Inorganic Growth Strategies
Table 112 SAP: Organic Growth Strategies
Table 113 SAP: Inorganic Growth Strategies
Table 114 Salesforce: Inorganic Growth Strategies
Table 115 Aspentech: Organic Growth Strategies
Table 116 Aspentech: Inorganic Growth Strategies
Table 117 Dassault Syst�mes: Inorganic Growth Strategies
Table 118 Workday: Organic Growth Strategies
Table 119 Workday: Inorganic Growth Strategies
Table 120 ABB: Organic Growth Strategies
Table 121 ABB: Inorganic Growth Strategies
Table 122 IFS: Inorganic Growth Strategies
Table 123 Infor: Inorganic Growth Strategies
List of Figures (34 Figures)
Figure 1 Oil and Gas Cloud Applications Market: Research Design
Figure 2 Market Top-Down and Bottom-Up Approaches
Figure 3 Private Cloud Segment to Hold the Highest Share in the Oil and Gas Cloud Applications Market in 2019
Figure 4 Europe to Account for the Highest Share of the Market in 2019
Figure 5 Demand for Mobility-Driven Cloud Applications to Optimize Various Oil and Gas Operations and Manage Critical Data to be the Factors Driving the Oil and Gas Cloud Applications Market
Figure 6 Upstream Segment and Norway to Account for the Highest Shares in the European Oil and Gas Cloud Applications Market in 2019
Figure 7 Market in Kuwait to Grow at the Highest Rate During the Forecast Period
Figure 8 Drivers, Restraints, Opportunities, and Challenges: Oil and Gas Cloud Applications Market
Figure 9 Investments in Digital Technologies By the Oil and Gas Companies Across the Globe
Figure 10 Services Segment Projected to Grow at a Higher CAGR During the Forecast Period as Compared to the Solutions Segment
Figure 11 Enterprise Asset Management Segment to Grow at the Highest CAGR During the Forecast Period
Figure 12 Training, Support, and Maintenance Segment to Grow at a Higher CAGR During the Forecast Period
Figure 13 Private Cloud Segment to Grow at a Higher CAGR During the Forecast Period
Figure 14 Upstream Segment to Grow at the Highest CAGR During the Forecast Period
Figure 15 Middle East and Africa to Witness Significant Growth During the Forecast Period
Figure 16 Europe: Market Snapshot
Figure 17 Middle East and Africa: Market Snapshot
Figure 18 Key Developments By the Leading Players in the Oil and Gas Cloud Applications Market, 2017�2019
Figure 19 IBM: Company Snapshot
Figure 20 IBM: SWOT Analysis
Figure 21 Oracle: Company Snapshot
Figure 22 Oracle: SWOT Analysis
Figure 23 Microsoft: Company Snapshot
Figure 24 Microsoft: SWOT Analysis
Figure 25 SAP: Company Snapshot
Figure 26 SAP: SWOT Analysis
Figure 27 Salesforce: Company Snapshot
Figure 28 Salesforce: SWOT Analysis
Figure 29 Aspentech: Company Snapshot
Figure 30 Dassault Syst�mes: Company Snapshot
Figure 31 Workday: Company Snapshot
Figure 32 ABB: Company Snapshot
Figure 33 IFS: Company Snapshot
Figure 34 Infor: Company Snapshot
The study involved 4 major activities in estimating the current market size of the oil and gas cloud applications market. An extensive secondary research was done to collect information on the market, peer market, and the parent market. The next step was to validate these findings, assumptions, and sizing with industry experts across the value chain through primary research. Both top-down and bottom-up approaches were used to estimate the total market size. After that, the market breakup and data triangulation procedures were used to estimate the market size of the segments and subsegments of the oil and gas cloud applications market.
Secondary Research
In the secondary research process, various secondary sources, such as D&B Hoovers and Bloomberg, BusinessWeek, Dun Bradstreet, and Factiva have been referred to for identifying and collecting information for this study. Secondary sources included annual reports; press releases and investor presentations of companies; whitepapers, certified publications, and articles by recognized authors; gold standard and silver standard websites; Research and Development (R&D) organizations; regulatory bodies; and databases. Journals, repositories, and resources from the Journal of Cloud computing in the upstream oil and gas industry: A proposed way forward, and How the oil and gas sector could get it wrongwith cloud computing were referred to for understanding the integration of oil and gas cloud applications.
Primary Research
Various primary sources from both the supply and demand sides of the oil and gas cloud applications market were interviewed to obtain qualitative and quantitative information for this study. The primary sources from the supply side included industry experts, such as Chief Executive Officers (CEOs), Vice Presidents (VPs), technology and innovation directors, and related key executives from various vendors offering oil and gas cloud applications solutions, associated service providers, and system integrators operating in the targeted regions. All possible parameters that affect the market covered in this research study have been accounted for, viewed in extensive detail, verified through primary research, and analyzed to get the final quantitative and qualitative data.
The following is the breakup of primary profiles:

To know about the assumptions considered for the study, download the pdf brochure
Market Size Estimation
Both top-down and bottom-up approaches were used to estimate and validate the total size of the oil and gas cloud applications market. The top-down approach was used to derive the revenue contribution of top vendors and their offerings in the market. The bottom-up approach was used to arrive at the overall market size of the global oil and gas cloud applications market using key companies� revenue and their offerings in the market. The research methodology used to estimate the market size includes the following:
- Key players in the market were identified through extensive secondary research
- The market size, in terms of value, was determined through primary and secondary research processes
- All percentage, shares split, and breakups were determined using secondary sources and verified through primary sources
Data Triangulation
After arriving at the overall market size using the market size estimation processes as explained above, the market was split into several segments and subsegments. To complete the overall market engineering process and arrive at the exact statistics of each market segment and subsegment, data triangulation and market breakup procedures were employed, wherever applicable. The overall market size was then used in the top-down procedure to estimate the size of other individual markets via percentage splits of the market segmentation.
Report Objectives
- To define, segment, and project the global market size for oil and gas cloud applications
- To understand the structure of the oil and gas cloud applications market by identifying its various subsegments
- To provide detailed information about key factors influencing the growth of the market (drivers, restraints, opportunities, and industry-specific challenges)
- To analyze the micromarkets concerning individual growth trends, prospects, and their contribution to the overall market
- To project the size of the market and its submarkets, in terms of value, for the 5 regions (along with their respective key countries)
- To profile key players and comprehensively analyze their core competencies
- To understand the competitive landscape and identify significant growth strategies adopted by players across key regions
- To analyze competitive developments, such as expansions and fundings, new product launches, mergers and acquisitions, strategic partnerships and agreements in the oil and gas cloud applications market
Available Customizations
With the given market data, MarketsandMarkets offers customizations as per the company�s specific needs. The following customization options are available for the report:
Product Analysis
- Product matrix provides a detailed comparison of the product portfolio of each company
Geographic Analysis
- Further breakup of the North American oil and gas cloud applications market
- Further breakup of the European market
- Further breakup of the APAC market
- Further breakup of the Latin American market
- Further breakup of the MEA market
Company Information
- Detailed analysis and profiling of additional market players up to 20


Growth opportunities and latent adjacency in Oil and Gas Cloud Applications Market