Communication Test and Measurement Market

Communication Test and Measurement Market by Offering (Hardware, Software, Services), Test Solution, Type of Test (Enterprise Test, Field Network Test, Lab & Manufacturing Test, Network Assurance Test), End User and Region - Global Forecast to 2029

Report Code: TC 2194 Apr, 2024, by marketsandmarkets.com

Communication Test and Measurement Market - Size, Growth, Report & Analysis

[256 Pages Report] The global Communication Test and Measurement Market size was reached $9.6 billion in 2024 and is anticipated to hit a revenue around $14.9 billion by 2029, at a increasing CAGR of 9.1% during the forecast period. The deployment of next-generation networks, such as 5G and fiber-optic networks, requires specialized test and measurement solutions to validate network performance, optimize infrastructure, and ensure seamless integration with existing systems. With the growing concerns over cybersecurity threats and vulnerabilities in communication networks, there's an increased focus on security testing and monitoring solutions to identify and mitigate potential risks, driving the demand for specialized test and measurement tools in this area. This is driving the adoption of communication test and measurements around the world.
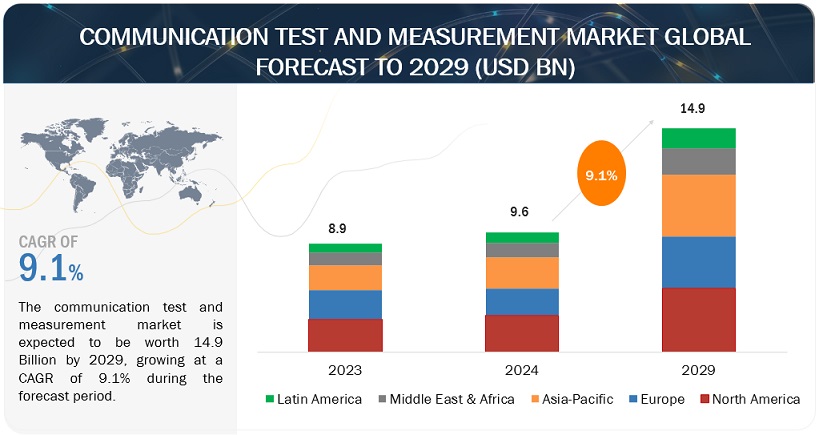
Communication Test and Measurement Market

To know about the assumptions considered for the study, Request for Free Sample Report
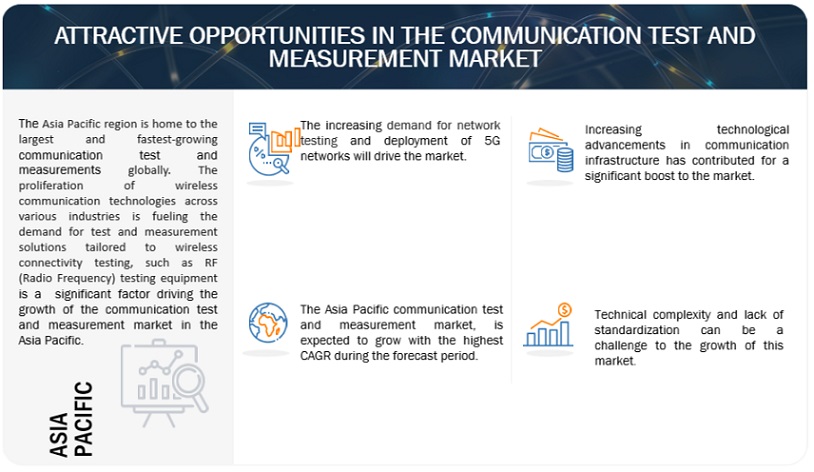
Communication Test and Measurement Market Opportunities

To know about the assumptions considered for the study, download the pdf brochure

Communication test and measurement market Dynamics

Driver:  Rapid technological advancements

The introduction of 5G technology, with its promise of enhanced speeds and connectivity, requires comprehensive testing to validate performance and compatibility. The expansion of the Internet of Things (IoT) introduces diverse communication needs, necessitating thorough evaluations of IoT networks and device interoperability. The integration of artificial intelligence (AI) into communication networks demands testing tools that can assess the impact of AI algorithms on network behavior and reliability. Additionally, the evolution of telecommunication standards, advancements in wireless technologies, and the rise of edge computing contribute to the increasing complexity of communication systems. Quantum communication, next-generation services like AR and VR, and continuous innovations in semiconductor technology further emphasize the critical role of testing solutions. As technology continues its rapid progression, communication test and measurement solutions remain integral in ensuring the seamless performance and reliability of modern communication networks and services.

Restraint: Lack of standardization

The absence of standardization stands as a formidable challenge within the communication test and measurement market, impeding its seamless evolution and hindering widespread adoption. The lack of uniform testing procedures and methodologies leads to inconsistencies in results across different organizations, making it challenging to compare and interpret findings. Interoperability becomes a major concern as standardized interfaces are essential for the cohesive integration of diverse testing tools with various communication technologies. The complexity of integrating different proprietary solutions and the prevalence of vendor-specific methodologies contribute to a fragmented market, limiting cross-industry compatibility. This absence of common standards also hampers innovation, delaying the development and adoption of cutting-edge technologies in the field. Training and certification processes are further complicated, and ensuring regulatory compliance becomes challenging without universally accepted testing practices. Quality assurance is compromised, impacting the reliability and repeatability of test results. Ultimately, the lack of standardization creates uncertainty, slowing down market growth and hindering the realization of a more interconnected and efficient communication test and measurement industry.

Opportunity: Deployment of 5G networks

The advent of 5G networks offers a pivotal opportunity for the communication test and measurement market, marked by a landscape of increased intricacies and novel requirements. The heightened network complexity of 5G, incorporating features such as massive MIMO and beamforming, creates a demand for specialized testing solutions to accurately validate and optimize performance. The broader spectrum allocation and frequency bands inherent in 5G provide a canvas for test and measurement equipment providers to develop solutions that ensure precision across diverse frequency ranges. The ultra-reliable low latency communication (URLLC) feature and massive Internet of Things (IoT) connectivity open avenues for tailored testing solutions, ensuring stringent performance standards and efficient communication for a vast array of IoT devices. Network slicing, a unique attribute of 5G, prompts the development of testing tools to validate virtualized, independent networks catering to specific use cases. Antenna and beamforming testing, dynamic spectrum sharing verification, and the imperative for security testing in the wake of 5G's integration into critical services all contribute to a rich landscape of opportunities.

Challenge: Security and privacy concerns

In the communication test and measurement market, security and privacy concerns emerge as formidable challenges that demand meticulous attention. The intricacies of handling sensitive information during testing processes, coupled with the necessity for robust encryption techniques, underscore the critical need for safeguarding data privacy and confidentiality. The potential exploitation of vulnerabilities in test interfaces poses a constant threat, requiring the implementation of stringent security measures to thwart unauthorized access to communication networks. Device security is equally paramount, necessitating secure boot processes, firmware integrity checks, and robust authentication mechanisms to prevent unauthorized modifications and ensure that only authorized personnel can access and control the test equipment. Compliance with diverse legal and regulatory frameworks, such as GDPR, adds an additional layer of complexity, compelling industry players to navigate and adhere to specific standards related to data protection and privacy. Implementing secure communication protocols and protecting against eavesdropping are imperative to preserve the integrity and confidentiality of data during transmission. Moreover, ensuring the security of the supply chain, with secure manufacturing processes and continuous monitoring through intrusion detection systems and regular security audits, is essential to fortify the resilience of communication test and measurement solutions against evolving cyber threats.

Communication test and measurement market Ecosystem

Prominent companies in this market have innovated their offerings and possess a diversified product portfolio, state-of-the-art technologies, and marketing networks. Prominent companies in this market include Anritsu (Japan), Fortive (US), EXFO (Canada), Rohde & Schwarz (Germany), Emerson (US), VIAVI Solutions (US), Yokogawa (Japan), Spirent Communications (UK), Keysight Technologies (US), Huawei (China).
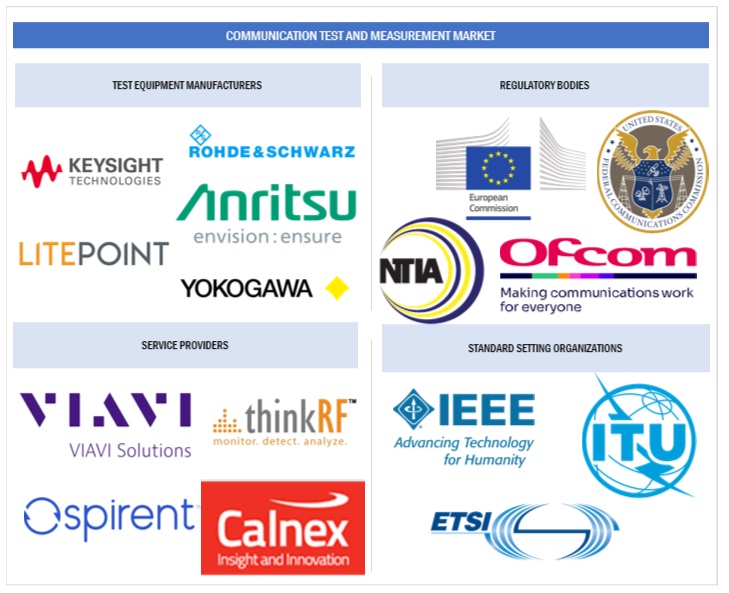
Top Companies in Communication Test and Measurement Market

Based on type of test, the lab & manufacturing test segment is expected to grow with the highest CAGR during the forecast period

Lab & manufacturing test solutions are used by network equipment manufacturers, mobile device manufacturers, and network operators for all phases of the product lifecycle. These solutions are used for all lab and manufacturing applications, such as optical connectors testing, Reconfigurable Optical Add/Drop Multiplexer (ROADM) component testing, and LTE protocol testing. Laboratories serve as the crucible for innovation, where engineers conduct research, development, and meticulous testing in controlled environments. Here, performance evaluation, protocol compliance, and equipment calibration are meticulously undertaken, providing insights crucial for optimizing system design and ensuring adherence to industry standards. Additionally, simulations enable engineers to model real-world scenarios, offering invaluable insights into system behavior under diverse conditions. Conversely, manufacturing testing focuses on mass production efficiency and quality assurance. Automated test systems streamline the evaluation process, ensuring each device meets specified performance criteria before leaving the production line. These tests, which include functional assessments and RF performance evaluations, serve to uphold product quality and consistency across batches.

By type of test, the field network test segment to hold the largest market size during the forecast period

Field network testing is a pivotal aspect of communication test and measurement, serving various purposes crucial for ensuring network reliability and performance in real-world environments. It encompasses performance verification, troubleshooting, and quality of service evaluation, allowing engineers to validate network throughput, latency, and packet loss while pinpointing and resolving issues promptly. Moreover, it aids in assessing coverage, signal strength, and interoperability, ensuring seamless communication across diverse technologies and vendors. Security assessments are also conducted to identify vulnerabilities and protect against cyber threats, while capacity planning relies on field data to anticipate future network demands and scale infrastructure accordingly. Overall, field network testing plays an indispensable role in optimizing communication networks, safeguarding their integrity, and enhancing the end-user experience.

Based on region, Asia Pacific is expected to grow with the highest CAGR during the forecast period

The communication test and measurement market in Asia Pacific has been experiencing significant growth and development. Asia Pacific offers significant growth opportunities for communication test and measurement solutions as end users, such as mobile device manufacturers, count heavily on these solutions to provide their customers with high-quality and high-performing services. Furthermore, increasing penetration of wireless communication standards is boosting their demand in the IT & telecommunications sector. China and India will continue to maintain their supremacy in the communication test and measurement market with the highest number of communication subscribers and a high data usage rate. Major communication test and measurement vendors, such as Yokogawa and Anritsu have a strong presence in this region. These players innovate their offerings in this market.
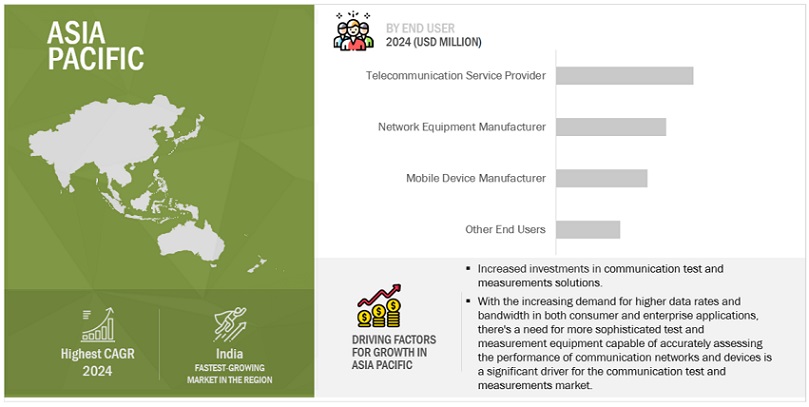
North American Communication Test and Measurement Market Size, and Share

Market Players:

The major players in the Communication test and measurement market are Keysight Technologies (US), Rohde & Schwarz (Germany), Anritsu (Japan), VIAVI Solutions (US), Yokogawa (Japan). These players have adopted various growth strategies, such as partnerships, agreements and collaborations, new product launches, product enhancements, and acquisitions to expand their footprint in the communication test and measurement market.

Get online access to the report on the World's First Market Intelligence Cloud

  • Easy to Download Historical Data & Forecast Numbers
  • Company Analysis Dashboard for high growth potential opportunities
  • Research Analyst Access for customization & queries
  • Competitor Analysis with Interactive dashboard
  • Latest News, Updates & Trend analysis
Request Sample

Scope of the Report

Report Metrics

Details

Market size available for years

2019-2029

Base year considered

2023

Forecast period

2024–2029

Forecast units

Value (USD) Million/Billion

Segments Covered

Offering (Hardware, Software, Services (Professional Services (Support Services, Consulting Services, Training Services), Managed Services)), Test Solution (Wireline Test Solution, Wireless Test Solution), Type of Test (Enterprise Test, Field Network Test, Lab & Manufacturing Test, Network Assurance Test), End User (Telecommunication Service Provider, Network Equipment Manufacturer, Mobile Device Manufacturer, Other End Users) and Region

Region covered

North America, Europe, Asia Pacific, Middle East & Africa, Latin America

Companies covered

Anritsu (Japan), Fortive (US), EXFO (Canada), Rohde & Schwarz (Germany), Emerson (US), VIAVI Solutions (US), Yokogawa (Japan), Spirent Communications (UK), Keysight Technologies (US), Huawei (China), Hammer (US), Calnex Solutions (UK), Luna Innovations (US), NetScout (US), Cisco (US), LitePoint (US), SysMech (England), VeEX (US), TEOCO Corporation (US), NetAlly (US), thinkRF (Canada), Kyrio (US), Fastech Telecommunications (India), Eagle Photonics (India), Verkotan (Finland)

This research report categorizes the communication test and measurement market based on offering, test solution, type of test, end user, and region.

Based on Offering:
  • Hardware
  • Software
  • Services
    • Professional Services
      • Support Services
      • Consulting Services
      • Training Services
    • Managed Services
Based on Test Solution:
  • Wireline Test Solution
  • Wireless Test Solution
Based on Type of Test:
  • Enterprise Test
  • Field Network Test
  • Lab & Manufacturing Test
  • Network Assurance Test
Based on End User:
  • Telecommunication Service Provider
  • Network Equipment Manufacturer
  • Mobile Device Manufacturer
  • Other End Users
Based on the region:
  • North America
    • US
    • Canada
  • Europe
    • UK
    • Germany
    • France
    • Italy
    • Rest of Europe
  • Asia Pacific
    • China
    • Japan
    • India
    • Rest of Asia Pacific
  • Middle East & Africa
    • GCC Countries
      • UAE
      • KSA
      • Rest of GCC Countries
    • South Africa
    • Rest of Middle East & Africa
  • Latin America
    • Brazil
    • Mexico
    • Rest of Latin America

Recent Developments

  • In March 2024, Keysight and ETS-Lindgren jointly developed an over-the-air (OTA) test solution. This solution is specifically for devices that support the narrowband non-terrestrial networks (NB-NTN) technology. This technology enables cellular communications to be deployed through satellite. The solution offers measurement and validation of the transmitter or receiver performance of NB-NTN supporting devices.
  • In March 2024, RAPA and Anritsu jointly cooperate in multiple fields to support the development of technologies, such as configuring a test environment capable of validating the candidate frequency bands for B5G/6G, specifically the FR3 (7 GHz to 24 GHz) and the sub-THz band (100 GHz and above), as well as the technical cooperation from proof of concept (PoC) phase.
  • In February 2024, Keysight Technologies launched the E7515W UXM Wireless Connectivity Test Platform for Wi-Fi. It is a network emulation system that provides Wi-Fi 7 devices with signaling radio frequency (RF) and throughput testing, that includes 4x4 MIMO 320 MHz bandwidth.
  • In February 2024, Anritsu Corporation introduced its new NR Licensed 6GHz Band Measurement MX800010A-014 software for the Radio Communication Test Station MT8000A, which supports RF tests in the 6 GHz band (5.925 GHz to 7.125 GHz) for 5G FR1[*2] devices.
  • In February 2024, Anritsu and MediaTek collaborate to verify advanced three uplink transmission (3TX) Technology featured in MediaTek's M80 5G Modem by using Anritsu's MT8000A all-in-one Radio Communication Test Station, providing a flexible test platform for ultrafast, large-capacity 5G communications.

Frequently Asked Questions (FAQ):

To speak to our analyst for a discussion on the above findings, click Speak to Analyst

TABLE OF CONTENTS
 
1 INTRODUCTION (Page No. - 40)
    1.1 STUDY OBJECTIVES 
    1.2 MARKET DEFINITION 
           1.2.1 INCLUSIONS & EXCLUSIONS
    1.3 STUDY SCOPE 
           1.3.1 MARKETS COVERED
                    FIGURE 1 MARKET SEGMENTATION
           1.3.2 GEOGRAPHIC SCOPE
                    FIGURE 2 MARKET: GEOGRAPHIC SCOPE
           1.3.3 YEARS CONSIDERED
                    FIGURE 3 YEARS OF STUDY CONSIDERED
    1.4 CURRENCY CONSIDERED 
           TABLE 1 USD EXCHANGE RATES, 2021–2023
    1.5 STAKEHOLDERS 
    1.6 SUMMARY OF CHANGES 
           1.6.1 IMPACT OF RECESSION
 
2 RESEARCH METHODOLOGY (Page No. - 45)
    2.1 RESEARCH DATA 
           FIGURE 4 COMMUNICATION TEST AND MEASUREMENT MARKET: RESEARCH DESIGN
           2.1.1 SECONDARY DATA
                    2.1.1.1 Secondary sources
                               FIGURE 5 SECONDARY SOURCES
           2.1.2 PRIMARY DATA
                    2.1.2.1 Primary interviews with experts
                               TABLE 2 PRIMARY SOURCES
                    2.1.2.2 Breakdown of primaries
                               FIGURE 6 BREAKDOWN OF PRIMARIES, BY COMPANY, DESIGNATION, AND REGION
                    2.1.2.3 Key data from primary sources
                               FIGURE 7 KEY DATA FROM PRIMARY SOURCES
                    2.1.2.4 Key industry insights
                               FIGURE 8 INSIGHTS FROM KEY INDUSTRY EXPERTS
    2.2 MARKET SIZE ESTIMATION 
           FIGURE 9 APPROACH 1 (SUPPLY-SIDE): REVENUE OF OFFERINGS IN MARKET
           FIGURE 10 APPROACH 2 (DEMAND-SIDE): SPENDING AT EACH LEVEL IN MARKET
           FIGURE 11 COMMUNICATION TEST AND MEASUREMENT MARKET: TOP-DOWN AND BOTTOM-UP APPROACHES
           2.2.1 TOP-DOWN APPROACH
           2.2.2 BOTTOM-UP APPROACH
    2.3 DATA TRIANGULATION 
           FIGURE 12 DATA TRIANGULATION
           TABLE 3 FACTOR ANALYSIS
    2.4 RESEARCH ASSUMPTIONS 
    2.5 LIMITATIONS 
    2.6 RECESSION IMPACT ON MARKET 
 
3 EXECUTIVE SUMMARY (Page No. - 55)
    FIGURE 13 MARKET, 2022–2029 (USD MILLION) 
    FIGURE 14 MARKET: REGIONAL SHARE, 2024 
 
4 PREMIUM INSIGHTS (Page No. - 59)
    4.1 BRIEF OVERVIEW OF MARKET 
           FIGURE 15 GROWING DEPLOYMENT OF 5G NETWORKS TO OPEN OPPORTUNITIES IN COMMUNICATION TEST AND MEASUREMENT MARKET
    4.2 NORTH AMERICA: MARKET, BY OFFERING AND COUNTRY 
           FIGURE 16 HARDWARE AND US TO ACCOUNT FOR LARGER RESPECTIVE SEGMENTAL SHARES OF MARKET IN NORTH AMERICA
    4.3 ASIA PACIFIC: MARKET, BY OFFERING & TOP THREE COUNTRIES 
           FIGURE 17 HARDWARE AND CHINA TO ACCOUNT FOR LARGER RESPECTIVE SEGMENTAL SHARES OF MARKET IN ASIA PACIFIC
    4.4 MARKET,  BY END USER 
           FIGURE 18 TELECOMMUNICATION SERVICE PROVIDERS TO ACCOUNT FOR LARGEST MARKET SHARE
    4.5 MARKET,  BY TYPE OF TEST 
           FIGURE 19 FIELD NETWORK TEST ACCOUNT FOR RESPECTIVE LARGER MARKET SHARES
 
5 MARKET OVERVIEW AND INDUSTRY TRENDS (Page No. - 62)
    5.1 MARKET OVERVIEW 
    5.2 MARKET DYNAMICS 
           FIGURE 20 DRIVERS, RESTRAINTS, OPPORTUNITIES, AND CHALLENGES: COMMUNICATION TEST AND MEASUREMENT MARKET
           5.2.1 DRIVERS
                    5.2.1.1 Growth in demand for network testing
                    5.2.1.2 Rise in demand for automated products and need for communication test & measurement equipment
                    5.2.1.3 Rise in demand for bandwidth and traffic inspection
                    5.2.1.4 Rapid technological advancements
           5.2.2 RESTRAINTS
                    5.2.2.1 Price sensitivity
                    5.2.2.2 Lack of standardization
           5.2.3 OPPORTUNITIES
                    5.2.3.1 Deployment of 5G networks
                    5.2.3.2 Advent of quantum communication testing
           5.2.4 CHALLENGES
                    5.2.4.1 Keeping pace with continually changing technologies
                    5.2.4.2 Security and privacy concerns
    5.3 INDUSTRY TRENDS 
           5.3.1 BRIEF HISTORY OF MARKET
                    FIGURE 21 BRIEF HISTORY OF COMMUNICATION TEST & MEASUREMENT
                    5.3.1.1 2000–2010
                    5.3.1.2 2010–2020
                    5.3.1.3 2020–Present
           5.3.2 DISRUPTIONS IMPACTING BUYERS/CUSTOMERS IN COMMUNICATION TEST AND MEASUREMENT MARKET
                    FIGURE 22 DISRUPTION TRENDS IMPACTING BUYERS/CUSTOMERS IN MARKET
           5.3.3 PRICING ANALYSIS
                    5.3.3.1 Average selling price trend of key players, by offering
                               FIGURE 23 AVERAGE SELLING PRICE TREND OF KEY PLAYERS, BY OFFERING (USD)
                               TABLE 4 AVERAGE SELLING PRICE OF KEY PLAYERS, BY OFFERING (USD)
                    5.3.3.2 Indicative pricing analysis of communication test & measurement, by offering
                               TABLE 5 INDICATIVE PRICING ANALYSIS OF COMMUNICATION TEST & MEASUREMENT,  BY OFFERING (USD)
    5.4 VALUE CHAIN ANALYSIS 
           FIGURE 24 COMMUNICATION TEST AND MEASUREMENT MARKET: VALUE CHAIN ANALYSIS
    5.5 ECOSYSTEM 
           FIGURE 25 COMMUNICATION TEST & MEASUREMENT ECOSYSTEM
           TABLE 6 MARKET: ECOSYSTEM
    5.6 TECHNOLOGY ANALYSIS 
           5.6.1 KEY TECHNOLOGIES
                    5.6.1.1 Internet of Things (IoT)
                    5.6.1.2 5G
                    5.6.1.3 NLP
           5.6.2 ADJACENT TECHNOLOGIES
                    5.6.2.1 Signal Processing
                    5.6.2.2 Embedded systems
           5.6.3 COMPLEMENTARY TECHNOLOGIES
                    5.6.3.1 Edge Computing
                    5.6.3.2 Data Analytics
    5.7 PATENT ANALYSIS 
           5.7.1 METHODOLOGY
                    FIGURE 26 LIST OF MAJOR PATENTS FOR COMMUNICATION TEST & MEASUREMENT
                    TABLE 7 LIST OF MAJOR PATENTS
    5.8 HS CODE: OSCILLOSCOPES AND OSCILLOGRAPHS (903020) 
           5.8.1 EXPORT SCENARIO
                    TABLE 8 EXPORT SCENARIO FOR HS CODE: 903020, BY COUNTRY, 2020–2022 (USD THOUSAND)
           5.8.2 IMPORT SCENARIO
                    TABLE 9 IMPORT SCENARIO FOR HS CODE: 903020, BY COUNTRY, 2020–2022 (USD THOUSAND)
    5.9 CASE STUDIES 
           5.9.1 TIER-1 US SERVICE PROVIDER DELIVERED HIGH-PERFORMANCE, RELIABLE IOT SERVICES OVER MOBILE NETWORK USING  SPIRENT’S SOLUTION
           5.9.2 VIAVI OTDR TESTING HELPED INTERLINK TELECOM IMPROVE EFFICIENCY OF FIBER MTTR
           5.9.3 TIER 1 COMMUNICATIONS SERVICE PROVIDER MONITORED ITS HYBRID ACCESS NETWORK WITH R&S INTRA
    5.1 KEY CONFERENCES & EVENTS 
           TABLE 10 COMMUNICATION TEST AND MEASUREMENT MARKET: DETAILED LIST OF CONFERENCES & EVENTS, 2024
    5.11 CURRENT AND EMERGING BUSINESS MODELS 
           5.11.1 TRADITIONAL MODEL
           5.11.2 SUBSCRIPTION MODEL
           5.11.3 TRADITIONAL SALES MODEL
           5.11.4 MANAGED SERVICES MODEL
           5.11.5 HYBRID MODEL
           5.11.6 PAY-PER-USE MODEL
    5.12 BEST PRACTICES IN MARKET 
    5.13 TOOLS, FRAMEWORKS, AND TECHNIQUES 
                    FIGURE 27 COMMUNICATION TEST & MEASUREMENT TOOLS, FRAMEWORKS, AND TECHNIQUES
    5.14 FUTURE LANDSCAPE OF MARKET 
           5.14.1 COMMUNICATION TEST & MEASUREMENT TECHNOLOGY ROADMAP TILL 2030
                    5.14.1.1 Short-term roadmap (2025–2026)
                    5.14.1.2 Mid-term roadmap (2026–2028)
                    5.14.1.3 Long-term roadmap (2028–2030)
    5.15 REGULATORY LANDSCAPE 
           5.15.1 REGULATORY BODIES, GOVERNMENT AGENCIES, AND OTHER ORGANIZATIONS
                    TABLE 11 NORTH AMERICA: LIST OF REGULATORY BODIES, GOVERNMENT AGENCIES, AND OTHER ORGANIZATIONS
                    TABLE 12 EUROPE: LIST OF REGULATORY BODIES, GOVERNMENT AGENCIES, AND OTHER ORGANIZATIONS
                    TABLE 13 ASIA PACIFIC: LIST OF REGULATORY BODIES, GOVERNMENT AGENCIES, AND OTHER ORGANIZATIONS
                    TABLE 14 MIDDLE EAST & AFRICA: LIST OF REGULATORY BODIES, GOVERNMENT AGENCIES, AND OTHER ORGANIZATIONS
                    TABLE 15 LATIN AMERICA: REGULATORY BODIES, GOVERNMENT AGENCIES, AND OTHER ORGANIZATIONS
           5.15.2 PERTINENT REGULATIONS
                    5.15.2.1 North America
                               5.15.2.1.1 US
                               5.15.2.1.2 Canada
                    5.15.2.2 Europe
                    5.15.2.3 Asia Pacific
                               5.15.2.3.1 South Korea
                               5.15.2.3.2 China
                               5.15.2.3.3 India
                    5.15.2.4 Middle East & Africa
                               5.15.2.4.1 UAE
                               5.15.2.4.2 KSA
                    5.15.2.5 Latin America
                               5.15.2.5.1 Brazil
                               5.15.2.5.2 Mexico
    5.16 PORTER’S FIVE FORCES ANALYSIS 
                    TABLE 16 MARKET: IMPACT OF PORTER’S FIVE FORCES
                    FIGURE 28 MARKET: PORTER’S FIVE FORCES MODEL
           5.16.1 THREAT OF NEW ENTRANTS
           5.16.2 THREAT OF SUBSTITUTES
           5.16.3 BARGAINING POWER OF BUYERS
           5.16.4 BARGAINING POWER OF SUPPLIERS
           5.16.5 INTENSITY OF COMPETITIVE RIVALRY
    5.17 KEY STAKEHOLDERS & BUYING CRITERIA 
           5.17.1 KEY STAKEHOLDERS IN BUYING PROCESS
                    FIGURE 29 INFLUENCE OF STAKEHOLDERS IN BUYING PROCESS FOR TOP THREE END-USE INDUSTRIES
                    TABLE 17 INFLUENCE OF STAKEHOLDERS IN BUYING PROCESS FOR TOP THREE END-USE INDUSTRIES
           5.17.2 BUYING CRITERIA
                    FIGURE 30 KEY BUYING CRITERIA FOR TOP THREE END-USE INDUSTRIES
                    TABLE 18 KEY BUYING CRITERIA FOR TOP THREE END-USE INDUSTRIES
    5.18 INVESTMENT AND FUNDING SCENARIO 
                    FIGURE 31 INVESTMENT AND FUNDING SCENARIO, 2019–2023 (USD MILLION)
 
6 COMMUNICATION TEST AND MEASUREMENT MARKET, BY OFFERING (Page No. - 93)
    6.1 INTRODUCTION 
           FIGURE 32 HARDWARE SEGMENT TO LEAD MARKET DURING FORECAST PERIOD
           TABLE 19 MARKET, BY OFFERING,  2019–2023 (USD MILLION)
           TABLE 20 MARKET, BY OFFERING,  2024–2029 (USD MILLION)
           6.1.1 OFFERING: MARKET DRIVERS
    6.2 HARDWARE 
           6.2.1 HARDWARE: FOUNDATION OF COMMUNICATION TEST & MEASUREMENT TECHNOLOGY LANDSCAPE
                    TABLE 21 COMMUNICATION TEST & MEASUREMENT HARDWARE MARKET, BY REGION,  2019–2023 (USD MILLION)
                    TABLE 22 COMMUNICATION TEST & MEASUREMENT HARDWARE MARKET, BY REGION, 2024–2029 (USD MILLION)
    6.3 SOFTWARE 
           6.3.1 SOFTWARE: INTEGRAL TO FRAMEWORK OF COMMUNICATION INFRASTRUCTURE
                    TABLE 23 COMMUNICATION TEST & MEASUREMENT SOFTWARE MARKET, BY REGION,  2019–2023 (USD MILLION)
                    TABLE 24 COMMUNICATION TEST & MEASUREMENT SOFTWARE MARKET, BY REGION, 2024–2029 (USD MILLION)
    6.4 SERVICES 
           6.4.1 RIGOROUS ASSESSMENT OF TECHNOLOGY KEY TO COMBATING EVOLVING THREATS
                    FIGURE 33 PROFESSIONAL SERVICES SEGMENT TO LEAD OVER MANAGED SERVICES DURING FORECAST PERIOD
                    TABLE 25 MARKET, BY SERVICE,  2019–2023 (USD MILLION)
                    TABLE 26 MARKET, BY SERVICE,  2024–2029 (USD MILLION)
                    TABLE 27 COMMUNICATION TEST & MEASUREMENT SERVICES MARKET, BY REGION,  2019–2023 (USD MILLION)
                    TABLE 28 COMMUNICATION TEST & MEASUREMENT SERVICES MARKET, BY REGION,  2024–2029 (USD MILLION)
           6.4.2 PROFESSIONAL SERVICES
                    FIGURE 34 SUPPORT SERVICES TO LEAD AMONG PROFESSIONAL SERVICES DURING FORECAST PERIOD
                    TABLE 29 MARKET, BY PROFESSIONAL SERVICE,  2019–2023 (USD MILLION)
                    TABLE 30 MARKET, BY PROFESSIONAL SERVICE,  2024–2029 (USD MILLION)
                    TABLE 31 COMMUNICATION TEST & MEASUREMENT PROFESSIONAL SERVICES MARKET,  BY REGION, 2019–2023 (USD MILLION)
                    TABLE 32 COMMUNICATION TEST & MEASUREMENT PROFESSIONAL SERVICES MARKET,  BY REGION, 2024–2029 (USD MILLION)
                    6.4.2.1 Support services
                               TABLE 33 COMMUNICATION TEST & MEASUREMENT SUPPORT SERVICES MARKET, BY REGION, 2019–2023 (USD MILLION)
                               TABLE 34 COMMUNICATION TEST & MEASUREMENT SUPPORT SERVICES MARKET, BY REGION, 2024–2029 (USD MILLION)
                    6.4.2.2 Consulting services
                               TABLE 35 COMMUNICATION TEST & MEASUREMENT CONSULTING SERVICES MARKET, BY REGION, 2019–2023 (USD MILLION)
                               TABLE 36 COMMUNICATION TEST & MEASUREMENT CONSULTING SERVICES MARKET, BY REGION, 2024–2029 (USD MILLION)
                    6.4.2.3 Training services
                               TABLE 37 COMMUNICATION TEST & MEASUREMENT TRAINING SERVICES MARKET, BY REGION, 2019–2023 (USD MILLION)
                               TABLE 38 COMMUNICATION TEST & MEASUREMENT TRAINING SERVICES MARKET, BY REGION, 2024–2029 (USD MILLION)
           6.4.3 MANAGED SERVICES
                    TABLE 39 COMMUNICATION TEST & MEASUREMENT MANAGED SERVICES MARKET, BY REGION, 2019–2023 (USD MILLION)
                    TABLE 40 COMMUNICATION TEST & MEASUREMENT MANAGED SERVICES MARKET, BY REGION, 2024–2029 (USD MILLION)
 
7 COMMUNICATION TEST & MEASUREMENT MARKET, BY TEST SOLUTION (Page No. - 106)
    7.1 INTRODUCTION 
           FIGURE 35 WIRELINE TEST SOLUTIONS SEGMENT TO DOMINATE DURING FORECAST PERIOD
           TABLE 41 MARKET, BY TEST SOLUTION, 2019–2023 (USD MILLION)
           TABLE 42 MARKET, BY TEST SOLUTION, 2024–2029 (USD MILLION)
           7.1.1 TEST SOLUTION: MARKET DRIVERS
    7.2 WIRELESS TEST SOLUTIONS 
           7.2.1 NEED FOR QUALITY ASSURANCE OF WIRELESS TECHNOLOGIES, ESPECIALLY WITH COMPLIANCE TESTING AND NETWORK OPTIMIZATION
                    TABLE 43 WIRELESS COMMUNICATION TEST SOLUTIONS MARKET, BY REGION,  2019–2023 (USD MILLION)
                    TABLE 44 WIRELESS COMMUNICATION TEST SOLUTIONS MARKET, BY REGION,  2024–2029 (USD MILLION)
    7.3 WIRELINE TEST SOLUTIONS 
           7.3.1 NEED TO MAINTAIN, CERTIFY, AND SECURE ROBUST FUNCTIONALITY OF WIRED COMMUNICATION NETWORKS
                    TABLE 45 WIRELINE COMMUNICATION TEST SOLUTIONS MARKET,  BY REGION, 2019–2023 (USD MILLION)
                    TABLE 46 WIRELINE COMMUNICATION TEST SOLUTIONS MARKET,  BY REGION, 2024–2029 (USD MILLION)
 
8 COMMUNICATION TEST & MEASUREMENT MARKET,  BY TYPE OF TEST (Page No. - 111)
    8.1 INTRODUCTION 
           FIGURE 36 FIELD NETWORK TESTS TO LEAD DURING FORECAST PERIOD
           TABLE 47 MARKET, BY TYPE OF TEST, 2019–2023 (USD MILLION)
           TABLE 48 MARKET, BY TYPE OF TEST, 2024–2029 (USD MILLION)
           8.1.1 TYPE OF TEST: MARKET DRIVERS
    8.2 ENTERPRISE TEST 
           8.2.1 ENSURING NETWORKS CAN HANDLE HEAVY TRAFFIC LOADS, SCALE TO MEET GROWING DEMANDS, AND COMPLY WITH INDUSTRY REGULATIONS
                    TABLE 49 COMMUNICATION ENTERPRISE TEST MARKET, BY REGION, 2019–2023 (USD MILLION)
                    TABLE 50 COMMUNICATION ENTERPRISE TEST MARKET, BY REGION, 2024–2029 (USD MILLION)
    8.3 FIELD NETWORK TEST 
           8.3.1 DEMAND FOR NETWORK RELIABILITY AND PERFORMANCE IN REAL-WORLD ENVIRONMENTS
                    TABLE 51 COMMUNICATION FIELD NETWORK TEST MARKET, BY REGION,  2019–2023 (USD MILLION)
                    TABLE 52 COMMUNICATION FIELD NETWORK TEST MARKET, BY REGION,  2024–2029 (USD MILLION)
    8.4 LAB & MANUFACTURING TEST 
           8.4.1 GROWTH IN NEED FOR CONSISTENT ENHANCED QUALITY STANDARDS AND TECHNOLOGICAL INNOVATIONS
                    TABLE 53 COMMUNICATION LAB & MANUFACTURING TEST MARKET, BY REGION,  2019–2023 (USD MILLION)
                    TABLE 54 COMMUNICATION LAB & MANUFACTURING TEST MARKET, BY REGION,  2024–2029 (USD MILLION)
    8.5 NETWORK ASSURANCE TEST 
           8.5.1 INCREASE IN NEED TO PROVIDE BETTER USER EXPERIENCE AND IMPROVE NETWORK PERFORMANCE
                    TABLE 55 COMMUNICATION NETWORK ASSURANCE TEST MARKET, BY REGION,  2019–2023 (USD MILLION)
                    TABLE 56 COMMUNICATION NETWORK ASSURANCE TEST MARKET, BY REGION,  2024–2029 (USD MILLION)
 
9 COMMUNICATION TEST & MEASUREMENT MARKET, BY END USER (Page No. - 118)
    9.1 INTRODUCTION 
           FIGURE 37 TELECOMMUNICATION SERVICE PROVIDER SEGMENT TO LARGELY LEAD DURING FORECAST PERIOD
           TABLE 57 MARKET, BY END USER,  2019–2023 (USD MILLION)
           TABLE 58 MARKET, BY END USER,  2024–2029 (USD MILLION)
           9.1.1 END USER: MARKET DRIVERS
    9.2 TELECOMMUNICATION SERVICE PROVIDERS 
           9.2.1 RELIANCE OF SERVICE PROVIDERS ON TEST & MEASUREMENT SOLUTIONS FOR OPTIMALLY PERFORMING NETWORKS THROUGHOUT THEIR LIFECYCLE
                    TABLE 59 MARKET FOR TELECOMMUNICATION SERVICE PROVIDERS, BY REGION, 2019–2023 (USD MILLION)
                    TABLE 60 MARKET FOR TELECOMMUNICATION SERVICE PROVIDERS, BY REGION, 2024–2029 (USD MILLION)
    9.3 NETWORK EQUIPMENT MANUFACTURERS (NEM) 
           9.3.1 VERSATILITY IN COMPATIBILITY OF TEST & MEASUREMENT EQUIPMENT WITH MULTIPLE COMMUNICATION TECHNOLOGIES
                    TABLE 61 MARKET FOR NETWORK EQUIPMENT MANUFACTURERS, BY REGION, 2019–2023 (USD MILLION)
                    TABLE 62 MARKET FOR NETWORK EQUIPMENT MANUFACTURERS, BY REGION, 2024–2029 (USD MILLION)
    9.4 MOBILE DEVICE MANUFACTURERS 
           9.4.1 RISE IN NEED TO ENSURE GLOBAL STANDARDS FOR NEW PRODUCTS
                    TABLE 63 MARKET FOR MOBILE DEVICE MANUFACTURERS, BY REGION, 2019–2023 (USD MILLION)
                    TABLE 64 MARKET FOR MOBILE DEVICE MANUFACTURERS, BY REGION, 2024–2029 (USD MILLION)
    9.5 OTHER END USERS 
           TABLE 65 MARKET FOR OTHER END USERS, BY REGION, 2019–2023 (USD MILLION)
           TABLE 66 MARKET FOR OTHER END USERS, BY REGION, 2024–2029 (USD MILLION)
 
10 COMMUNICATION TEST AND MEASUREMENT MARKET, BY REGION (Page No. - 125)
     10.1 INTRODUCTION 
               FIGURE 38 MARKET: REGIONAL SNAPSHOT, 2024
               FIGURE 39 ASIA PACIFIC TO ACCOUNT FOR HIGHEST CAGR DURING FORECAST PERIOD
               TABLE 67 MARKET, BY REGION,  2019–2023 (USD MILLION)
               TABLE 68 MARKET, BY REGION,  2024–2029 (USD MILLION)
     10.2 NORTH AMERICA 
               FIGURE 40 NORTH AMERICA: MARKET SNAPSHOT
             10.2.1 NORTH AMERICA: MARKET DRIVERS
             10.2.2 NORTH AMERICA: RECESSION IMPACT
                       TABLE 69 NORTH AMERICA: MARKET, BY OFFERING, 2019–2023 (USD MILLION)
                       TABLE 70 NORTH AMERICA: MARKET, BY OFFERING, 2024–2029 (USD MILLION)
                       TABLE 71 NORTH AMERICA: MARKET, BY SERVICE, 2019–2023 (USD MILLION)
                       TABLE 72 NORTH AMERICA: COMMUNICATION TEST AND MEASUREMENT MARKET, BY SERVICE, 2024–2029 (USD MILLION)
                       TABLE 73 NORTH AMERICA: MARKET, BY PROFESSIONAL SERVICE, 2019–2023 (USD MILLION)
                       TABLE 74 NORTH AMERICA: MARKET, BY PROFESSIONAL SERVICE, 2024–2029 (USD MILLION)
                       TABLE 75 NORTH AMERICA: MARKET, BY TEST SOLUTION, 2019–2023 (USD MILLION)
                       TABLE 76 NORTH AMERICA: MARKET, BY TEST SOLUTION, 2024–2029 (USD MILLION)
                       TABLE 77 NORTH AMERICA: MARKET, BY TYPE OF TEST, 2019–2023 (USD MILLION)
                       TABLE 78 NORTH AMERICA: MARKET, BY TYPE OF TEST, 2024–2029 (USD MILLION)
                       TABLE 79 NORTH AMERICA: MARKET, BY END USER, 2019–2023 (USD MILLION)
                       TABLE 80 NORTH AMERICA: MARKET, BY END USER, 2024–2029 (USD MILLION)
                       TABLE 81 NORTH AMERICA: MARKET, BY COUNTRY, 2019–2023 (USD MILLION)
                       TABLE 82 NORTH AMERICA: MARKET, BY COUNTRY, 2024–2029 (USD MILLION)
             10.2.3 US
                       10.2.3.1 Prominent communication test & measurement players offering cost-effective solutions
                                   TABLE 83 US: MARKET, BY OFFERING,  2019–2023 (USD MILLION)
                                   TABLE 84 US: MARKET, BY OFFERING,  2024–2029 (USD MILLION)
                                   TABLE 85 US: MARKET, BY SERVICE,  2019–2023 (USD MILLION)
                                   TABLE 86 US: COMMUNICATION TEST AND MEASUREMENT MARKET, BY SERVICE,  2024–2029 (USD MILLION)
                                   TABLE 87 US: MARKET, BY PROFESSIONAL SERVICE, 2019–2023 (USD MILLION)
                                   TABLE 88 US: MARKET, BY PROFESSIONAL SERVICE, 2024–2029 (USD MILLION)
                                   TABLE 89 US: MARKET, BY TEST SOLUTION,  2019–2023 (USD MILLION)
                                   TABLE 90 US: MARKET, BY TEST SOLUTION,  2024–2029 (USD MILLION)
                                   TABLE 91 US: MARKET, BY TYPE OF TEST,  2019–2023 (USD MILLION)
                                   TABLE 92 US: MARKET, BY TYPE OF TEST,  2024–2029 (USD MILLION)
                                   TABLE 93 US: MARKET, BY END USER,  2019–2023 (USD MILLION)
                                   TABLE 94 US: MARKET, BY END USER,  2024–2029 (USD MILLION)
             10.2.4 CANADA
                       10.2.4.1 Increase in investments for better communication test & measurement solutions
     10.3 EUROPE 
             10.3.1 EUROPE: COMMUNICATION TEST AND MEASUREMENT MARKET DRIVERS
             10.3.2 EUROPE: RECESSION IMPACT
                       TABLE 95 EUROPE: MARKET, BY OFFERING,  2019–2023 (USD MILLION)
                       TABLE 96 EUROPE: MARKET, BY OFFERING,  2024–2029 (USD MILLION)
                       TABLE 97 EUROPE: MARKET, BY SERVICE,  2019–2023 (USD MILLION)
                       TABLE 98 EUROPE: MARKET, BY SERVICE,  2024–2029 (USD MILLION)
                       TABLE 99 EUROPE: MARKET,  BY PROFESSIONAL SERVICE, 2019–2023 (USD MILLION)
                       TABLE 100 EUROPE: MARKET,  BY PROFESSIONAL SERVICE, 2024–2029 (USD MILLION)
                       TABLE 101 EUROPE: MARKET, BY TEST SOLUTION,  2019–2023 (USD MILLION)
                       TABLE 102 EUROPE: MARKET, BY TEST SOLUTION,  2024–2029 (USD MILLION)
                       TABLE 103 EUROPE: MARKET, BY TYPE OF TEST,  2019–2023 (USD MILLION)
                       TABLE 104 EUROPE: MARKET, BY TYPE OF TEST,  2024–2029 (USD MILLION)
                       TABLE 105 EUROPE: MARKET, BY END USER,  2019–2023 (USD MILLION)
                       TABLE 106 EUROPE: MARKET, BY END USER,  2024–2029 (USD MILLION)
                       TABLE 107 EUROPE: MARKET, BY COUNTRY,  2019–2023 (USD MILLION)
                       TABLE 108 EUROPE: MARKET, BY COUNTRY,  2024–2029 (USD MILLION)
             10.3.3 UK
                       10.3.3.1 Readiness in adopting new trends and global nature of telecommunications sector
                                   TABLE 109 UK: COMMUNICATION TEST AND MEASUREMENT MARKET, BY OFFERING,  2019–2023 (USD MILLION)
                                   TABLE 110 UK: MARKET, BY OFFERING,  2024–2029 (USD MILLION)
                                   TABLE 111 UK: MARKET, BY SERVICE,  2019–2023 (USD MILLION)
                                   TABLE 112 UK: MARKET, BY SERVICE,  2024–2029 (USD MILLION)
                                   TABLE 113 UK: MARKET, BY PROFESSIONAL SERVICE, 2019–2023 (USD MILLION)
                                   TABLE 114 UK: MARKET, BY PROFESSIONAL SERVICE, 2024–2029 (USD MILLION)
                                   TABLE 115 UK: MARKET, BY TEST SOLUTION,  2019–2023 (USD MILLION)
                                   TABLE 116 UK: MARKET, BY TEST SOLUTION,  2024–2029 (USD MILLION)
                                   TABLE 117 UK: MARKET, BY TYPE OF TEST,  2019–2023 (USD MILLION)
                                   TABLE 118 UK: MARKET, BY TYPE OF TEST,  2024–2029 (USD MILLION)
                                   TABLE 119 UK: MARKET, BY END USER,  2019–2023 (USD MILLION)
                                   TABLE 120 UK: MARKET, BY END USER,  2024–2029 (USD MILLION)
             10.3.4 GERMANY
                       10.3.4.1 Surge in initiatives for enhanced communication testing services
                                   TABLE 121 GERMANY: COMMUNICATION TEST AND MEASUREMENT MARKET, BY OFFERING,  2019–2023 (USD MILLION)
                                   TABLE 122 GERMANY: MARKET, BY OFFERING,  2024–2029 (USD MILLION)
                                   TABLE 123 GERMANY: MARKET, BY SERVICE,  2019–2023 (USD MILLION)
                                   TABLE 124 GERMANY: MARKET, BY SERVICE,  2024–2029 (USD MILLION)
                                   TABLE 125 GERMANY: MARKET,  BY PROFESSIONAL SERVICE, 2019–2023 (USD MILLION)
                                   TABLE 126 GERMANY: MARKET,  BY PROFESSIONAL SERVICE, 2024–2029 (USD MILLION)
                                   TABLE 127 GERMANY: MARKET, BY TEST SOLUTION, 2019–2023 (USD MILLION)
                                   TABLE 128 GERMANY: MARKET, BY TEST SOLUTION, 2024–2029 (USD MILLION)
                                   TABLE 129 GERMANY: MARKET, BY TYPE OF TEST,  2019–2023 (USD MILLION)
                                   TABLE 130 GERMANY: MARKET, BY TYPE OF TEST,  2024–2029 (USD MILLION)
                                   TABLE 131 GERMANY: MARKET, BY END USER,  2019–2023 (USD MILLION)
                                   TABLE 132 GERMANY: MARKET, BY END USER,  2024–2029 (USD MILLION)
             10.3.5 ITALY
                       10.3.5.1 Rise in demand for 5G, preference for renting test equipment, and adoption of cloud-based solutions
                                   TABLE 133 ITALY: COMMUNICATION TEST AND MEASUREMENT MARKET, BY OFFERING,  2019–2023 (USD MILLION)
                                   TABLE 134 ITALY: MARKET, BY OFFERING,  2024–2029 (USD MILLION)
                                   TABLE 135 ITALY: MARKET, BY SERVICE,  2019–2023 (USD MILLION)
                                   TABLE 136 ITALY: MARKET, BY SERVICE,  2024–2029 (USD MILLION)
                                   TABLE 137 ITALY: MARKET, BY PROFESSIONAL SERVICE, 2019–2023 (USD MILLION)
                                   TABLE 138 ITALY: MARKET, BY PROFESSIONAL SERVICE, 2024–2029 (USD MILLION)
                                   TABLE 139 ITALY: MARKET, BY TEST SOLUTION,  2019–2023 (USD MILLION)
                                   TABLE 140 ITALY: MARKET, BY TEST SOLUTION,  2024–2029 (USD MILLION)
                                   TABLE 141 ITALY: MARKET, BY TYPE OF TEST,  2019–2023 (USD MILLION)
                                   TABLE 142 ITALY: MARKET, BY TYPE OF TEST,  2024–2029 (USD MILLION)
                                   TABLE 143 ITALY: MARKET, BY END USER,  2019–2023 (USD MILLION)
                                   TABLE 144 ITALY: MARKET, BY END USER,  2024–2029 (USD MILLION)
             10.3.6 FRANCE
                       10.3.6.1 Projected increase in adoption of telecom service assurance testing solutions for smart city projects
             10.3.7 REST OF EUROPE
     10.4 ASIA PACIFIC 
               FIGURE 41 ASIA PACIFIC: MARKET SNAPSHOT
             10.4.1 ASIA PACIFIC: MARKET DRIVERS
             10.4.2 ASIA PACIFIC: RECESSION IMPACT
                       TABLE 145 ASIA PACIFIC: COMMUNICATION TEST AND MEASUREMENT MARKET, BY OFFERING,  2019–2023 (USD MILLION)
                       TABLE 146 ASIA PACIFIC: MARKET, BY OFFERING,  2024–2029 (USD MILLION)
                       TABLE 147 ASIA PACIFIC: MARKET, BY SERVICE,  2019–2023 (USD MILLION)
                       TABLE 148 ASIA PACIFIC: MARKET, BY SERVICE,  2024–2029 (USD MILLION)
                       TABLE 149 ASIA PACIFIC: MARKET,  BY PROFESSIONAL SERVICE, 2019–2023 (USD MILLION)
                       TABLE 150 ASIA PACIFIC: MARKET,  BY PROFESSIONAL SERVICE, 2024–2029 (USD MILLION)
                       TABLE 151 ASIA PACIFIC: MARKET, BY TEST SOLUTION, 2019–2023 (USD MILLION)
                       TABLE 152 ASIA PACIFIC: MARKET, BY TEST SOLUTION, 2024–2029 (USD MILLION)
                       TABLE 153 ASIA PACIFIC: MARKET, BY TYPE OF TEST, 2019–2023 (USD MILLION)
                       TABLE 154 ASIA PACIFIC: MARKET, BY TYPE OF TEST, 2024–2029 (USD MILLION)
                       TABLE 155 ASIA PACIFIC: MARKET, BY END USER,  2019–2023 (USD MILLION)
                       TABLE 156 ASIA PACIFIC: MARKET, BY END USER,  2024–2029 (USD MILLION)
                       TABLE 157 ASIA PACIFIC: MARKET, BY COUNTRY,  2019–2023 (USD MILLION)
                       TABLE 158 ASIA PACIFIC: MARKET, BY COUNTRY,  2024–2029 (USD MILLION)
             10.4.3 CHINA
                       10.4.3.1 Increase in focus on advanced communication testing solutions
                                   TABLE 159 CHINA: COMMUNICATION TEST AND MEASUREMENT MARKET, BY OFFERING,  2019–2023 (USD MILLION)
                                   TABLE 160 CHINA: MARKET, BY OFFERING,  2024–2029 (USD MILLION)
                                   TABLE 161 CHINA: MARKET, BY SERVICE,  2019–2023 (USD MILLION)
                                   TABLE 162 CHINA: MARKET, BY SERVICE,  2024–2029 (USD MILLION)
                                   TABLE 163 CHINA: MARKET, BY PROFESSIONAL SERVICE, 2019–2023 (USD MILLION)
                                   TABLE 164 CHINA: MARKET, BY PROFESSIONAL SERVICE, 2024–2029 (USD MILLION)
                                   TABLE 165 CHINA: MARKET, BY TEST SOLUTION,  2019–2023 (USD MILLION)
                                   TABLE 166 CHINA: MARKET, BY TEST SOLUTION,  2024–2029 (USD MILLION)
                                   TABLE 167 CHINA: MARKET, BY TYPE OF TEST,  2019–2023 (USD MILLION)
                                   TABLE 168 CHINA: MARKET, BY TYPE OF TEST,  2024–2029 (USD MILLION)
                                   TABLE 169 CHINA: MARKET, BY END USER,  2019–2023 (USD MILLION)
                                   TABLE 170 CHINA: MARKET, BY END USER,  2024–2029 (USD MILLION)
             10.4.4 JAPAN
                       10.4.4.1 Deployment of advanced technologies and
             10.4.5 INDIA
                       10.4.5.1 Increase in government initiatives to improve network infrastructure
             10.4.6 REST OF ASIA PACIFIC
     10.5 MIDDLE EAST & AFRICA 
             10.5.1 MIDDLE EAST & AFRICA: MARKET DRIVERS
             10.5.2 MIDDLE EAST & AFRICA: RECESSION IMPACT
                       TABLE 171 MIDDLE EAST & AFRICA: COMMUNICATION TEST AND MEASUREMENT MARKET,  BY OFFERING, 2019–2023 (USD MILLION)
                       TABLE 172 MIDDLE EAST & AFRICA: MARKET,  BY OFFERING, 2024–2029 (USD MILLION)
                       TABLE 173 MIDDLE EAST & AFRICA: MARKET, BY SERVICE, 2019–2023 (USD MILLION)
                       TABLE 174 MIDDLE EAST & AFRICA: MARKET, BY SERVICE, 2024–2029 (USD MILLION)
                       TABLE 175 MIDDLE EAST & AFRICA: MARKET,  BY PROFESSIONAL SERVICE, 2019–2023 (USD MILLION)
                       TABLE 176 MIDDLE EAST & AFRICA: MARKET,  BY PROFESSIONAL SERVICE, 2024–2029 (USD MILLION)
                       TABLE 177 MIDDLE EAST & AFRICA: MARKET,  BY TEST SOLUTION, 2019–2023 (USD MILLION)
                       TABLE 178 MIDDLE EAST & AFRICA: MARKET,  BY TEST SOLUTION, 2024–2029 (USD MILLION)
                       TABLE 179 MIDDLE EAST & AFRICA: MARKET,  BY TYPE OF TEST, 2019–2023 (USD MILLION)
                       TABLE 180 MIDDLE EAST & AFRICA: MARKET,  BY TYPE OF TEST, 2024–2029 (USD MILLION)
                       TABLE 181 MIDDLE EAST & AFRICA: MARKET,  BY END USER, 2019–2023 (USD MILLION)
                       TABLE 182 MIDDLE EAST & AFRICA: MARKET,  BY END USER, 2024–2029 (USD MILLION)
                       TABLE 183 MIDDLE EAST & AFRICA: MARKET,  BY COUNTRY/REGION, 2019–2023 (USD MILLION)
                       TABLE 184 MIDDLE EAST & AFRICA: MARKET,  BY COUNTRY/REGION, 2024–2029 (USD MILLION)
             10.5.3 GCC COUNTRIES
                       10.5.3.1 UAE
                                   10.5.3.1.1 Strong communication infrastructure warranted by high internet penetration rate
                       10.5.3.2 KSA
                                   10.5.3.2.1 Rapid expansion in ICT development and network infrastructure
                       10.5.3.3 Rest of GCC
             10.5.4 SOUTH AFRICA
                       10.5.4.1 Presence of significant players and rise in 5G adoption
             10.5.5 REST OF MIDDLE EAST & AFRICA
     10.6 LATIN AMERICA 
             10.6.1 LATIN AMERICA: MARKET DRIVERS
             10.6.2 LATIN AMERICA: RECESSION IMPACT
                       TABLE 185 LATIN AMERICA: COMMUNICATION TEST AND MEASUREMENT MARKET, BY OFFERING, 2019–2023 (USD MILLION)
                       TABLE 186 LATIN AMERICA: MARKET, BY OFFERING, 2024–2029 (USD MILLION)
                       TABLE 187 LATIN AMERICA: MARKET, BY SERVICE,  2019–2023 (USD MILLION)
                       TABLE 188 LATIN AMERICA: MARKET, BY SERVICE,  2024–2029 (USD MILLION)
                       TABLE 189 LATIN AMERICA: MARKET,  BY PROFESSIONAL SERVICE, 2019–2023 (USD MILLION)
                       TABLE 190 LATIN AMERICA: MARKET,  BY PROFESSIONAL SERVICE, 2024–2029 (USD MILLION)
                       TABLE 191 LATIN AMERICA: MARKET, BY TEST SOLUTION, 2019–2023 (USD MILLION)
                       TABLE 192 LATIN AMERICA: MARKET, BY TEST SOLUTION, 2024–2029 (USD MILLION)
                       TABLE 193 LATIN AMERICA: MARKET, BY TYPE OF TEST, 2019–2023 (USD MILLION)
                       TABLE 194 LATIN AMERICA: MARKET, BY TYPE OF TEST, 2024–2029 (USD MILLION)
                       TABLE 195 LATIN AMERICA: MARKET, BY END USER, 2019–2023 (USD MILLION)
                       TABLE 196 LATIN AMERICA: MARKET, BY END USER, 2024–2029 (USD MILLION)
                       TABLE 197 LATIN AMERICA: MARKET, BY COUNTRY, 2019–2023 (USD MILLION)
                       TABLE 198 LATIN AMERICA: MARKET, BY COUNTRY, 2024–2029 (USD MILLION)
             10.6.3 BRAZIL
                       10.6.3.1 Government investment in growing telecom sector
             10.6.4 MEXICO
                       10.6.4.1 Government Initiatives and testing tools for integrating new communication technologies
             10.6.5 REST OF LATIN AMERICA
 
11 COMPETITIVE LANDSCAPE (Page No. - 175)
     11.1 OVERVIEW 
     11.2 KEY PLAYER STRATEGIES/RIGHT TO WIN 
               TABLE 199 OVERVIEW OF STRATEGIES DEPLOYED BY KEY COMMUNICATION TEST & MEASUREMENT VENDORS
     11.3 REVENUE ANALYSIS 
               FIGURE 42 FIVE-YEAR REVENUE ANALYSIS OF KEY PLAYERS (USD MILLION)
     11.4 MARKET SHARE ANALYSIS 
               TABLE 200 MARKET: DEGREE OF COMPETITION
               FIGURE 43 MARKET: MARKET SHARE ANALYSIS, 2023
     11.5 MARKET RANKING ANALYSIS 
               FIGURE 44 MARKET RANKING ANALYSIS OF TOP FIVE PLAYERS
     11.6 COMPANY EVALUATION MATRIX: KEY PLAYERS 
             11.6.1 STARS
             11.6.2 EMERGING LEADERS
             11.6.3 PERVASIVE PLAYERS
             11.6.4 PARTICIPANTS
                       FIGURE 45 COMMUNICATION TEST AND MEASUREMENT MARKET: COMPANY EVALUATION MATRIX (KEY PLAYERS), 2023
             11.6.5 OVERALL COMPANY FOOTPRINT: KEY PLAYERS
                       TABLE 201 OVERALL COMPANY FOOTPRINT: KEY PLAYERS, 2023
                       TABLE 202 REGIONAL FOOTPRINT: KEY PLAYERS, 2023
                       TABLE 203 OFFERING FOOTPRINT: KEY PLAYERS, 2023
                       TABLE 204 TEST SOLUTION FOOTPRINT: KEY PLAYERS, 2023
                       TABLE 205 END USER FOOTPRINT: KEY PLAYERS, 2023
     11.7 COMPANY EVALUATION MATRIX: STARTUPS/SMES 
             11.7.1 PROGRESSIVE COMPANIES
             11.7.2 RESPONSIVE COMPANIES
             11.7.3 DYNAMIC COMPANIES
             11.7.4 STARTING BLOCKS
                       FIGURE 46 MARKET: COMPANY EVALUATION MATRIX (STARTUPS/SMES), 2023
             11.7.5 COMPETITIVE BENCHMARKING: STARTUPS/SMES
                       TABLE 206 DETAILED LIST OF KEY STARTUPS/SMES, 2023
                       TABLE 207 COMPETITIVE BENCHMARKING OF KEY STARTUPS/SMES
     11.8 COMPETITIVE SCENARIO 
             11.8.1 PRODUCT LAUNCHES
                       TABLE 208 MARKET: PRODUCT LAUNCHES,  JANUARY 2020–MARCH 2024
             11.8.2 DEALS
                       TABLE 209 MARKET: DEALS,  JANUARY 2020–MARCH 2024
     11.9 BRAND/PRODUCT COMPARISON 
               FIGURE 47 PROMINENT COMMUNICATION TEST & MEASUREMENT SOLUTIONS
     11.10 COMPANY VALUATION AND FINANCIAL METRICS 
               FIGURE 48 VALUATION AND FINANCIAL METRICS OF KEY COMMUNICATION TEST & MEASUREMENT VENDORS
 
12 COMPANY PROFILES (Page No. - 196)
     12.1 KEY PLAYERS 
(Business Overview, Products/Services/Solutions Offered, MnM View, Key Strengths and Right to Win, Strategic Choices Made, Weaknesses and Competitive Threats, Recent Developments)*
             12.1.1 KEYSIGHT TECHNOLOGIES
                       TABLE 210 KEYSIGHT TECHNOLOGIES: COMPANY OVERVIEW
                       FIGURE 49 KEYSIGHT TECHNOLOGIES: COMPANY SNAPSHOT
                       TABLE 211 KEYSIGHT TECHNOLOGIES: PRODUCTS/SOLUTIONS/SERVICES OFFERED
                       TABLE 212 KEYSIGHT TECHNOLOGIES: PRODUCT LAUNCHES
                       TABLE 213 KEYSIGHT TECHNOLOGIES: DEALS
             12.1.2 ROHDE & SCHWARZ
                       TABLE 214 ROHDE & SCHWARZ: COMPANY OVERVIEW
                       TABLE 215 ROHDE & SCHWARZ: PRODUCTS/SOLUTIONS/SERVICES OFFERED
                       TABLE 216 ROHDE & SCHWARZ: DEALS
             12.1.3 ANRITSU
                       TABLE 217 ANRITSU: COMPANY OVERVIEW
                       FIGURE 50 ANRITSU: COMPANY SNAPSHOT
                       TABLE 218 ANRITSU: PRODUCTS/SOLUTIONS/SERVICES OFFERED
                       TABLE 219 ANRITSU: PRODUCT LAUNCHES
                       TABLE 220 ANRITSU: DEALS
             12.1.4 VIAVI SOLUTIONS
                       TABLE 221 VIAVI SOLUTIONS: COMPANY OVERVIEW
                       FIGURE 51 VIAVI SOLUTIONS: COMPANY SNAPSHOT
                       TABLE 222 VIAVI SOLUTIONS: PRODUCTS/SOLUTIONS/SERVICES OFFERED
                       TABLE 223 VIAVI SOLUTIONS: PRODUCT LAUNCHES
             12.1.5 YOKOGAWA
                       TABLE 224 YOKOGAWA: COMPANY OVERVIEW
                       FIGURE 52 YOKOGAWA: COMPANY SNAPSHOT
                       TABLE 225 YOKOGAWA: PRODUCTS/SOLUTIONS/SERVICES OFFERED
                       TABLE 226 YOKOGAWA: PRODUCT LAUNCHES
             12.1.6 FORTIVE
                       TABLE 227 FORTIVE: BUSINESS OVERVIEW
                       FIGURE 53 FORTIVE: COMPANY SNAPSHOT
                       TABLE 228 FORTIVE: PRODUCTS/SOLUTIONS/SERVICES OFFERED
                       TABLE 229 FORTIVE: DEALS
             12.1.7 EXFO
                       TABLE 230 EXFO: BUSINESS OVERVIEW
                       TABLE 231 EXFO: PRODUCTS/SOLUTIONS/SERVICES OFFERED
             12.1.8 EMERSON
                       TABLE 232 EMERSON: COMPANY OVERVIEW
                       FIGURE 54 EMERSON: COMPANY SNAPSHOT
                       TABLE 233 EMERSON: PRODUCTS/SOLUTIONS/SERVICES OFFERED
                       TABLE 234 EMERSON: DEALS
             12.1.9 SPIRENT COMMUNICATIONS
                       TABLE 235 SPIRENT COMMUNICATIONS: COMPANY OVERVIEW
                       FIGURE 55 SPIRENT COMMUNICATION: COMPANY SNAPSHOT
                       TABLE 236 SPIRENT COMMUNICATIONS: PRODUCTS/SOLUTIONS/SERVICES OFFERED
                       TABLE 237 SPIRENT COMMUNICATIONS: DEALS
             12.1.10 HUAWEI
                                   TABLE 238 HUAWEI: COMPANY OVERVIEW
                                   FIGURE 56 HUAWEI: COMPANY SNAPSHOT
                                   TABLE 239 HUAWEI: PRODUCTS/SOLUTIONS/SERVICES OFFERED
*Business Overview, Products/Services/Solutions Offered, MnM View, Key Strengths and Right to Win, Strategic Choices Made, Weaknesses and Competitive Threats, Recent Developments might not be captured in case of unlisted companies.
     12.2 OTHER COMPANY PROFILES 
             12.2.1 HAMMER
             12.2.2 CALNEX SOLUTIONS
             12.2.3 LUNA INNOVATIONS
             12.2.4 NETSCOUT
             12.2.5 CISCO
     12.3 SMES/STARTUPS 
             12.3.1 LITEPOINT
             12.3.2 SYSMECH
             12.3.3 VEEX
             12.3.4 TEOCO CORPORATION
             12.3.5 NETALLY
             12.3.6 THINKRF
             12.3.7 KYRIO
             12.3.8 FASTECH TELECOMMUNICATIONS
             12.3.9 EAGLE PHOTONICS
             12.3.10 VERKOTAN
 
13 ADJACENT/RELATED MARKETS (Page No. - 244)
     13.1 INTRODUCTION TO ADJACENT MARKETS 
               TABLE 240 ADJACENT MARKETS AND FORECASTS
     13.2 LIMITATIONS 
     13.3 TEST AND MEASUREMENT EQUIPMENT MARKET 
             13.3.1 MARKET DEFINITION
                       TABLE 241 TEST AND MEASUREMENT EQUIPMENT MARKET, BY PRODUCT TYPE,  2019–2022 (USD MILLION)
                       TABLE 242 TEST AND MEASUREMENT EQUIPMENT MARKET, BY PRODUCT TYPE,  2023–2028 (USD MILLION)
                       TABLE 243 TEST AND MEASUREMENT EQUIPMENT MARKET, BY SERVICE TYPE,  2019–2022 (USD MILLION)
                       TABLE 244 TEST AND MEASUREMENT EQUIPMENT MARKET, BY SERVICE TYPE,  2023–2028 (USD MILLION)
                       TABLE 245 TEST AND MEASUREMENT EQUIPMENT MARKET, BY VERTICAL,  2019–2022 (USD MILLION)
                       TABLE 246 TEST AND MEASUREMENT EQUIPMENT MARKET, BY VERTICAL,  2023–2028 (USD MILLION)
                       TABLE 247 TEST AND MEASUREMENT EQUIPMENT MARKET, BY REGION, 2019–2022 (USD MILLION)
                       TABLE 248 TEST AND MEASUREMENT EQUIPMENT MARKET, BY REGION, 2023–2028 (USD MILLION)
     13.4 WIRELESS TESTING MARKET 
             13.4.1 MARKET DEFINITION
                       TABLE 249 WIRELESS TESTING MARKET, BY OFFERING, 2018–2021 (USD MILLION)
                       TABLE 250 WIRELESS TESTING MARKET, BY OFFERING, 2022–2027 (USD MILLION)
                       TABLE 251 WIRELESS TESTING MARKET, BY TYPE, 2018–2021 (USD MILLION)
                       TABLE 252 WIRELESS TESTING MARKET, BY TYPE, 2022–2027 (USD MILLION)
                       TABLE 253 WIRELESS TESTING SERVICE MARKET, BY TYPE, 2018–2021 (USD MILLION)
                       TABLE 254 WIRELESS TESTING SERVICE MARKET, BY TYPE, 2022–2027 (USD MILLION)
                       TABLE 255 WIRELESS TESTING EQUIPMENT MARKET, BY TYPE, 2018–2021 (USD MILLION)
                       TABLE 256 WIRELESS TESTING EQUIPMENT MARKET, BY TYPE, 2022–2027 (USD MILLION)
                       TABLE 257 WIRELESS DEVICE TESTING MARKET, BY TECHNOLOGY TYPE, 2018–2021 (USD MILLION)
                       TABLE 258 WIRELESS DEVICE TESTING MARKET, BY TECHNOLOGY TYPE, 2022–2027 (USD MILLION)
                       TABLE 259 WIRELESS TESTING MARKET, BY APPLICATION, 2018–2021 (USD MILLION)
                       TABLE 260 WIRELESS TESTING MARKET, BY APPLICATION, 2022–2027 (USD MILLION)
                       TABLE 261 WIRELESS TESTING MARKET, BY REGION, 2018–2021 (USD MILLION)
                       TABLE 262 WIRELESS TESTING MARKET, BY REGION, 2022–2027 (USD MILLION)
 
14 APPENDIX (Page No. - 251)
     14.1 DISCUSSION GUIDE 
     14.2 KNOWLEDGESTORE: MARKETSANDMARKETS’  SUBSCRIPTION PORTAL 
     14.3 CUSTOMIZATION OPTIONS 
     14.4 RELATED REPORTS 
     14.5 AUTHOR DETAILS 

The study involved four major activities in estimating the current size of the global communication test and measurement market. Exhaustive secondary research was done to collect information on the market, peer market, and parent market. The next step was to validate these findings, assumptions, and sizing with industry experts across the value chain through primary research. Both top-down and bottom-up approaches were employed to estimate the total communication test and measurement market size. After that, the market breakup and data triangulation techniques were used to estimate the market size of segments and subsegments.

Secondary Research

In the secondary research process, various secondary sources, such as Bloomberg and BusinessWeek, have been referred to identify and collect information for this study. The secondary sources included annual reports, press releases, and investor presentations of companies; white papers; and journals, such as Linux Journal and Container Journal, and articles from recognized authors, directories, and databases.

Primary Research

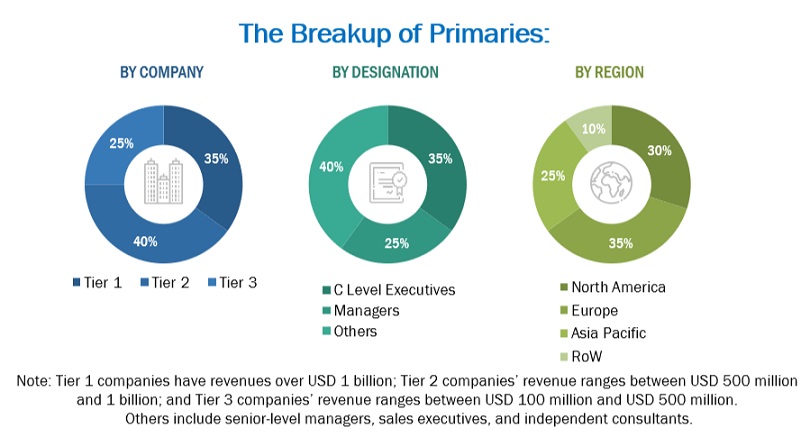
Various primary sources from both supply and demand sides were interviewed to obtain qualitative and quantitative information for this report. The primary sources from the supply side included industry experts, such as Chief Executive Officers (CEOs), Chief Marketing Officers (CMO), Vice Presidents (VPs), Managing Directors (MDs), technology and innovation directors, and related key executives from various key companies and organizations operating in the communication test and measurement market along with the associated service providers, and system integrators operating in the targeted regions. All possible parameters that affect the market covered in this research study have been accounted for, viewed in extensive detail, verified through primary research, and analyzed to get the final quantitative and qualitative data. Following is the breakup of primary respondents.
Communication Test and Measurement  Market Size, and Share

To know about the assumptions considered for the study, download the pdf brochure

Company Name

Designation

VIAVI Solutions

Senior Manager

LitePoint

VP

Spirent Communications

Business Executive

Market Size Estimation

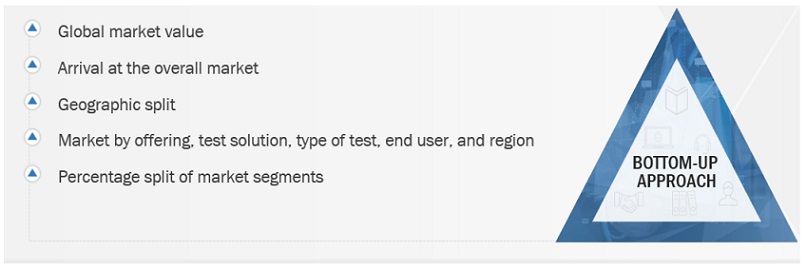
For making market estimates and forecasting the communication test and measurement market, and other dependent submarkets, the top-down and bottom-up approaches were used. The bottom-up procedure was used to arrive at the overall market size of the global communication test and measurement market using key companies’ revenue and their offerings in the market. The research methodology used to estimate the market size includes the following:

  • The key players in the Communication test and measurement market have been identified through extensive secondary research.
  • The market size, in terms of value, has been determined through primary and secondary research processes.
  • All percentage shares, splits, and breakups have been determined using secondary sources and verified through primary sources.

Communication test and measurement market Size: Bottom-Up Approach
Communication Test and Measurement  Market Bottom Up Approach

To know about the assumptions considered for the study, Request for Free Sample Report

Communication test and measurement market Size: Top-Down Approach

Communication Test and Measurement  Market Top Down Approach

Data Triangulation

With data triangulation and validation through primary interviews, the exact value of the overall parent market size was determined and confirmed using this study. The overall market size was then used in the top-down procedure to estimate the size of other individual markets via percentage splits of the market segmentation.

Market Definition

The communication test and measurement market comprise hardware, software, and services, which are used to test all devices and networks used for communication purposes. It's the process of evaluating and quantifying the performance and quality of communication networks, devices, and systems. Communication test and measurement equipment are used to test both wireless and wired networks. These tests and measurements can apply to various types of networks, including but not limited to, telecommunication networks, mobile networks, internet services, and broadcast networks.

Key Stakeholders

  • Communication Service Providers (CSPs)
  • Enterprises
  • Antenna Manufacturers
  • NEMs
  • Mobile Device Manufacturers
  • Chip Manufacturers
  • Network Installation and Maintenance Service Providers
  • Wireless Service Providers
  • Video Equipment Providers
  • Cable Providers
  • Suppliers
  • Channel Partners
  • Government Organizations
  • Mobile Network Operators (MNOs)

Report Objectives

  • To determine, segment, and forecast the global communication test and measurement market based on offering, test solution, type of test, end user, and region in terms of value.
  • To forecast the size of the market segments to five main regions: North America, Europe, Asia Pacific, Middle East & Africa, and Latin America.
  • To provide detailed information about the major factors (drivers, opportunities, threats, and challenges) influencing the growth of the communication test and measurement market.
  • To study the complete value chain and related industry segments and perform a value chain analysis of the communication test and measurement market landscape.
  • To strategically analyze the macro and micro markets to individual growth trends, prospects, and contributions to the total communication test and measurement market.
  • To analyze the industry trends, patents, and innovations related to the communication test and measurement market.
  • To analyze the opportunities for stakeholders by identifying the high-growth segments of the communication test and measurement market.
  • To profile the key players in the market and comprehensively analyze their market share/ranking and core competencies.
  • To track and analyze competitive developments, such as mergers & acquisitions, product launches & developments, partnerships, agreements, collaborations, business expansions, and Research & Development (R&D) activities.

Available Customizations

With the given market data, MarketsandMarkets offers customizations as per the company’s specific needs. The following customization options are available for the report:

Company Information

  • Detailed analysis and profiling of an additional two market players
Custom Market Research Services

We will customize the research for you, in case the report listed above does not meet with your exact requirements. Our custom research will comprehensively cover the business information you require to help you arrive at strategic and profitable business decisions.

Request Customization
Report Code
TC 2194
Published ON
Apr, 2024
Choose License Type
BUY NOW
  • SHARE
X
Request Customization
Speak to Analyst
Speak to Analyst
OR FACE-TO-FACE MEETING
PERSONALIZE THIS RESEARCH
  • Triangulate with your Own Data
  • Get Data as per your Format and Definition
  • Gain a Deeper Dive on a Specific Application, Geography, Customer or Competitor
  • Any level of Personalization
REQUEST A FREE CUSTOMIZATION
LET US HELP YOU!
  • What are the Known and Unknown Adjacencies Impacting the Communication Test and Measurement Market
  • What will your New Revenue Sources be?
  • Who will be your Top Customer; what will make them switch?
  • Defend your Market Share or Win Competitors
  • Get a Scorecard for Target Partners
CUSTOMIZED WORKSHOP REQUEST
+1-888-600-6441
  • Call Us
  • +1-888-600-6441 (Corporate office hours)
  • +1-888-600-6441 (US/Can toll free)
  • +44-800-368-9399 (UK office hours)
CONNECT WITH US
ABOUT TRUST ONLINE
©2024 MarketsandMarkets Research Private Ltd. All rights reserved
DMCA.com Protection Status Website Feedback