Competent Cells Market by Type (Chemically, Electrocompetent), Application (Subcloning, Phage Display Library Production, Unstable DNA Cloning, High-Throughput Cloning, Mutagenesis), End User (Pharmaceutical Companies, Academia) and Region


The global competent cells market is projected to reach grow at a CAGR of 10.2%. Advancements in molecular cloning research due to the emergence of new technologies and increasing commercial demand for molecular cloned products and recombinant proteins are the major factors driving the growth of the competent cells market.
Years considered in this report
2016 – Base Year
2017 – Estimated Year
2022 – Projected Year
The objectives of this study are as follows:
- To define, describe, and forecast the competent cells market on the basis of type, application, end user, and region
- To provide detailed information regarding the major factors influencing growth of the market (drivers, restraints, opportunities, and challenges)
- To strategically analyze micromarkets with respect to individual growth trends, prospects, and contributions to the overall market
- To analyze the opportunities in the market for stakeholders and provide details of the competitive landscape for market leaders
- To forecast revenue of the market segments with respect to four main regional segments, namely, North America, Europe, Asia-Pacific, and the Rest of the World (RoW)
- To profile key players and comprehensively analyze their market shares and core competencies in terms of market development and growth strategies
- To track and analyze competitive developments such as agreements, collaborations, and partnerships; acquisitions; and product launches in the competent cells market
Research Methodology
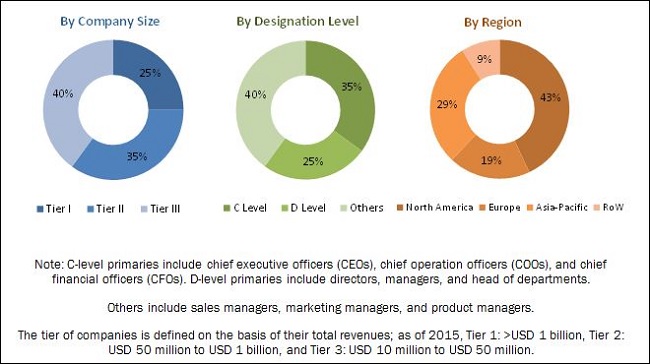
Top-down and bottom-up approaches were used to estimate and validate the size of the competent cells market and to estimate the size of various other dependent submarkets. The overall market size was used in the top-down approach to estimate the sizes of other individual markets (mentioned in the market segmentation by type, application, end user, and region) through percentage splits from secondary and primary research. The bottom-up approach was also implemented (wherever applicable) for data extracted from secondary research to validate the market segment revenues obtained. Various secondary sources referred to for this research study include publications from government sources such as Biotechnology and Biological Sciences Research Council (U.K.), Canadian Institutes of Health Research, European Federation of Biotechnology, Biotechnology Industry Research Assistance Council (BIRAC), National Center for Biotechnology Information (NCBI), Parenteral Drug Association (U.S.), U.S. FDA, World Bank, World Health Organization, Centers for Disease Control and Prevention (CDC): corporate filings such as annual reports, SEC filings, investor presentations, and financial statements have been used to identify and collect information useful for this extensive commercial study of the competent cells market. Primary sources such as experts from related industries and suppliers have been interviewed to obtain and verify critical information as well as to assess prospects of the competent cells market. The breakdown of profiles of primaries is shown in the figure below:
To know about the assumptions considered for the study, download the pdf brochure
Key players operating in the competent cells market include Merck KGaA (Germany) Promega Corporation (U.S.), Thermo Fisher Scientific, Inc. (U.S), New England Biolabs (U.S.), Takara Bio (Japan), Agilent Technologies (U.S.), Lucigen (Epicenter) (Illumina) (U.S.), QIAGEN N.V. (Germany), OriGene Technologies (U.S.), Bioline (U.K.), Zymo Research (U.S.), Beijing TransGen Biotech Co., Ltd. (China), Source BioScience (U.K.), IBA GmBH (Germany), Genewiz (U.S.), BioDynamics Laboratory, Inc. (Japan), GCC Biotech (India), SMOBIO Technology (Taiwan), GeneScript Corporation (U.S.), Bio-Rad Laboratories (U.S.), Life Technologies (India) Pvt. Ltd., Cell Applications, Inc. (U.S.), Delphi Genetics (Belgium), Scarab Genomics, LLC (U.S.), and Yeastern Biotech Co., Ltd. (Taiwan).
Target Audience for this Report:
- Competent cell manufacturers
- Research instrument manufacturers
- Competent cell distributors
- Various research and consulting companies
- Research laboratories and research institutes
- Universities and CROs
Value Addition for the Buyer:
This report aims to provide insights into the global competent cells market. It provides valuable information on competent cells type, application, and end user. Details on regional markets for these segments are also presented in this report. In addition, leading players in the market are profiled to understand the strategies undertaken by them to be competitive in this market.
Get online access to the report on the World's First Market Intelligence Cloud
Request Sample Scope of the Report
:

This report categorizes the competent cells market into the following segments:
By Type
- Chemically Competent Cells
- Electrocompetent Cells
By Application
-
Cloning
- Subcloning & Routine Cloning
- Phage Display Library Construction
- Toxic/Unstable DNA Cloning
- High-throughput Cloning
- Protein Expression
-
Other Applications
- Mutagenesis
- Single-stranded DNA Production
- Lentiviral Vector Production
- Large Plasmid Transformation
By End User
- Pharmaceutical and Biotechnology Companies
- Academic Research Institutes
- Contract Research Organizations (CROs)
By Region
-
North America
- U.S.
- Canada
-
Europe
- Germany
- France
- U.K.
- Rest of Europe (RoE)
-
Asia-Pacific
- China
- Japan
- India
- Australia
- Rest of Asia-Pacific (RoAPAC)
- Rest of the World (RoW)
Customization Options
- Detailed analysis and profiling of additional market players (up to 5)
- Further breakdown of the competent cells market into specific countries/regions in Europe and RoW
Competent cells are E.coli cells that possess altered cell walls which enable the assimilation of foreign DNA. These cells are widely used in cloning and protein expressions applications. The global competent cells market is projected to reach USD 2.22 Billion by 2022 from USD 1.37 Billion in 2017, at a CAGR of 10.2%. The advancements in molecular cloning research due to the emergence of new technologies and the growing commercial demand for molecular cloned products and recombinant proteins are the major driving factors for this market.
The competent cells market is segmented on the basis of type, application, and end user. On the basis of type, the competent cells market is segmented into chemically competent cells and electrocompetent cells. The chemically competent cells segment is expected to command the largest share of the global competent cells market in 2017. However, the electrocompetent cells segment is expected to grow at the highest CAGR during the forecast period. Electrocompetent cells offer high transformation efficiencies, making them suitable for many molecular biology applications such as the generation of cDNA libraries or constructing gene banks.
Based on the applications of competent cells, the market is broadly segmented into cloning, protein expression, and other applications. In 2017, cloning is expected to command the largest share of this market. Increasing research on cloning driven by government support and funding is among the major factors driving market growth in this segment. The cloning application is further segmented into subcloning & routine cloning, phage display library construction, toxic/unstable DNA cloning, and high-throughput cloning.
Other applications are further subsegmented into mutagenesis, single-stranded DNA production, lentiviral vector production, and large plasmid transformation. The other applications segment is expected to grow at the highest CAGR during the forecast period. This segment is primarily driven by the increasing intensity of research and technological advancements in competent cells. In addition, the growth in the Genomics market will enhance research in mutagenesis, thus driving the demand for competent cells.
On the basis of end user, the competent cells market has been segmented into academic research institutes, contract research organizations (CROs), and pharmaceutical & biotechnology companies. The pharmaceutical & biotechnology companies segment is expected to witness the highest growth during the forecast period. The growth of this segment is primarily due to the rising investments in research for developing genomics and proteomics-based products.
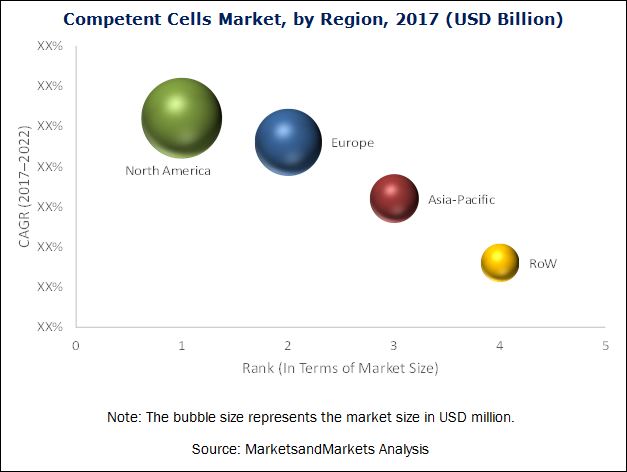
By region, the competent cells market is segmented into North America, Europe, Asia-Pacific, and the Rest of the World (RoW). The market is dominated by North America, followed by Europe. The North American region is expected to grow at the fastest CAGR during the forecast period. This is primarily due to increase in the R&D activities in the region.
The high cost of competent cells kits and increasing market consolidation creating strong entry barriers are some of the factors restraining the growth of this market.
Thermo Fisher Scientific, Inc. (U.S.), Merck KGaA (Germany), New England Biolabs (U.S.), Takara Bio, Inc. (Japan), Promega Corporation (U.S.), GenScript Biotech Corporation (China), and Agilent Technologies, Inc. (U.S.) are some of the prominent players in this market. These companies have a broad product portfolio with comprehensive features and have a strong geographical presence. Further, these leaders cater to the requirements of major end users such as research laboratories and pharmaceutical & biotechnology companies.
To speak to our analyst for a discussion on the above findings, click Speak to Analyst
Table of Contents
1 Introduction (Page No. - 14)
1.1 Objectives of the Study
1.2 Market Definition
1.3 Market Scope
1.3.1 Markets Covered
1.3.2 Years Considered for the Study
1.4 Currency
1.5 Limitations
1.6 Stakeholders
2 Research Methodology (Page No. - 17)
2.1 Market Size Estimation
2.2 Data Triangulation
2.3 Market Share Estimation
2.3.1 Key Data From Secondary Sources
2.3.2 Key Data From Primary Sources
2.3.3 Assumptions for the Study
3 Executive Summary (Page No. - 25)
4 Premium Insights (Page No. - 29)
4.1 Competent Cells: Market Overview
4.2 Competent Cells Market, By Cloning Application (2017)
4.3 Geographical Snapshot of the Competent Cells Market
4.4 Competent Cells Market, By Application, 2017 vs 2022
5 Market Overview (Page No. - 33)
5.1 Introduction
5.2 Market Dynamics
5.2.1 Drivers
5.2.1.1 Advancements in Molecular Cloning Research Due to the Emergence of New Technologies
5.2.1.2 Growing Commercial Demand for Molecular Cloned Products and Recombinant Proteins
5.2.2 Restraints
5.2.2.1 High Cost of Competent Cell Kits
5.2.2.2 Increasing Market Consolidation Creating Strong Entry Barriers
5.2.3 Opportunities
5.2.3.1 Emerging Markets
5.2.3.2 Emerging Applications of Competent Cells
5.2.4 Challenges
5.2.4.1 Lack of Skilled Professionals
6 Competent Cells Market, By Type (Page No. - 38)
6.1 Introduction
6.2 Chemically Competent Cells
6.3 Electrocompetent Cells
7 Competent Cells Market, By Application (Page No. - 42)
7.1 Introduction
7.2 Cloning
7.2.1 Subcloning & Routine Cloning
7.2.2 Phage Display Library Construction
7.2.3 Toxic/Unstable Dna Cloning
7.2.4 High-Throughput Cloning
7.3 Protein Expression
7.4 Other Applications
7.4.1 Mutagenesis
7.4.2 Large Plasmid Transformation
7.4.3 Single-Stranded Dna Production
7.4.4 Lentiviral Vector Production
8 Competent Cells Market, By End User (Page No. - 57)
8.1 Introduction
8.2 Academic Research Institutes
8.3 Pharmaceutical & Biotechnology Companies
8.4 Contract Research Organizations
9 Competent Cells Market, By Region (Page No. - 62)
9.1 Introduction
9.2 North America
9.2.1 U.S.
9.2.2 Canada
9.3 Europe
9.3.1 Germany
9.3.2 U.K.
9.3.3 France
9.3.4 Rest of Europe
9.4 Asia-Pacific
9.4.1 Japan
9.4.2 Australia
9.4.3 China
9.4.4 India
9.4.5 Rest of APAC
9.5 Rest of the World (RoW)
10 Competitive Landscape (Page No. - 109)
10.1 Introduction
10.2 Market Share Analysis
10.3 Competitive Leadership Mapping
10.3.1 Visionary Leaders
10.3.2 Innovators
10.3.3 Dynamic Differentiators
10.3.4 Emerging Companies
10.4 Competitive Benchmarking
10.4.1 Business Strategy Excellence (For 25 Players)
10.4.2 Strength of Product Portfolio (For 25 Players)
*Top 25 Companies Analyzed for This Study are - Merck KGaA (Germany), Promega Corporation (U.S.), Thermo Fisher Scientific, Inc. (U.S), New England Biolabs (U.S.), Takara Bio (Japan), Agilent Technologies (U.S.), Lucigen (Epicenter) (Illumina) (U.S.), Qiagen N.V. (Germany), Origene Technologies (U.S.), Bioline (U.K.), Zymo Research (U.S.), Beijing Transgen Biotech Co., Ltd. (China), Source Bioscience (U.K.), Iba GmbH (Germany), Genewiz (U.S.), Biodynamics Laboratory, Inc. (Japan), Gcc Biotech (India), Smobio Technology (Taiwan), Genescript Corporation (U.S.), Bio-Rad Laboratories (U.S.), Life Technologies (India) Pvt. Ltd., Cell Applications, Inc. (U.S.), Delphi Genetics (Belgium), Scarab Genomics, LLC (U.S.), and Yeastern Biotech Co., Ltd. (Taiwan).
11 Company Profiles (Page No. - 115)
(Overview, Strength of Product Portfolio Business Strategy Excellence Products Offering, Recent Development’s, Business Strategy)*
11.1 Thermo Fisher Scientific, Inc.
11.2 Merck KGaA
11.3 Promega Corporation
11.4 Takara Bio, Inc.
11.5 New England Biolabs, Inc.
11.6 Bio-Rad Laboratories, Inc.
11.7 Transgen Biotech, Inc.
11.8 Agilent Technologies, Inc.
11.9 Illumina, Inc.
11.10 Zymo Research
11.11 Qiagen N.V.
11.12 Genscript Biotech Corporation
11.13 Origene Technologies, Inc.
*Details on Overview, Strength of Product Portfolio, Business Strategy Excellence, Products Offerings, Recent Developments, and Business Strategies Might Not Be Captured in Case of Unlisted Companies.
12 Appendix (Page No. - 150)
12.1 Industry Insights
12.2 Discussion Guide
12.3 Knowledge Store: Marketsandmarkets’ Subscription Portal
12.4 Introducing RT: Real-Time Market Intelligence
12.5 Available Customizations
12.6 Related Reports
12.7 Author Details
List of Tables (101 Tables)
Table 1 Competent Cells Market, By Type, 2015–2022 (USD Million)
Table 2 Chemically Competent Cells Market, By Region, 2015–2022 (USD Million)
Table 3 Electrocompetent Cells Market, By Region, 2015–2022 (USD Million)
Table 4 Market Size, By Application, 2015–2022 (USD Million)
Table 5 Market for Cloning Applications, By Region, 2015–2022 (USD Million)
Table 6 Market for Cloning Applications, By Type, 2015–2022 (USD Million)
Table 7 Market for Subcloning & Routine Cloning, By Region, 2015–2022 (USD Million)
Table 8 Competent Cells Market for Phage Display Library Construction, By Region, 2015–2022 (USD Million)
Table 9 Competent Cells Market for Toxic/Unstable Dna Cloning, By Region, 2015–2022 (USD Million)
Table 10 Competent Cells Market for High-Throughput Cloning, By Region, 2015–2022 (USD Million)
Table 11 Competent Cells Market for Protein Expression Applications, By Region, 2015–2022 (USD Million)
Table 12 Competent Cells Market for Other Applications, By Region, 2015–2022 (USD Million)
Table 13 Competent Cells Market for Other Applications, By Type, 2015–2022 (USD Million)
Table 14 Market for Mutagenesis, By Region, 2015–2022 (USD Million)
Table 15 Market for Large Plasmid Transformation, By Region, 2015–2022 (USD Million)
Table 16 Market for Single-Stranded Dna Production, By Region, 2015–2022 (USD Million)
Table 17 Market for Lentiviral Vector Production, By Region, 2015–2022 (USD Million)
Table 18 Market, By End User, 2015–2022 (USD Million)
Table 19 U.S. R&D Performance, 2015
Table 20 Competent Cells Market for Academic Research Institutes, By Region, 2015–2022 (USD Million)
Table 21 Competent Cells Market for Pharmaceutical & Biotechnology Companies, By Region, 2015–2022 (USD Million)
Table 22 Competent Cells Market for Contract Research Organizations, By Region, 2015–2022 (USD Million)
Table 23 Competent Cells Market, By Region, 2015–2022 (USD Million)
Table 24 North America: Competent Cells Market, By Country, 2015–2022 (USD Million)
Table 25 North America: Market, By Type, 2015–2022 (USD Million)
Table 26 North America: Market, By Application, 2015–2022 (USD Million)
Table 27 North America: Market for Cloning Applications, By Type, 2015–2022 (USD Million)
Table 28 North America: Market for Other Applications, By Type, 2015–2022 (USD Million)
Table 29 North America: Market, By End User, 2015–2022 (USD Million)
Table 30 U.S.: Competent Cells Market, By Type, 2015–2022 (USD Million)
Table 31 U.S.: Market, By Application, 2015–2022 (USD Million)
Table 32 U.S.: Market for Cloning Applications, By Type, 2015–2022 (USD Million)
Table 33 U.S.: Market for Other Applications, By Type, 2015–2022 (USD Million)
Table 34 U.S.: Market, By End User, 2015–2022 (USD Million)
Table 35 Canada: Competent Cells Market, By Type, 2015–2022 (USD Million)
Table 36 Canada: Market, By Application, 2015–2022 (USD Million)
Table 37 Canada: Market for Cloning Applications, By Type, 2015–2022 (USD Million)
Table 38 Canada: Market for Other Applications, By Type, 2015–2022 (USD Million)
Table 39 Canada: Market, By End User, 2015–2022 (USD Million)
Table 40 Europe: Competent Cells Market, By Country, 2015–2022 (USD Million)
Table 41 Europe: Market, By Type, 2015–2022 (USD Million)
Table 42 Europe: Market, By Application, 2015–2022 (USD Million)
Table 43 Europe: Market for Cloning Applications, By Type, 2015–2022 (USD Million)
Table 44 Europe: Market for Other Applications, By Type, 2015–2022 (USD Million)
Table 45 Europe: Market, By End User, 2015–2022 (USD Million)
Table 46 Germany: Competent Cells Market, By Type, 2015–2022 (USD Million)
Table 47 Germany: Market, By Application, 2015–2022 (USD Million)
Table 48 Germany: Market for Cloning Applications, By Type, 2015–2022 (USD Million)
Table 49 Germany: Market for Other Applications, By Type, 2015–2022 (USD Million)
Table 50 Germany: Market, By End User, 2015–2022 (USD Million)
Table 51 U.K.: Competent Cells Market, By Type, 2015–2022 (USD Million)
Table 52 U.K.: Market, By Application, 2015–2022 (USD Million)
Table 53 U.K.: Market for Cloning Applications, By Type, 2015–2022 (USD Million)
Table 54 U.K.: Market for Other Applications, By Type, 2015–2022 (USD Million)
Table 55 U.K.: Market, By End User, 2015–2022 (USD Million)
Table 56 France: Competent Cells Market, By Type, 2015–2022 (USD Million)
Table 57 France: Market, By Application, 2015–2022 (USD Million)
Table 58 France: Market for Cloning Applications, By Type, 2015–2022 (USD Million)
Table 59 France: Market for Other Applications, By Type, 2015–2022 (USD Million)
Table 60 France: Market, By End User, 2015–2022 (USD Million)
Table 61 RoE: Competent Cells Market, By Type, 2015–2022 (USD Million)
Table 62 RoE: Market, By Application, 2015–2022 (USD Million)
Table 63 RoE: Market for Cloning Applications, By Type, 2015–2022 (USD Million)
Table 64 RoE: Market for Other Applications, By Type, 2015–2022 (USD Million)
Table 65 RoE: Market, By End User, 2015–2022 (USD Million)
Table 66 Asia-Pacific: Competent Cells Market, By Country, 2015–2022 (USD Million)
Table 67 Asia-Pacific: Market, By Type, 2015–2022 (USD Million)
Table 68 Asia-Pacific: Market, By Application, 2015–2022 (USD Million)
Table 69 Asia-Pacific: Market for Cloning Applications, By Type, 2015–2022 (USD Million)
Table 70 Asia-Pacific: Market for Other Applications, By Type, 2015–2022 (USD Million)
Table 71 Asia-Pacific: Market, By End User, 2015–2022 (USD Million)
Table 72 Japan: Competent Cells Market, By Type, 2015–2022 (USD Million)
Table 73 Japan: Market, By Application, 2015–2022 (USD Million)
Table 74 Japan: Market for Cloning Applications, By Type, 2015–2022 (USD Million)
Table 75 Japan: Market for Other Applications, By Type, 2015–2022 (USD Million)
Table 76 Japan: Market, By End User, 2015–2022 (USD Million)
Table 77 Australia: Competent Cells Market, By Type, 2015–2022 (USD Million)
Table 78 Australia: Market, By Application, 2015–2022 (USD Million)
Table 79 Australia: Market for Cloning Applications, By Type, 2015–2022 (USD Million)
Table 80 Australia: Market for Other Applications, By Type, 2015–2022 (USD Million)
Table 81 Australia: Market, By End User, 2015–2022 (USD Million)
Table 82 China: Competent Cells Market, By Type, 2015–2022 (USD Million)
Table 83 China: Market, By Application, 2015–2022 (USD Million)
Table 84 China: Market for Cloning Applications, By Type, 2015–2022 (USD Million)
Table 85 China: Market for Other Applications, By Type, 2015–2022 (USD Million)
Table 86 China: Market, By End User, 2015–2022 (USD Million)
Table 87 India: Competent Cells Market, By Type, 2015–2022 (USD Million)
Table 88 India: Market, By Application, 2015–2022 (USD Million)
Table 89 India: Market for Cloning Applications, By Type, 2015–2022 (USD Million)
Table 90 India: Market for Other Applications, By Type, 2015–2022 (USD Million)
Table 91 India: Market, By End User, 2015–2022 (USD Million)
Table 92 Rest of APAC: Competent Cells Market, By Type, 2015–2022 (USD Million)
Table 93 Rest of APAC: Market, By Application, 2015–2022 (USD Million)
Table 94 Rest of APAC: Market for Cloning Applications, By Type, 2015–2022 (USD Million)
Table 95 Rest of APAC: Market for Other Applications, By Type, 2015–2022 (USD Million)
Table 96 Rest of APAC: Market, By End User, 2015–2022 (USD Million)
Table 97 RoW: Competent Cells Market, By Type, 2015–2022 (USD Million)
Table 98 RoW: Market, By Application, 2015–2022 (USD Million)
Table 99 RoW: Market for Cloning Applications, By Type, 2015–2022 (USD Million)
Table 100 RoW: Market for Other Applications, By Type, 2015–2022 (USD Million)
Table 101 RoW: Market, By End User, 2015–2022 (USD Million)
List of Figures (39 Figures)
Figure 1 Global Competent Cells Market
Figure 2 Research Design
Figure 3 Market Size Estimation Methodology: Bottom-Up Approach
Figure 4 Market Size Estimation Methodology: Top-Down Approach
Figure 5 Breakdown of Primary Interviews: By Company Type, Designation, and Region
Figure 6 Data Triangulation Methodology
Figure 7 Competent Cells Market, By Type, 2017 vs 2022 (USD Million)
Figure 8 Competent Cells Market, By Application, 2017 vs 2022 (USD Million)
Figure 9 Competent Cells Market for Cloning, 2017 vs 2022 (USD Million)
Figure 10 Competent Cells Market for Other Applications, 2017 vs 2022 (USD Million)
Figure 11 Competent Cells Market, By End User, 2017 vs 2022 (USD Million)
Figure 12 Geographic Snapshot of the Global Competent Cells Market (2017–2022)
Figure 13 Emerging Countries to Offer Lucrative Growth Opportunities in the Market
Figure 14 Subcloning & Routine Cloning Applications Segment to Account for the Largest Share in 2017
Figure 15 North America to Register the Highest Growth Rate During the Forecast Period
Figure 16 Cloning Segment Will Continue to Dominate the Competent Cells Market During the Forecast Period
Figure 17 Competent Cells Market: Drivers, Restraints, Opportunities, & Challenges
Figure 18 Chemically Competent Cells to Hold Largest Market Share in 2017
Figure 19 Competent Cells Market Segmentation, By Application
Figure 20 Cloning—The Largest Application Segment in the Competent Cells Market
Figure 21 Subcloning & Routine Cloning Segment to Dominate the Market in 2017
Figure 22 Competent Cells Market Size, By End User, 2017 (USD Million)
Figure 23 North America to Dominate the Competent Cells Market in 2022
Figure 24 Competent Cells Market in North America to Grow at the Highest Rate (2017 to 2022)
Figure 25 North America: Competent Cells Market Snapshot
Figure 26 U.S. to Hold Largest Share of the North American Market in 2017
Figure 27 Europe: Competent Cells Market Snapshot
Figure 28 Asia-Pacific Competent Cells Market Snapshot, 2017
Figure 29 Japan to Lead the Asia-Pacific Competent Cells Market in 2017
Figure 30 Global Competent Cells Market Share Analysis, By Key Player, 2016
Figure 31 Competent Cells Market (Global) Competitive Leadership Mapping, 2017
Figure 32 Thermo Fisher Scientific Inc.: Company Snapshot (2016)
Figure 33 Merck KGaA: Company Snapshot (2016)
Figure 34 Takara Bio Inc.: Company Snapshot (2016)
Figure 35 Bio-Rad Laboratories, Inc: Company Snapshot (2016)
Figure 36 Agilent Technologies Inc.: Company Snapshot (2016)
Figure 37 Illumina, Inc.: Company Snapshot (2016)
Figure 38 Qiagen N.V.: Company Snapshot (2016)
Figure 39 Genscript Biotech Corporation: Company Snapshot (2016)

 Generating Response ...


Growth opportunities and latent adjacency in Competent Cells Market