Continuous Manufacturing Market By Product (Integrated system, Semi-continuous (Granulator, Coater, Blender), Control), Application (API, End Product (Solid Dosage)), End User (R&D Department (CRO), Pharmaceutical Companies, CMO).


[181 Pages Report] The global continuous manufacturing market is expected to reach USD 650.4 Million by 2022 from USD 348.5 Million in 2017, at a CAGR of 13.3%. The major drivers for the market include advantages of continuous manufacturing in pharmaceutical processes such as cost-effectiveness and improved efficiency of manufacturing, favorable regulatory environment, and support from regulatory authorities for the implementation of continuous manufacturing.
The report provides an overall understanding of the Continuous Manufacturing Market. In this report, the market is segmented on the basis of product, application, end user, and geography. The product segment includes integrated systems, semi-continuous systems, and controls. Among these product segments, the integrated systems segment is expected to account for the largest share of the Continuous Manufacturing market in 2017. The application segment includes Active Pharmaceutical Ingredient (API) manufacturing and end product manufacturing. The end user segment includes R&D departments and full-scale manufacturing companies. The geographic segments included in this report are North America, Europe, Asia-Pacific, and the Rest of the World (RoW).
A combination of bottom-up and top-down approaches was used to calculate the Continuous Manufacturing market sizes and growth rates of the market and its subsegments. All percentage shares, splits, and breakdowns were determined using secondary sources and verified through primary sources. All possible parameters that affect the markets covered in this research study have been accounted for, viewed in extensive detail, verified through primary research, and analyzed to get the final quantitative and qualitative data. Primary interviews with key opinion leaders were also used to determine the percentage shares of each subsegment and the relative differences in growth rates.
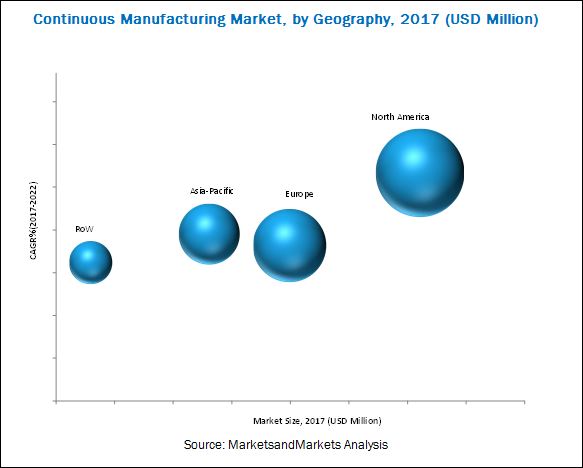
Geographic analysis of the global continuous manufacturing industry reveals that the North American segment is expected to account for the largest share, owing to the need to reduce rising operational costs and eliminate the issues related to the inconsistent quality of pharmaceutical products produced through batch manufacturing and support from the FDA.
Major players in the Continuous Manufacturing market are GEA Group AG (Germany), Thermo Fisher Scientific Inc. (U.S.), Bosch Packaging Technology (Germany), Coperion GmbH (Germany), and Glatt GmbH (Germany).
Target Audience for this Report:
- Vendors/service providers
- Research institutes
- Pharmaceutical manufacturers
- Contract research organizations (CROs)
- Contract manufacturing organizations (CMOs)
To know about the assumptions considered for the study, download the pdf brochure
Get online access to the report on the World's First Market Intelligence Cloud
Request Sample Scope of the Report

This research report categorizes the global continuous manufacturing market into the following segments and subsegments:
Continuous Manufacturing Market, by Product
- Integrated Systems
- Semi-continuous Systems
- Continuous Granulators
- Continuous Coaters
- Continuous Blenders
- Continuous Dryers
- Continuous Compressors
- Other Semi-continuous Systems (Milling Equipment and Weighing/Measurement Equipment)
- Controls/Software
Continuous Manufacturing Market, by Application
- End Product Manufacturing
- Solid Dosage
- Liquid Dosage
- API Manufacturing
Continuous Manufacturing Market, by End User
- R&D Departments
- Research Institutes
- Contract Research Organizations (CROs)
- Full-scale Manufacturing Companies
- Contract Manufacturing Organizations (CMOs)
- Pharmaceutical Companies
Continuous Manufacturing Market, by Geography
-
North America
- U.S.
- Canada
-
Europe
- Germany
- U.K.
- Rest of Europe
-
Asia-Pacific
- China
- Japan
- Singapore
- Rest of Asia-Pacific
- RoW
Available Customizations
With the given market data, MarketsandMarkets offers customizations as per the company’s specific needs. The following customization options are available for the report:
Geographical Analysis
- Further breakdown of the rest of Europe segment in France, Finland, Sweden, and Switzerland
Company Information
- Detailed analysis and profiling of additional market players (Up to 5)
The global continuous manufacturing market is expected to reach USD 650.4 Million by 2022 from USD 348.5 Million in 2017, at a CAGR of 13.3%. The major drivers for the market include the advantages of continuous manufacturing in pharmaceutical processes such as cost-effectiveness and improved efficiency of manufacturing and support from regulatory authorities for the implementation of continuous manufacturing.
The Continuous Manufacturing market is segmented on the basis of product, application, end user, and geography. The product segment includes integrated systems, semi-continuous systems, and controls. The integrated systems segment is expected to account for the largest share of the Continuous Manufacturing market in 2017. The integrated systems enable end-to-end manufacturing to convert raw materials into final products. In addition, these systems save substantial cost and time by integrating various pharmaceutical processes in a single system.
The application segment of the Continuous Manufacturing market includes active pharmaceutical ingredient (API) manufacturing and end product manufacturing. The end product manufacturing segment is further categorized as solid dosage manufacturing and liquid dosage manufacturing. The end product manufacturing segment is estimated to account for the largest share of the Continuous Manufacturing market in 2017 owing to the easily available technology for end product manufacturing as compared to API manufacturing by continuous processes.
The end user segment of the continuous manufacturing market includes R&D departments and full-scale manufacturing companies. The full-scale manufacturing companies segment includes pharmaceutical companies and contract manufacturing organizations (CMOs). The full-scale manufacturing companies segment is expected to hold the largest share of the market in 2017. The large share of this segment can primarily be attributed to the increasing adoption of continuous technologies by pharmaceutical manufacturing companies and CMOs to address the challenges related to product quality, drug supply, and operational costs.
The geographic segments in this report include North America, Europe, Asia-Pacific, and RoW. Of these, the North American segment is expected to account for the largest share of the market in 2017. This large share can primarily be attributed to the support from regulatory bodies, initiation by leading pharmaceutical companies, and the need for pharmaceutical manufacturers to reduce rising operational costs and eliminate issues related to the inconsistent quality of pharmaceutical products produced through batch manufacturing.
Major players in this market include GEA Group AG (Germany), Thermo Fisher Scientific Inc. (U.S.), Bosch Packaging Technology (Germany), Coperion GmbH (Germany), and Glatt GmbH (Germany). Other players include KORSCH AG (Germany), Munson Machinery Company, Inc. (U.S.), L.B. Bohle Maschinen + Verfahren Gmbh (Germany), Gebrüder Lödige Maschinenbau GmbH (Germany), Baker Perkins Ltd. (U.K.), Scott Equipment Company (U.S.), and Sturtevant, Inc. (U.S.).
To speak to our analyst for a discussion on the above findings, click Speak to Analyst
Table of Contents
1 Introduction (Page No. - 19)
1.1 Objectives of the Study
1.2 Market Definition
1.3 Market Scope
1.3.1 Markets Covered
1.3.2 Years Considered for the Study
1.4 Currency
1.5 Limitations
1.6 Stakeholders
2 Research Methodology (Page No. - 22)
2.1 Research Approach
2.1.1 Key Data From Secondary Sources
2.1.2 Key Data From Primary Sources
2.2 Market Breakdown and Data Triangulation
2.3 Assumption
3 Executive Summary (Page No. - 27)
4 Premium Insights (Page No. - 31)
4.1 Continuous Manufacturing: Market Overview (2017 vs 2022)
4.2 Geographic Analysis: Continuous Manufacturing Market, By Product (2016)
4.3 Continuous Manufacturing Market, By Application, 2017 vs 2022
4.4 Continuous Manufacturing Market, By End User, 2017 vs 2022
4.5 Geographic Snapshot of the Continuous Manufacturing Market
5 Continuous Manufacturing Market Overview (Page No. - 35)
5.1 Introduction
5.2 Market Dynamics
5.2.1 Drivers
5.2.1.1 Cost-Effective Approach for Pharmaceutical Manufacturing
5.2.1.2 Better Efficiency of Manufacturing Operations Offered By Continuous Processes
5.2.1.3 Support From Regulatory Authorities for the Implementation of Continuous Manufacturing
5.2.2 Restraint
5.2.2.1 Lack of Technical and Regulatory Clarity
5.2.3 Opportunities
5.2.3.1 Industry-Academia Collaborations
5.2.3.2 Expected Growth in Generic Manufacturing
5.2.4 Challenges
5.2.4.1 Significant Infrastructural Investments and Global Regulatory Uncertainty
5.2.4.2 Concerns Related to Cleaning Validation in Continuous Manufacturing
6 Continuous Manufacturing Market, By Product (Page No. - 41)
6.1 Introduction
6.2 Integrated Systems
6.3 Semi-Continuous Systems
6.3.1 Continuous Granulators
6.3.2 Continuous Blenders
6.3.3 Continuous Compressors
6.3.4 Continuous Coaters
6.3.5 Continuous Dryers
6.3.6 Other Semi-Continuous Systems
6.4 Controls
7 Continuous Manufacturing Market, By Application (Page No. - 63)
7.1 Introduction
7.2 End Product Manufacturing
7.2.1 Solid Dosage Manufacturing
7.2.2 Liquid Dosage Manufacturing
7.3 Api Manufacturing
8 Continuous Manufacturing Market, By End User (Page No. - 74)
8.1 Introduction
8.2 Full-Scale Manufacturing Companies
8.2.1 Pharmaceutical Companies
8.2.2 Contract Manufacturing Organizations
8.3 R&D Departments
8.3.1 Contract Research Organizations
8.3.2 Research Institutes
9 Continuous Manufacturing Market, By Region (Page No. - 91)
9.1 Introduction
9.2 North America
9.2.1 U.S.
9.2.2 Canada
9.3 Europe
9.3.1 Germany
9.3.2 U.K.
9.3.3 Rest of Europe
9.4 Asia-Pacific
9.4.1 Singapore
9.4.2 China
9.4.3 Japan
9.4.4 Rest of Asia-Pacific
9.5 Rest of the World (RoW)
10 Competitive Landscape (Page No. - 136)
10.1 Introduction
10.1.1 Vanguards
10.1.2 Innovators
10.1.3 Dynamic
10.1.4 Emerging
10.2 Competitive Benchmarking
10.2.1 Product Offerings
10.2.2 Business Strategy
*Top 13 Companies Analyzed for This Studies are - GEA Group AG (Germany), Thermo Fisher Scientific Inc. (U.S.), Hosokawa Micron Corporation (Japan), Coperion GmbH (Germany), Glatt GmbH (Germany), Korsch AG (Germany), Munson Machinery Company, Inc. (U.S.), L.B. Bohle Maschinen + Verfahren GmbH (Germany), Bosch Packaging Technology (Germany), Gebrüder Lödige Maschinenbau GmbH (Germany), Baker Perkins Ltd. (U.K.), Scott Equipment Company (U.S.), and Sturtevant, Inc. (U.S.)
11 Company Profiles (Page No. - 140)
(Introduction, Products & Services, Strategy, & Analyst Insights, Developments, MnM View)*
11.1 Thermo Fisher Scientific Inc.
11.2 GEA Group AG
11.3 Hosokawa Micron Corporation
11.4 Coperion GmbH
11.5 Glatt GmbH
11.6 Korsch AG
11.7 Munson Machinery Company, Inc.
11.8 L.B. Bohle Maschinen + Verfahren GmbH
11.9 Bosch Packaging Technology
11.10 Gebrüder Lödige Maschinenbau GmbH
11.11 Baker Perkins Ltd.
11.12 Scott Equipment Company
11.13 Sturtevant, Inc.
*Details on Marketsandmarkets View, Introduction, Product & Services, Strategy, & Analyst Insights, New Developments Might Not Be Captured in Case of Unlisted Companies.
12 Appendix (Page No. - 173)
12.1 Insights of Industry Experts
12.2 Discussion Guide
12.3 Knowledge Store: Marketsandmarkets’ Subscription Portal
12.4 Introducing RT: Real-Time Market Intelligence
12.5 Available Customizations
12.6 Related Reports
12.7 Author Details
List of Tables (162 Tables)
Table 1 Continuous Manufacturing Market Size, By Product, 2015–2022 (USD Million)
Table 2 Continuous Manufacturing Market Size for Integrated Systems, By Region, 2015–2022 (USD Million)
Table 3 North America: Continuous Manufacturing Market Size for Integrated Systems, By Country, 2015–2022 (USD Million)
Table 4 Europe: Continuous Manufacturing Market Size for Integrated Systems, By Country, 2015–2022 (USD Million)
Table 5 Asia-Pacific: Continuous Manufacturing Market Size for Integrated Systems, By Country, 2015–2022 (USD Million)
Table 6 Continuous Manufacturing Market Size for Semi-Continuous Systems, By Type, 2015–2022 (USD Million)
Table 7 Continuous Manufacturing Market Size for Semi-Continuous Systems, By Region, 2015–2022 (USD Million)
Table 8 North America: Market Size for Semi-Continuous Systems, By Country, 2015–2022 (USD Million)
Table 9 Europe: Continuous Manufacturing Market Size for Semi-Continuous Systems, By Country, 2015–2022 (USD Million)
Table 10 Asia-Pacific: Continuous Manufacturing Market Size for Semi-Continuous Systems, By Country, 2015–2022 (USD Million)
Table 11 Continuous Granulators Market Size, By Region, 2015–2022 (USD Million)
Table 12 North America: Continuous Granulators Market Size, By Country, 2015–2022 (USD Million)
Table 13 Europe: Continuous Granulators Market Size, By Country, 2015–2022 (USD Million)
Table 14 Asia-Pacific: Continuous Granulators Market Size, By Country, 2015–2022 (USD Million)
Table 15 Continuous Blenders Market Size, By Region, 2015–2022 (USD Million)
Table 16 North America: Continuous Blenders Market Size, By Country, 2015–2022 (USD Million)
Table 17 Europe: Continuous Blenders Market Size, By Country, 2015–2022 (USD Million)
Table 18 Asia-Pacific: Continuous Blenders Market Size, By Country, 2015–2022 (USD Million)
Table 19 Continuous Compressors Market Size, By Region, 2015–2022 (USD Million)
Table 20 North America: Continuous Compressors Market Size, By Country, 2015–2022 (USD Million)
Table 21 Europe: Continuous Compressors Market Size, By Country, 2015–2022 (USD Million)
Table 22 Asia-Pacific: Continuous Compressors Market Size, By Country, 2015–2022 (USD Million)
Table 23 Continuous Coaters Market Size, By Region, 2015–2022 (USD Million)
Table 24 North America: Continuous Coaters Market Size, By Country, 2015–2022 (USD Million)
Table 25 Europe: Continuous Coaters Market Size, By Country, 2015–2022 (USD Million)
Table 26 Asia-Pacific: Continuous Coaters Market Size, By Country, 2015–2022 (USD Million)
Table 27 Continuous Dryers Market Size, By Region, 2015–2022 (USD Million)
Table 28 North America: Continuous Dryers Market Size, By Country, 2015–2022 (USD Million)
Table 29 Europe: Continuous Dryers Market Size, By Country, 2015–2022 (USD Million)
Table 30 Asia-Pacific: Continuous Dryers Market Size, By Country, 2015–2022 (USD Million)
Table 31 Other Semi-Continuous Systems Market Size, By Region, 2015–2022 (USD Million)
Table 32 North America: Other Semi-Continuous Systems Market Size, By Country, 2015–2022 (USD Million)
Table 33 Europe: Other Semi-Continuous Systems Market Size, By Country, 2015–2022 (USD Million)
Table 34 Asia-Pacific: Other Semi-Continuous Systems Market Size, By Country, 2015–2022 (USD Million)
Table 35 Market Size for Controls, By Region, 2015–2022 (USD Million)
Table 36 Market Size, By Application, 2015–2022 (USD Million)
Table 37 Continuous End Product Manufacturing Market Size, By Region, 2015–2022 (USD Million)
Table 38 North America: Continuous End Product Manufacturing Market Size, By Country, 2015–2022 (USD Million)
Table 39 Europe: Continuous End Product Manufacturing Market Size, By Country, 2015–2022 (USD Million)
Table 40 Asia-Pacific: Continuous End Product Manufacturing Market Size, By Country, 2015–2022 (USD Million)
Table 41 Continuous End Product Manufacturing Market Size, By Product Type, 2015–2022 (USD Million)
Table 42 Continuous Solid Dosage Manufacturing Market Size, By Region, 2015–2022 (USD Million)
Table 43 North America: Continuous Solid Dosage Manufacturing Market Size, By Country, 2015–2022 (USD Million)
Table 44 Europe: Continuous Solid Dosage Manufacturing Market Size, By Country, 2015–2022 (USD Million)
Table 45 Asia-Pacific: Continuous Solid Dosage Manufacturing Market Size, By Country, 2015–2022 (USD Million)
Table 46 Continuous Liquid Dosage Manufacturing Market Size, By Region, 2015–2022 (USD Million)
Table 47 North America: Continuous Liquid Dosage Manufacturing Market Size, By Country, 2015–2022 (USD Million)
Table 48 Europe: Continuous Liquid Dosage Manufacturing Market Size, By Country, 2015–2022 (USD Million)
Table 49 Asia-Pacific: Continuous Liquid Dosage Manufacturing Market Size, By Country, 2015–2022 (USD Million)
Table 50 Continuous Api Manufacturing Market Size, By Region, 2015–2022 (USD Million)
Table 51 North America: Continuous Api Manufacturing Market Size, By Country, 2015–2022 (USD Million)
Table 52 Europe: Continuous Api Manufacturing Market Size, By Country, 2015–2022 (USD Million)
Table 53 Asia-Pacific: Continuous Api Manufacturing Market Size, By Country, 2015–2022 (USD Million)
Table 54 Market Size, By End User, 2015–2022 (USD Million)
Table 55 Market Size for Full-Scale Manufacturing Companies, By Type, 2015–2022 (USD Million)
Table 56 Market Size for Full-Scale Manufacturing Companies, By Region, 2015–2022 (USD Million)
Table 57 North America: Market Size for Full-Scale Manufacturing Companies, By Country, 2015–2022 (USD Million)
Table 58 Europe: Continuous Manufacturing Market Size for Full-Scale Manufacturing Companies, By Country, 2015–2022 (USD Million)
Table 59 Asia-Pacific: Continuous Manufacturing Market Size for Full-Scale Manufacturing Companies, By Country, 2015–2022 (USD Million)
Table 60 Continuous Manufacturing Market Size for Pharmaceutical Companies, By Region, 2015–2022 (USD Million)
Table 61 North America: Continuous Manufacturing Market Size for Pharmaceutical Companies, By Country, 2015–2022 (USD Million)
Table 62 Europe: Continuous Manufacturing Market Size for Pharmaceutical Companies, By Country, 2015–2022 (USD Million)
Table 63 Asia-Pacific: Market Size for Pharmaceutical Companies, By Country, 2015–2022 (USD Million)
Table 64 Market Size for Contract Manufacturing Organizations, By Region, 2015–2022 (USD Million)
Table 65 Asia-Pacific: Market Size for Contract Manufacturing Organizations, By Country, 2015–2022 (USD Million)
Table 66 North America: Market Size for Contract Manufacturing Organizations, By Country, 2015–2022 (USD Million)
Table 67 Europe: Market Size for Contract Manufacturing Organizations, By Country, 2015–2022 (USD Million)
Table 68 Market Size for R&D Departments, By Type, 2015–2022 (USD Million)
Table 69 Market Size for R&D Departments, By Region, 2015–2022 (USD Million)
Table 70 North America: Market Size for R&D Departments, By Country, 2015–2022 (USD Million)
Table 71 Europe: Market Size for R&D Departments, By Country, 2015–2022 (USD Million)
Table 72 APAC: Market Size for R&D Departments, By Country, 2015–2022 (USD Million)
Table 73 Market Size for Contract Research Organizations, By Region, 2015–2022 (USD Million)
Table 74 North America: Market Size for Contract Research Organizations, By Country, 2015–2022 (USD Million)
Table 75 Europe: Market Size for Contract Research Organizations, By Country, 2015–2022 (USD Million)
Table 76 Asia-Pacific: Market Size for Contract Research Organizations, By Country, 2015–2022 (USD Million)
Table 77 Market Size for Research Institutes, By Region, 2015–2022 (USD Million)
Table 78 North America: Market Size for Research Institutes, By Country, 2015–2022 (USD Million)
Table 79 Europe: Market Size for Research Institutes, By Country, 2015–2022 (USD Million)
Table 80 Asia-Pacific: Market Size for Research Institutes, By Country, 2015–2022 (USD Million)
Table 81 Global Market Size, By Region, 2015–2022 (USD Million)
Table 82 North America: Market Size, By Country, 2015–2022 (USD Million)
Table 83 North America: Market Size, By Product, 2015–2022 (USD Million)
Table 84 North America: Market Size, By Application, 2015–2022 (USD Million)
Table 85 North America: End Product Manufacturing Market Size, By Product Type, 2015–2022 (USD Million)
Table 86 North America: Market Size, By End User, 2015–2022 (USD Million)
Table 87 North America: Market Size for Full-Scale Manufacturing Companies, By Type, 2015–2022 (USD Million)
Table 88 North America: Market Size for R&D Departments, By Type, 2015–2022 (USD Million)
Table 89 U.S.: Market Size, By Product, 2015–2022 (USD Million)
Table 90 U.S.: Market Size, By Application, 2015–2022 (USD Million)
Table 91 U.S.: End Product Manufacturing Market Size, By Product Type, 2015–2022 (USD Million)
Table 92 U.S.: Market Size, By End User, 2015–2022 (USD Million)
Table 93 U.S.: Market Size for Full-Scale Manufacturing Companies, By Type, 2015–2022 (USD Million)
Table 94 U.S.: Market Size for R&D Departments, By Type, 2015–2022 (USD Million)
Table 95 Canada: Market Size, By Product, 2015–2022 (USD Million)
Table 96 Canada: Market Size, By Application, 2015–2022 (USD Million)
Table 97 Canada: End Product Manufacturing Market Size, By Product Type, 2015–2022 (USD Million)
Table 98 Canada: Market Size, By End User, 2015–2022 (USD Million)
Table 99 Canada: Market Size for Full-Scale Manufacturing Companies, By Type, 2015–2022 (USD Million)
Table 100 Canada: Market Size for R&D Departments, By Type, 2015–2022 (USD Million)
Table 101 Europe: Market Size, By Country, 2015–2022 (USD Million)
Table 102 Europe: Market Size, By Product, 2015–2022 (USD Million)
Table 103 Europe: Market Size, By Application, 2015–2022 (USD Million)
Table 104 Europe: End Product Manufacturing Market Size, By Product Type, 2015–2022 (USD Million)
Table 105 Europe: Continuous Manufacturing Market Size, By End User, 2015–2022 (USD Million)
Table 106 Europe: Continuous Manufacturing Market Size for Full-Scale Manufacturing Companies, By Type, 2015–2022 (USD Million)
Table 107 Europe: Continuous Manufacturing Market Size for R&D Departments, By Type, 2015–2022 (USD Million)
Table 108 Germany: Market Size, By Product, 2015–2022 (USD Million)
Table 109 Germany: Market Size, By Application, 2015–2022 (USD Million)
Table 110 Germany: End Product Manufacturing Market Size, By Product Type, 2015–2022 (USD Million)
Table 111 Germany: Market Size, By End User, 2015–2022 (USD Million)
Table 112 Germany: Market Size for Full-Scale Manufacturing Companies, By Type, 2015–2022 (USD Million)
Table 113 Germany: Market Size for R&D Departments, By Type, 2015–2022 (USD Million)
Table 114 U.K.: Continuous Manufacturing Market Size, By Product, 2015–2022 (USD Million)
Table 115 U.K.: Continuous Manufacturing Market Size, By Application, 2015–2022 (USD Million)
Table 116 U.K.: End Product Manufacturing Market Size, By Product Type, 2015–2022 (USD Million)
Table 117 U.K.: Continuous Manufacturing Market Size, By End User, 2015–2022 (USD Million)
Table 118 U.K.: Continuous Manufacturing Market Size for Full-Scale Manufacturing Companies, By Type, 2015–2022 (USD Million)
Table 119 U.K.: Continuous Manufacturing Market Size for R&D Departments, By Type, 2015–2022 (USD Million)
Table 120 Rest of Europe: Continuous Manufacturing Market Size, By Product, 2015–2022 (USD Million)
Table 121 Rest of Europe: Continuous Manufacturing Market Size, By Application, 2015–2022 (USD Million)
Table 122 Rest of Europe: End Product Manufacturing Market Size, By Product Type, 2015–2022 (USD Million)
Table 123 Rest of Europe: Continuous Manufacturing Market Size, By End User, 2015–2022 (USD Million)
Table 124 Rest of Europe: Continuous Manufacturing Market Size for Full-Scale Manufacturing Companies, By Type, 2015–2022 (USD Million)
Table 125 Rest of Europe: Continuous Manufacturing Market Size for R&D Departments, By Type, 2015–2022 (USD Million)
Table 126 APAC: Continuous Manufacturing Market Size, By Country, 2015–2022 (USD Million)
Table 127 APAC: Continuous Manufacturing Market Size, By Product, 2015–2022 (USD Million)
Table 128 APAC: Continuous Manufacturing Market Size, By Application, 2015–2022 (USD Million)
Table 129 APAC: End Product Manufacturing Market Size, By Product Type, 2015–2022 (USD Million)
Table 130 APAC: Continuous Manufacturing Market Size, By End User, 2015–2022 (USD Million)
Table 131 APAC: Continuous Manufacturing Market Size for Full-Scale Manufacturing Companies, By Type, 2015–2022 (USD Million)
Table 132 APAC: Continuous Manufacturing Market Size for R&D Departments, By Type, 2015–2022 (USD Million)
Table 133 Singapore: Market Size, By Product, 2015–2022 (USD Million)
Table 134 Singapore: Market Size, By Application, 2015–2022 (USD Million)
Table 135 Singapore: End Product Manufacturing Market Size, By Product Type, 2015–2022 (USD Million)
Table 136 Singapore: Market Size, By End User, 2015–2022 (USD Million)
Table 137 Singapore: Market Size for Full-Scale Manufacturing Companies, By Type, 2015–2022 (USD Million)
Table 138 Singapore: Market Size for R&D Departments, By Type, 2015–2022 (USD Million)
Table 139 China: Continuous Manufacturing Market Size, By Product, 2015–2022 (USD Million)
Table 140 China: Continuous Manufacturing Market Size, By Application, 2015–2022 (USD Million)
Table 141 China: Continuous Manufacturing End Product Manufacturing Market Size, By Product Type, 2015–2022 (USD Million)
Table 142 China: Continuous Manufacturing Market Size, By End User, 2015–2022 (USD Million)
Table 143 China: Continuous Manufacturing Market Size for Full-Scale Manufacturing Companies, By Type, 2015–2022 (USD Million)
Table 144 China: Continuous Manufacturing Market Size for R&D Departments, By Type, 2015–2022 (USD Million)
Table 145 Japan: Continuous Manufacturing Market Size, By Product, 2015–2022 (USD Million)
Table 146 Japan: Continuous Manufacturing Market Size, By Application, 2015–2022 (USD Million)
Table 147 Japan: End Product Manufacturing Market Size, By Product Type, 2015–2022 (USD Million)
Table 148 Japan: Continuous Manufacturing Market Size, By End User, 2015–2022 (USD Million)
Table 149 Japan: Continuous Manufacturing Market Size for Full-Scale Manufacturing Companies, By Type, 2015–2022 (USD Million)
Table 150 Japan: Continuous Manufacturing Market Size for R&D Departments, By Type, 2015–2022 (USD Million)
Table 151 RoAPAC: Continuous Manufacturing Market Size, By Product, 2015–2022 (USD Million)
Table 152 RoAPAC: Continuous Manufacturing Market Size, By Application, 2015–2022 (USD Million)
Table 153 RoAPAC: End Product Manufacturing Market Size, By Product Type, 2015–2022 (USD Million)
Table 154 RoAPAC: Continuous Manufacturing Market Size, By End User, 2015–2022 (USD Million)
Table 155 RoAPAC: Continuous Manufacturing Market Size for Full-Scale Manufacturing Companies, By Type, 2015–2022 (USD Million)
Table 156 RoAPAC: Continuous Manufacturing Market Size for R&D Departments, By Type, 2015–2022 (USD Million)
Table 157 RoW: Continuous Manufacturing Market Size, By Product, 2015–2022 (USD Million)
Table 158 RoW: Continuous Manufacturing Market Size, By Application, 2015–2022 (USD Million)
Table 159 RoW: End Product Manufacturing Market Size, By Product Type, 2015–2022 (USD Million)
Table 160 RoW: Continuous Manufacturing Market Size, By End User, 2015–2022 (USD Million)
Table 161 RoW: Continuous Manufacturing Market Size for Full-Scale Manufacturing Companies, By Type, 2015–2022 (USD Million)
Table 162 RoW: Market Size for R&D Departments, By Type, 2015–2022 (USD Million)
List of Figures (52 Figures)
Figure 1 Research Design
Figure 2 Continuous Manufacturing Market Size Estimation Methodology: Bottom-Up Approach
Figure 3 Continuous Manufacturing Market Size Estimation Methodology: Top-Down Approach
Figure 4 Breakdown of Primary Interviews: By Company Type, Designation, and Region
Figure 5 Data Triangulation Methodology
Figure 6 Continuous Manufacturing Market Size, By Product, 2017 vs 2022 (USD Million)
Figure 7 Continuous Manufacturing Market Size, By Application, 2017 vs 2022 (USD Million)
Figure 8 Continuous Manufacturing Market Size, By End User, 2017 vs 2022 (USD Million)
Figure 9 Geographical Snapshot of the Continuous Manufacturing Market
Figure 10 Efficiency in Pharmaceutical Manufacturing, an Important Growth Driver
Figure 11 Integrated Systems Segment Accounted for the Largest Share of the Continuous Manufacturing Market in 2016
Figure 12 End Product Manufacturing Segment Will Continue to Dominate the Continuous Manufacturing Market in 2017 and 2022
Figure 13 Full Scale Pharmaceutical Manufacturing to Grow at the Highest Rate During the Forecast Period
Figure 14 North America to Register the Highest CAGR in the Forecast Period (2017–2022)
Figure 15 Continuous Manufacturing Market: Drivers, Restraints, Opportunities, & Challenges
Figure 16 Continuous Manufacturing Market Size, By Product, 2017 vs 2022 (USD Million)
Figure 17 Continuous Manufacturing Market Size, By Application, 2017 vs 2022 (USD Million)
Figure 18 Full-Scale Pharmaceutical Manufacturing Companies Segment to Dominate the End-User Market in 2017
Figure 19 North America to Dominate the Global Continuous Manufacturing Market in 2017
Figure 20 North America: Market Snapshot
Figure 21 Europe: Market Snapshot
Figure 22 APAC: Market Snapshot
Figure 23 Vendor Dive Chart
Figure 24 Thermo Fisher Scientific Inc.: Company Snapshot (2016)
Figure 25 Thermo Fisher Scientific Inc.: Product Offering Scorecard
Figure 26 Thermo Fisher Scientific Inc.: Business Strategy Scorecard
Figure 27 GEA Group AG: Company Snapshot (2016)
Figure 28 GEA Group AG: Product Offering Scorecard
Figure 29 GEA Group AG: Business Strategy Scorecard
Figure 30 Hosokawa Micron Corporation: Company Snapshot (2016)
Figure 31 Hosokawa Micron Corporation: Product Offering Scorecard
Figure 32 Hosokawa Micron Corporation: Business Strategy Scorecard
Figure 33 Coperion GmbH: Product Offering Scorecard
Figure 34 Coperion GmbH: Business Strategy Scorecard
Figure 35 Glatt GmbH: Product Offering Scorecard
Figure 36 Glatt GmbH: Business Strategy Scorecard
Figure 37 Korsch AG: Product Offering Scorecard
Figure 38 Korsch AG: Business Strategy Scorecard
Figure 39 Munson Machinery Company, Inc.: Product Offering Scorecard
Figure 40 Munson Machinery Company, Inc.: Business Strategy Scorecard
Figure 41 L.B. Bohle Maschinen + Verfahren GmbH: Product Offering Scorecard
Figure 42 L.B. Bohle Maschinen + Verfahren GmbH: Business Strategy Scorecard
Figure 43 Bosch Packaging Technology: Product Offering Scorecard
Figure 44 Bosch Packaging Technology: Business Strategy Scorecard
Figure 45 Gebrüder Lödige Maschinenbau GmbH: Product Offering Scorecard
Figure 46 Gebrüder Lödige Maschinenbau GmbH: Business Strategy Scorecard
Figure 47 Baker Perkins Ltd.: Product Offering Scorecard
Figure 48 Baker Perkins Ltd.: Business Strategy Scorecard
Figure 49 Scott Equipment Company: Product Offering Scorecard
Figure 50 Scott Equipment Company: Business Strategy Scorecard
Figure 51 Sturtevant, Inc.: Product Offering Scorecard
Figure 52 Sturtevant, Inc.: Business Strategy Scorecard

 Generating Response ...


Growth opportunities and latent adjacency in Continuous Manufacturing Market