
Cosmetic Products Market by Type (Skin, Hair, Sun, Oral, Fragrance, Color, Soap, Bath, Shower, Personal Hygiene), Distribution Channel (Supermarket, Pharmacy, Departmental, Specialty, Direct, Internet, Salon) & Geography - Global Trends & Forecasts to 2019
Market Segmentation
| Report Metrics | Details |
|
Market size available for years |
null - null |
|
CAGR % |
null |
Top 10 companies in Cosmetic Products Market


[263 Pages Report] Cosmetic products are manufactured by using chemicals, minerals, and some natural ingredients. Technological advancement in the manufacturing of cosmetic products is one of the driving factors for the cosmetic products market. The economic development in the emerging countries has further increased the utilization of cosmetic products, as consumers have more disposable income.
Cosmetic products are segmented into skin care products, hair care products, color cosmetics, fragrances, etc. These products are used to enhance the beauty of the consumers by rejuvenating skin, giving shine to the hair, and so on. Distribution channels such as supermarkets, department stores, etc., offer a wide array of cosmetic products and provide a convenient medium for selection of the desired product.
The cosmetics products market is segmented on the basis of types, distribution channels, and geography in terms of value ($Billion). The market segments, by type, include skin care, hair care, color cosmetics, fragrance & deodorants, personal hygiene, oral hygiene, soap, bath & shower, sun care, and others.
The distribution channels of cosmetic product include supermarkets, pharmacy & drug stores, department stores, direct selling, specialty stores, internet retailing, beauty salons, and others. The geographic segmentation includes market value and volume for the key countries in North America, Europe, Asia-Pacific, and Rest of the World (ROW).
This report provides a full analysis of key companies and the competitive analysis of developments recorded in the industry in the past five years. Market drivers, restraints, opportunities, and burning issues of the market are discussed in detail. The leading players in the market such as L�Oreal Group (France), Alticor, Inc. (U.S.), and Avon Products, Inc. (U.S.) have been profiled in this report.
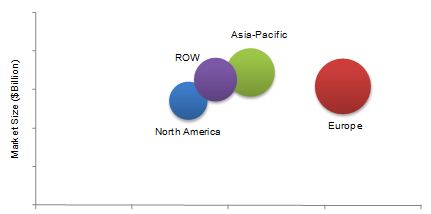
Cosmetic Products Market Size, by Geography, 2013-2019 ($Billion)
P - Projected
Source: MarketsandMarkets Analysis
See how this study impacted revenues for other players in Cosmetic Products Market
Client�s Problem Statement
Our client, an Italian cosmetics manufacturer, was keen to increase its market penetration in Iran�s professional hair care market. The client needed to take a host of crucial decisions � which product to focus on, which certification to prioritize, and what offering/value proposition to build for target customers in Iran. 
MnM Approach
MnM assisted the client by profiling it and ranking it on a global basis to ascertain how strong it is in its product segment. This was used by the company while applying to the Iran government for access to enter the market.
Revenue Impact (RI)
Our findings helped the client to penetrate the USD 1 billion market, with projected revenue of USD 20 million in 5 years. The client was able to establish and grow its professional hair care segment in the Iran cosmetics market.
In 2013, the cosmetic products market was dominated by Europe, with Germany as the leading country. The Asia-Pacific region is projected to grow at the fastest rate for the forecast period. The market in the Asia-Pacific region is growing owing to the economic growth, new technological advancements, and changes in fashion trends.
Get online access to the report on the World's First Market Intelligence Cloud
Request Sample Scope of the Report

This report focuses on the cosmetic products market for the cosmetics industry. The market was segmented on the basis of type, distribution channel, and geography.
- On the basis of type
- Skin care products
- Color cosmetics
- Hair care products
- Fragrance and deodorants
- Sun care products
- Soaps, bath, & shower products
- Oral hygiene products
- Personal hygiene products
- Others (baby care, depilatory products, etc.)
- On the basis of distribution channel
- Supermarkets
- Pharmacy & drug stores
- Department stores
- Direct selling
- Specialty stores
- Beauty salons
- Internet retailing
- Others (shopping club, retail shops, etc.)
- On the basis of geography
- North America
- Europe
- Asia-Pacific
- Rest of the World (ROW)
The cosmetic products market has witnessed a significant growth in the last few years. The market is driven by the economic development in emerging markets such as China, Brazil, among others. Cosmetic products have become essential in everyday life. These cosmetic products are labeled and manufactured keeping in mind the regulations specified by government bodies to guarantee product safety.
The leading market players including Avon Products, Inc. (U.S.), The Est�e Lauder Companies, Inc. (U.S.), L�Oreal Group (France), among others, prefer development strategies such as new product launches and mergers & acquisitions to increase their global presence and enhance their product portfolio. The leading players offer cosmetic products on the basis of changing fashion trends, upgrading innovations, and customer preferences. Leading cosmetic products manufacturers emphasize on the advancement, multi-functionality, safety, and other desired properties of the products.
The cosmetic products market is segmented on the basis of type, distribution channel, and geography. On the basis of type, it includes skin care products, hair care products, fragrances & deodorants, color cosmetics, personal hygiene products, oral hygiene products, bath & shower products, soaps, sun care products, and others. The market segmentation on the basis of distribution channel includes supermarkets, department stores, specialty stores, beauty salons, pharmacy & drug stores, Internet retailing, and others. The geographic segmentation of the market includes North America, Asia-Pacific, Europe, and Rest of the World (ROW).
Cosmetic Products Market Size, by Geography, 2013 ($Billion)
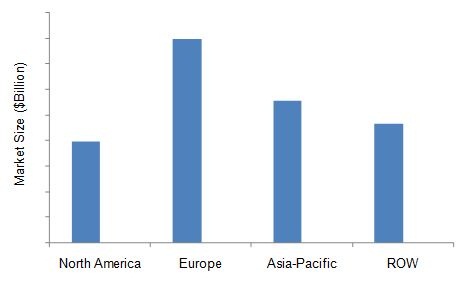
Source: MarketsandMarkets Analysis
The cosmetic products market is projected to grow at a CAGR of 6.3% with Europe as the largest market. It is expected to grow at a higher pace with increase in the disposable income of consumers in emerging markets. The Asia-Pacific region is projected to be the fastest growing market due to the increasing demand for color cosmetics, skin care, and hair care products here.
Table Of Contents
1 Introduction (Page No. - 19)
1.1 Key Take-Aways
1.2 Report Description
1.3 Markets Covered
1.4 Stakeholders
1.5 Research Methodology
1.5.1 Market Size Estimation
1.5.1.1 Market Crackdown & Data Triangulation
1.5.1.2 Bifurcation of The Years Considered For Food Diagnostics Market
1.5.1.3 Assumptions Made For Cosmetic Products Market
1.5.1.4 Key Data Points Taken From Secondary Sources
1.5.1.5 Key Data Points Taken From Primary Sources
2 Executive Summary (Page No. - 33)
3 Premium Insights (Page No. - 35)
4 Industry Analysis (Page No. - 42)
4.1 Introduction
4.1.1 History of Cosmetics
4.2 Supply Chain Analysis
4.3 Market Trends
4.3.1 Mineral-Enriched Skin Care Cosmetic Products Are in Demand
4.3.2 Fashion Trends Drive The Color Cosmetics Market Growth
4.3.3 Fragrance
4.3.4 Varieties of Hair Care Product Categories
4.3.5 Nail Care
4.3.6 Natural & Green-Labeled Cosmetics A Potential Segment in The Market
4.4 Market Share Analysis
5 Market Overview (Page No. - 47)
5.1 Introduction
5.2 History & Evolution
5.3 Related Markets
5.3.1 Specialty Chemicals Industry
6 Market Analysis (Page No. - 51)
6.1 Introduction
6.2 Winning Imperatives
6.2.1 R&D Initiatives & Innovations Enables Company to Maintain Global Competitiveness
6.2.2 Companies Use Direct Selling Approach to Increase Their Penetration in The Remote Regions
6.3 Burning Issue
6.3.1 Counterfeit Goods
6.4 Impact Analysis
6.4.1 Drivers
6.4.1.1 Increase of Aging Population
6.4.1.2 Change in The Consumer Standard of Living Due to Strengthening of Economy & Globalization
6.4.1.3 'on-The-Go' Lifestyle of Consumers
6.4.1.4 Cosmetic Packaging Solutions That Result in Easy Application
6.4.1.5 Smaller Pack Sizes in The Market Helps to Increase The Cosmetic Consumption Volume
6.4.2 Restraints
6.4.2.1 Advanced Medical Technology Assist in Consumer Beauty Treatment
6.4.2.2 Restricted Application of A Few Ingredients in Cosmetic Product
6.4.3 Opportunities
6.4.3.1 New Cosmetic Product Development
6.4.3.2 Potential Emerging Market For Cosmetic Producs
6.4.3.3 Collaboration of Leading Cosmetic Players With Cosmetic Healthcare Sector
6.5 Porter�s Five Forces Analysis
6.5.1 Degree of Competition
6.5.2 Bargaining Power of Suppliers
6.5.3 Bargaining Power of Buyers
6.5.4 Threat of Substitutes
6.5.5 Threat of New Entrants
7 Cosmetic Products Market, By Type (Page No. - 70)
7.1 Introduction
7.2 Skin Care Products
7.3 Hair Care Products
7.4 Fragrances & Deodorants
7.5 Personal Hygiene Products
7.6 Color Cosmetic Product:
7.7 Oral Hygiene Products
7.8 Soap, Bath & Shower Products
7.9 Sun Care Products
7.10 Other Cosmetic Product
8 Cosmetic Product Market, By Distribution Channel (Page No. - 83)
8.1 Introduction
8.2 Supermarkets
8.3 Pharmacy & Drug Stores
8.4 Department Stores
8.5 Direct Selling
8.6 Specialty Stores
8.7 Beauty Salons
8.8 Internet Retailing
8.9 Other Distribution Channels
8.10 North America
8.10.1 U.S.
8.10.2 Canada
8.10.3 Mexico
8.11 Europe
8.11.1 U.K.
8.11.2 Italy
8.11.3 Germany
8.11.4 Spain
8.11.5 France
8.11.6 Russia
8.11.7 Other European Countries
8.12 Asia-Pacific
8.12.1 China
8.12.2 Japan
8.12.3 India
8.12.4 Korea
8.12.5 Taiwan
8.12.6 Australia
8.12.7 Other Asia-Pacific Countries
8.13 ROW
8.13.1 Latin America (Except Brazil & Chile)
8.13.2 Brazil
8.13.3 Chile
8.13.4 The Middle East
8.13.5 Other ROW Countries
9 Cosmetic Products Market, By Geography (Page No. - 123)
9.1 Introduction
9.2 North America
9.2.1 U.S.
9.2.2 Canada
9.2.3 Mexico
9.3 Europe
9.3.1 U.K.
9.3.2 Italy
9.3.3 Germany
9.3.4 Spain
9.3.5 France
9.3.6 Russia
9.3.7 Other European Countries
9.4 Asia-Pacific
9.4.1 India
9.4.2 China
9.4.3 Korea
9.4.4 Taiwan
9.4.5 Japan
9.4.6 Australia
9.4.7 Other Asia-Pacific Countries
9.5 ROW
9.5.1 Latin America
9.5.2 Brazil
9.5.3 Chile
9.5.4 The Middle East
9.5.5 Other ROW Countries
10 Competitive Landscape (Page No. - 177)
10.1 Introduction
10.1.1 Cosmetic Product: Highly Competitive Market
10.2 New Product/Technology Launches-Most Preferred Strategic Approach
10.3 Key Market Strategies
10.4 Mergers & Acquisitions
10.5 Agreements, Partnerships & Collaborations
10.6 New Product/Technology Launches
10.7 Expansions and Investments
11 Company Profiles (Company At A Glance, Recent Financials, Products & Services, Strategies & Insights, & Recent Developments)* (Page No. - 187)
11.1 Alticor Inc.
11.2 Avon Products Inc.
11.3 Kao Corp.
11.4 L'or�al Group
11.5 Mary Kay Inc.
11.6 Oriflame Cosmetics S.A.
11.7 Procter & Gamble Co.
11.8 Revlon Inc.
11.9 Shiseido Co. Ltd.
11.10 Skinfood
11.11 The Est�e Lauder Companies Inc.
*Details on Company At A Glance, Recent Financials, Products & Services, Strategies & Insights, & Recent Developments Might Not Be Captured in Case of Unlisted Companies.
Appendix (Page No. - 245)
Mergers & Acquisitions
New Product/Technology Launches
Investments & Expansions
Agreements, Partnerships & Collaborations
List of Tables (97 Tables)
Table 1 Cosmetic Products Market Estimation
Table 2 Restricted Cosmetic Ingredients Under Fda Regulation & Their Descriptions
Table 3 Cosmetic Product Market Size, By Type, 2012�2019 ($Billion)
Table 4 Skin Care: Products Market Size, By Geography, 2012�2019 ($Billion)
Table 5 Hair Care: Cosmetic Products Market Size, By Geography, 2012�2019 ($Billion)
Table 6 Fragrances & Deodorants: Products Market Size, By Geography, 2012�2019 ($Billion)
Table 7 Personal Hygiene: Products Market Size, By Geography, 2012�2019 ($Billion)
Table 8 Color Cosmetics Market Size, By Geography, 2012�2019 ($Billion)
Table 9 Oral Hygiene Products: Products Market Size, By Geography, 2012�2019 ($Billion)
Table 10 Soap, Bath & Shower Products: Market Size, By Geography, 2012�2019 ($Billion)
Table 11 Sun Care Products: Market Size, By Geography, 2012�2019 ($Billion)
Table 12 Others: Cosmetic Products Market Size, By Geography, 2012�2019 ($Billion)
Table 13 Market Size, By Distribution Channel, 2012�2019 ($Billion)
Table 14 Supermarkets: Market Size, By Geography, 2012-2019 ($Billion)
Table 15 Pharmacy & Drug Stores: Products Market Size, By Geography, 2012-2019 ($Billion)
Table 16 Department Stores:Market Size, By Geography, 2012-2019 ($Billion)
Table 17 Direct Selling: Products Market Size, By Geography, 2012-2019 ($Billion)
Table 18 Specialty Stores: Market Size, By Geography, 2012-2019 ($Billion)
Table 19 Beauty Salons: Products Market Size, By Geography, 2012-2019 ($Billion)
Table 20 Internet Retailing: Cosmetic Products Market Size, By Geography, 2012-2019 ($Billion)
Table 21 Others: Cosmetic Product Market Size, By Geography, 2012-2019 ($Billion)
Table 22 North America: Market Size, By Distribution Channel, 2012�2019 ($Billion)
Table 23 U.S.: Cosmetic Products Market Size, By Distribution Channel, 2012�2019, ($Billion)
Table 24 Canada: Cosmetic Products Market Size, By Distribution Channel, 2012�2019, ($Billion)
Table 25 Mexico: Cosmetic Products Market Size, By Distribution Channel, 2012�2019 ($Billion)
Table 26 Europe: Cosmetic Products Market Size, By Distribution Channel, 2012�2019 ($Billion)
Table 27 U.K.: Cosmetic Products Market Size, By Distribution Channel, 2012�2019 ($Billion)
Table 28 Italy: By Market Size, By Distribution Channel, 2012�2019 ($Billion)
Table 29 Germany: Cosmetic Products Market Size, By Distribution Channel, 2012�2019 ($Billion)
Table 30 Spain: Cosmetic Products Market Size, By Distribution Channel, 2012�2019 ($Billion)
Table 31 France: Cosmetic Products Market Size, By Distribution Channel, 2012�2019, 2012�2019 ($Billion)
Table 32 Russia: Cosmetic Products Market Size, By Distribution Channel, 2012�2019 ($Billion)
Table 33 Other European Countries: Market Size, By Distribution Channel, 2012�2019 ($Billion)
Table 34 Asia-Pacific: Cosmetic Products Market Size, By Distribution Channel, 2012�2019 ($Billion)
Table 35 China: Products Market Size, By Distribution Channel, 2012�2019 ($Billion)
Table 36 Japan: Cosmetic Products Market Size, By Distribution Channel, 2012�2019 ($Billion)
Table 37 India: Cosmetic Products Market Size, By Distribution Channel, 2012�2019 ($Billion)
Table 38 Korea: Cosmetic Products Market Size, By Distribution Channel, 2012�2019 ($Billion)
Table 39 Taiwan: Cosmetic Products Market Size, By Distribution Channel, 2012�2019 ($Billion)
Table 40 Australia: Cosmetic Products Market Size, By Distribution Channel, 2012�2019 ($Billion)
Table 41 Other Asia-Pacific Countries: Cosmetic Products Market Size, By Distribution Channel, 2012�2019 ($Billion)
Table 42 ROW: Cosmetic Products Market Size, By Distribution Channel, 2012�2019 ($Billion)
Table 43 Latin-America (Except Brazil & Chile): Cosmetic Products Market Size, By Distribution Channel, 2012�2019 ($Billion)
Table 44 Brazil: Cosmetic Products Market Size, By Distribution Channel ($Billion)
Table 45 Chile: Cosmetic Products Market Size, By Distribution Channel ($Billion)
Table 46 The Middle East: Market Size, By Distribution Channel ($Billion)
Table 47 Other ROW Countries: Market Size, By Distribution Channel ($Billion)
Table 48 Cosmetic Products Market Size, By Geography, 2012�2019 ($Billion)
Table 49 North America: Market Size, By Country, 2012-2019 ($Billion)
Table 50 North America: Market Size, By Type, 2012-2019 ($Billion)
Table 51 U.S.: Cosmetic Products Market Size, By Type, 2012-2019 ($Billion)
Table 52 Canada: Cosmetic Products Market Size, By Type, 2012-2019 ($Billion)
Table 53 Mexico: Cosmetic Products Market Size, By Type, 2012-2019 ($Billion)
Table 54 Europe: Cosmetic Products Market Size, By Country, 2012-2019 ($Billion)
Table 55 Europe: Cosmetic Products Market Size, By Type, 2012-2019 ($Billion)
Table 56 U.K.: Market Size, By Type, 2012-2019 ($Billion)
Table 57 Italy: Market Size, By Type, 2012-2019 ($Billion)
Table 58 Germany: Market Size, By Type, 2012-2019 ($Billion)
Table 59 Spain: Cosmetic Products Market Size, By Type, 2012-2019 ($Billion)
Table 60 France: By Market Size, By Type, 2012-2019 ($Billion)
Table 61 Russia: By Market Size, By Type, 2012-2019 ($Billion)
Table 62 Other European Countries: Market Size, By Type, 2012-2019 ($Billion)
Table 63 Asia-Pacific: By Market Size, By Country, 2012-2019 ($Billion)
Table 64 Asia-Pacific: By Market Size, By Type, 2012�2019 ($Billion)
Table 65 India: Market Size, By Type, 2012�2019 ($Billion)
Table 66 China: Cosmetic Products Market Size, By Type, 2012�2019 ($Billion)
Table 67 Korea: Market Size, By Type, 2012- 2019 ($Billion)
Table 68 Taiwan: Market Size, By Type, 2012-2019 ($Billion)
Table 69 Japan: Market Size, By Type, 2012�2019 ($Billion)
Table 70 Australia: Cosmetic Products Market Size, By Type, 2012�2019 ($Billion)
Table 71 Other Asia-Pacific Countries: Market Size, By Type, 2012-2019 ($Billion)
Table 72 ROW: Market Size, By Region/Country, 2012-2019 ($Billion)
Table 73 ROW: Cosmetic Product Market Size, By Type, 2012-2019 ($Billion)
Table 74 Latin America (Except Brazil & Chile): Cosmetic Products Market Size, By Type, 2012�2019 ($Billion)
Table 75 Brazil: Market Size By Type, 2012-2019 ($Billion)
Table 76 Chile: Market Size By Type, 2012-2019 ($Billion)
Table 77 The Middle East: Market Size, By Type, 2012�2019 ($Billion)
Table 78 Other ROW Countries: Market Size, By Type, 2012-2019 ($Billion)
Table 79 Mergers & Acquisitions, 2010�2013
Table 80 Agreements, Partnerships & Collaborations, 2011�2014
Table 81 New Product/Technology Launches, 2010-2013
Table 82 Expansions and Investments, 2011�2013
Table 83 Amway: Products & Their Description
Table 84 Avon: Products & Their Description
Table 85 Kao: Cosmetic Products & Their Description
Table 86 L�oreal: Products & Their Description
Table 87 Mary Kay: Products & Their Description
Table 88 Oriflame: Products & Their Description
Table 89 Procter & Gamble: Products & Their Description
Table 90 Revlon: Products & Their Description
Table 91 Shiseido: Products & Their Brands
Table 92 Skinfood: Products & Their Description
Table 93 Est�e Lauder: Cosmetic Products & Their Description
Table 94 Mergers & Acquisitions, 2009-2013
Table 95 New Product/Technology Launches, 2009-2013
Table 96 Investments & Expansions, 2009-2014
Table 97 Agreements, Partnerships & Collaborations, 2009-2014
List of Figures (33 Figures)
Figure 1 Research Methodology
Figure 2 Cosmetics Products: Market Size Estimation Methodology
Figure 3 Data Triangulation Methodology
Figure 4 Cosmetic Products Market Share (Value), By Geography, 2013
Figure 5 Market Segmentation
Figure 6 Market Size, By Geography,2013 Vs. 2019 ($Billion)
Figure 7 Market Size, By Distribution Channel, 2013 Vs. 2019 ($Billion)
Figure 8 Cosmetic Products Market Size, By Type, 2013
Figure 9 Cosmetic Products Market Life Cycle, By Geography, 2013 Vs. 2019
Figure 10 Cosmetic Products Dynamics: Drivers, Restraints, Opportunities, & Trends
Figure 11 Market Development, By Company & Strategy, 2009�2014
Figure 12 Cosmetic Products Supply Chain Analysis
Figure 13 Market Share Analysis, By Company, 2013
Figure 14 Timeline For Evolution of Cosmetics
Figure 15 Specialty Chemicals Market, 2012
Figure 16 R&D Trends in The Cosmetics Market
Figure 17 Direct Sales Approach
Figure 18 Cosmetic Market Impact Analysis
Figure 19 Cosmetic Consumption Share, By Age Group, 2012
Figure 20 Cosmetics Market Porter�s Five Forces Analysis
Figure 21 North America: Oral Hygiene Products Market, By Product Type, ($Billion), 2013
Figure 22 Cosmetic Products Market Share, By Distribution Channel, (Value), 2013
Figure 23 Traditional Distribution Channel
Figure 24 International Distribution Channel For Cosmetics
Figure 25 Canadian Market Share (Value), 2013
Figure 26 European Market Share (Value), By Country, 2013
Figure 27 The U.K. Cosmetic Product Export, 2013
Figure 28 Italian Cosmetic Products Market Size, By Type, 2013-2019 ($Billion)
Figure 29 Cosmetic Imports to Russia, 2011
Figure 30 Market Developments, 2009-2014
Figure 31 Market Share, By Growth Strategy, 2009�2014
Figure 32 Cosmetic Products Market Developments, By Growth Strategy, 2009�2014
Figure 33 Cosmetic Products Market Development Strategies, By Company, 2009�2014


Growth opportunities and latent adjacency in Cosmetic Products Market