Display Panel Market by Technology (LCD, OLED, and Others), Size (Small & Medium and Large), Farm Factor (Flat and Flexible), Resolution (8K, 4K, WQHD, FHD, HD, and Others), Application, and Geography - Global forecast to 2020


Panels are the display screens which act as surface for display and control components and serves as the direct interface for human/machine dialogue to display information in various forms such as text, video, picture, and others. These are used in several applications, such as TV, desktop monitor, notebook PC, tablet, mobile phone, automotive, digital signage, and others. The panel industry is witnessing rapid technological changes and OLED panels have currently become the emerging and potential technology. However, the display panel market is currently dominated by LCD panels which accounted for about 86.80% of the global display panel market in 2014.
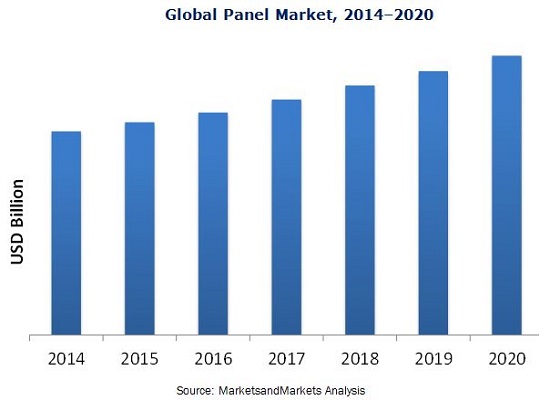
The market for display panels was valued at USD 114.16 Billion in 2014, and is expected to reach USD 156.57 Billion by 2020, at a CAGR of 5.60% between 2015 and 2020. The market is expected to be driven by the growing demand for large-sized UHD display panels for TVs, increasing demand for automotive and digital signage displays. Although the Asia-Pacific market accounted for the maximum market share in 2014, other regions are expected to witness higher growth rates during the forecast period. However, the market is restrained by factors including the overcapacity and decreasing price of panels that result in the reduction in profit margins and revenues.
Currently, Asia-Pacific accounts for the highest market share, as it is a well-established market and because of the increasing adoption rate of consumer products. However, the market is very small in other parts of the world including North America, Europe, and the RoW compared to Asia-Pacific. Asia-Pacific is expected to maintain the largest share of the market during the forecast period, driven by expanding panel manufacturing capacities, developing new and innovative panel technologies, established infrastructure for both panels and consumer electronics manufacturing and potential market for consumer electronics especially in China. It also provides a detailed analysis of the current market situation and the market till 2020. The report also analyses the market dynamics and the value chain of the market by considering the key stakeholders from panel vendors to OEMs.
This report profiles the major players which are active in the display panel market. It also comprises the competitive landscape of the main players including the key growth strategies and market share analysis of the same. Some of the key players profiled in the report are LG Display Co., Ltd. (South Korea), Samsung electronics Co., Ltd. (South Korea), Innolux Corporation (Taiwan), AU Optronics Corp. (Taiwan), Sharp Corporation (Japan), Japan Display Inc. (Japan), BOE Technology Group Co., Ltd. (China), Panasonic Corporation (Japan), HannStar Display Corporation (Taiwan), Chunghwa Picture Tubes Ltd. (Taiwan), and others.
Get online access to the report on the World's First Market Intelligence Cloud
Request Sample Scope of the Report

This research report categorizes the global display panel market; based on technology, size, form factor, resolution, application, and geography; it also covers the market size forecast of the display panel market.
On the basis of Technology:
The global display panel market has been segmented by technology into LCD, OLED, and others.
On the basis of Size:
The display panel market is further segmented into two sub-segments � small & medium, and large on the basis of size.
On the basis of Form Factor:
The display panel market is further segmented into two sub-segments � flat, and flexible on the basis of form factor.
On the basis of Resolution:
The display panel market is further segmented into six sub-segments � 8K, 4K, WQHD, FHD, HD, and others on the basis of resolution.
On the basis of application:
The market for panels has been further split based on application into two sub-segments such as TV, desktop monitor, notebook PC, tablet, mobile phone, automotive, digital signage, and others.
On the basis of geography:
The display panel market has been split in to four regions based on geography: North America, Europe, Asia-Pacific, and RoW. The market in North America includes the U.S., Canada, and Mexico, while Europe is divided into the U.K., Germany, and the rest of Europe. The Asia-Pacific market includes China, Japan, Taiwan, South Korea, and the rest of Asia-Pacific, while RoW has been divided into the Middle East & Africa, and South America.
Target Audience of the Report:
The intended audience for this report includes:
- Display products and solutions providers
- Display related service providers
- Research organizations and consulting companies
- Display related associations, organizations, forums, and alliances
- Government and corporate offices
- Outsourced display solutions providers
- Venture capitalists, private equity firms, and startup companies
- Distributors and traders
- Forums, alliances, and associations
- End users who want to know more about the display panel technology and latest technological developments in the display panel market
This report covers the market by panel technology, size, form factor, resolution, application, and geography. It also provides a detailed analysis of the current market situation and the market till 2020. It also includes the detailed analysis of market dynamics, Porter�s Five Forces model, value chain, competitive landscape, and market scenario during the forecast period. The report also covers the key competitors in the display panel market with their relative market share, revenues, market growth strategies, and mergers & acquisitions.
Available Customizations:
With the given market data, MarketsandMarkets offers customizations as per the company�s specific needs. The following customization options are available for the report:
Market Analysis
- Further breakdown of the panel applications market, by resolution
- Further breakdown of the panel applications market, by geography
Company Information
Detailed analysis and profiling of additional market players (up to five)
Panels are the display screens which act as surface for display and control components and serves as the direct interface for human/machine dialogue to display information in various forms such as text, video, picture, and others. These are used in several applications such as TV, desktop monitor, notebook PC, tablet, mobile phone, automotive, digital signage, and others. The demand for panels has been increasing at a considerable rate with the increasing demand for large-sized ultra-high definition panels for TVs and flexible displays for mobile phones and growing demand for automotive and digital signage displays. However, the market faces various challenges such as over-capacity, lack of technology know-how of OLED technology, and strict environmental rules and regulations, especially pertaining to the panel production. However, the market is expected to grow at an estimated CAGR of 5.60% between 2015 and 2020.
The key market players in the display panel market aim to increase their product offerings and market size in various applications and regions through collaborations, partnerships, new product launches, and by upgrading the existing facilities. The report covers the display panel market which has been segmented on the basis of technology, size, form factor, resolution, application, and geography. Furthermore, it comprises the analyses of the market dynamics during the forecast period, Porter�s Five Forces analysis, and the current competitive scenario along with the market size analysis of the key players. The report also includes the detailed profiles of the major players in the market along with their growth strategies.
This report describes the drivers, restraints, opportunities, and challenges pertaining to the display panel market. Furthermore, it analyzes the current market scenario and forecasts the market till 2020, including market segmentation based on technology, size, form factor, resolution, application, and geography. The OLED panel market is expected to grow at the highest CAGR of 22.48% during the forecast period. Asia-Pacific held the major share of 75.59% of the global market in 2014, followed by Europe and North America. Some of the major companies included in the report are LG Display Co., Ltd. (South Korea), Samsung electronics Co., Ltd. (South Korea), Innolux Corporation (Taiwan), AU Optronics Corp. (Taiwan), Sharp Corporation (Japan), Japan Display Inc. (Japan), BOE Technology Group Co., Ltd. (China), Panasonic Corporation (Japan), HannStar Display Corporation (Taiwan), Chunghwa Picture Tubes Ltd. (Taiwan), and others.
Table of Contents
1 Introduction (Page No. - 14)
1.1 Objectives of the Study
1.2 Market Definition
1.3 Study Scope
1.3.1 Markets Covered
1.3.2 Geographic Scope
1.3.3 Years Considered for the Study
1.4 Currency
1.5 Stakeholders
2 Research Methodology (Page No. - 18)
2.1 Research Data
2.1.1 Secondary Data
2.1.1.1 Key Data From Secondary Sources
2.1.2 Primary Data
2.1.2.1 Key Data From Primary Sources
2.1.2.2 Key Industry Insights
2.1.2.3 Breakdown of Primaries
2.2 Market Size Estimation
2.2.1 Bottom-Up Approach
2.2.2 Top-Down Approach
2.3 Market Breakdown and Data Triangulation
2.4 Research Assumptions and Limitations
2.4.1 Assumptions
2.4.2 Limitations
3 Executive Summary (Page No. - 27)
4 Premium Insights (Page No. - 32)
4.1 Opportunities in the Global Display Panel Market
4.2 Global Display Panel Market, By Technology
4.3 Global Display Panel Market, By Geography and By Technology
4.4 Global Display Panel Market, By Geography
4.5 Global Display Panel Market, By Size (2014, 2015, and 2020)
4.6 Global Display Panel Market, By Form Factor
5 Market Overview (Page No. - 37)
5.1 Introduction
5.2 Market Segmentation
5.2.1 By Panel Type
5.2.2 By Size
5.2.3 By Form Factor
5.2.4 By Resolution
5.2.5 By Application
5.2.6 By Geography
5.3 Market Dynamics
5.3.1 Drivers
5.3.1.1 Growing Demand for Large-Sized OLED Panels for Television
5.3.1.2 Increase in Demand for Public & Commercial Display Panels
5.3.1.3 Rising Demand for Automotive Displays
5.3.2 Restraints
5.3.2.1 Overcapacity Resulting in Decrease in Asp and Revenues
5.3.3 Opportunities
5.3.3.1 Growing Demand for Flexible Displays for Mobile Phones
5.3.3.2 Increasing Focus on R&D Activities
5.3.4 Challenges
5.3.4.1 Strict Safety and Environmental Regulations
6 Industry Trends (Page No. - 55)
6.1 Introduction
6.2 Value Chain Analysis
6.3 Porter�s Five Forces Model
6.3.1 Degree of Rivalry
6.3.2 Bargaining Power of Suppliers
6.3.3 Bargaining Power of Buyers
6.3.4 Threat of New Entrants
6.3.5 Threat of Substitutes
6.4 Industry Lifecycle
7 Global Display Panel Market, By Technology (Page No. - 64)
7.1 Introduction
7.2 LCD
7.3 OLED
7.4 Others
8 Global Display Panel Market, By Size (Page No. - 70)
8.1 Introduction
8.2 Small & Medium
8.3 Large
9 Global Display Panel Market, By Form Factor (Page No. - 73)
9.1 Introduction
9.2 Flat Panel
9.3 Flexible Panel
10 Global Display Panel Market, By Resolution (Page No. - 78)
10.1 Introduction
10.2 8k
10.3 4k
10.4 WQHD (2k)
10.5 FHD
10.6 HD
10.7 Others
11 Global Display Panel Market, By Application (Page No. - 88)
11.1 Introduction
11.2 TV
11.3 Desktop Monitor
11.4 Notebook Pc
11.5 Tablet
11.6 Mobile Phone
11.7 Automotive
11.8 Digital Signage
11.9 Others
11.9.1 Smart Watch
11.9.2 Ebook Reader
11.9.3 Medical & Industrial Display
12 Global Display Panel Market, By Geography (Page No. - 106)
12.1 Introduction
12.2 North America
12.2.1 U.S.
12.2.2 Canada
12.2.3 Mexico
12.3 Europe
12.3.1 U.K.
12.3.2 Germany
12.4 Asia-Pacific
12.4.1 China
12.4.2 Japan
12.4.3 Taiwan
12.4.4 South Korea
12.5 Rest of the World
12.5.1 Middle East and Africa
12.5.2 South America
13 Competitive Landscape (Page No. - 116)
13.1 Overview
13.2 Market Share Analysis of Display Panel Market
13.3 Competitive Situation and Trends
13.3.1 New Product Launches
13.3.2 Mergers and Acquisitions
13.3.3 Agreements, Collaborations, Contracts, and Partnerships
13.3.4 Expansions
14 Company Profiles (Page No. - 124)
(Overview, Products and Services, Financials, Strategy & Development)*
14.1 Introduction
14.2 LG Display Co., Ltd.
14.3 Samsung Electronics Co., Ltd.
14.4 AU Optronics Corp.
14.5 Innolux Corporation
14.6 Sharp Corporation
14.7 BOE Technology Group Co., Ltd.
14.8 Japan Display Inc.
14.9 Panasonic Corporation
14.10 Hannstar Display Corporation
14.11 Chunghwa Picture Tubes Ltd. (Taiwan)
*Details on Overview, Products and Services, Financials, Strategy & Development Might Not Be Captured in Case of Unlisted Companies.
15 Appendix (Page No. - 155)
15.1 Insights of Industry Experts
15.2 Discussion Guide
15.3 Competitive Landscape
15.4 Introducing RT: Real-Time Market Intelligence
15.5 Available Customizations
15.6 Related Reports
List of Tables (75 Tables)
Table 1 Global Display Panel Market, By Resolution, 2014�2020 (USD Billion)
Table 2 Impact Analysis of Drivers
Table 3 Impact Analysis of Restraint
Table 4 Impact Analysis of Opportunity
Table 5 Impact Analysis of Challenge
Table 6 Global Display Panel Market, By Technology, 2014�2020 (USD Billion)
Table 7 Global Display Panel Market, By Technology, 2014�2020 (Million Units)
Table 8 Global LCD Panel Market, By Application, 2014�2020 (USD Billion)
Table 9 Global LCD Panel Market, By Application, 2014�2020 (Million Units)
Table 10 Global OLED Panel Market, By Application, 2014�2020 (USD Million)
Table 11 Global OLED Panel Market, By Application, 2014�2020 (Million Units)
Table 12 Global Other Technology Panel Market, By Application, 2014�2020 (USD Million)
Table 13 Global Other Technology Panel Market, By Application, 2014�2020 (Million Units)
Table 14 Global Display Panel Market, By Size, 2014�2020 (USD Billion)
Table 15 Global Small & Medium Display Panel Market, By Application, 2014�2020 (USD Billion)
Table 16 Global Large Display Panel Market, By Application, 2014�2020 (USD Billion)
Table 17 Global Display Panel Market, By Form Factor, 2014�2020 (USD Billion)
Table 18 Global Display Panel Market, By Form Factor, 2014�2020 (Million Units)
Table 19 Global Flat Panel Market, By Application, 2014�2020 (USD Billion)
Table 20 Global Flat Panel Market, By Application, 2014�2020 (Million Units)
Table 21 Global Flexible Panel Market, By Application, 2014�2020 (USD Million)
Table 22 Global Flexible Panel Market, By Application, 2014�2020 (Million Units)
Table 23 Global Display Panel Market, By Resolution, 2014�2020 (USD Billion)
Table 24 Global Display Panel Market, By Resolution, 2014�2020 (Million Units)
Table 25 Global 8k Panel Market, By Application, 2014�2020 (USD Million)
Table 26 Global 8k Panel Market, By Application, 2014�2020 (Million Units)
Table 27 Global 4k Panel Market, By Application, 2014�2020 (USD Million)
Table 28 Global 4k Panel Market, By Application, 2014�2020 (Million Units)
Table 29 Global WQHD Panel Market, By Application, 2014�2020 (USD Million)
Table 30 Global WQHD Panel Market, By Application, 2014�2020 (Million Units)
Table 31 Global FHD Panel Market, By Application, 2014�2020 (USD Million)
Table 32 Global FHD Panel Market, By Application, 2014�2020 (Million Units)
Table 33 Global HD Panel Market, By Application, 2014�2020 (USD Million)
Table 34 Global HD Panel Market, By Application, 2014�2020 (Million Units)
Table 35 Global Other Resolution Panel Market, By Application, 2014�2020 (USD Million)
Table 36 Global Other Resolution Panel Market, By Application, 2014�2020 (Million Units)
Table 37 Global Display Panel Market, By Application, 2014�2020 (USD Billion)
Table 38 Global Display Panel Market, By Application, 2014�2020 (Million Units)
Table 39 Global TV Panel Market, By Technology, 2014�2020 (USD Billion)
Table 40 Global TV Panel Market, By Technology, 2014�2020 (Million Units)
Table 41 Global TV Panel Market, By Form Factor, 2014�2020 (USD Billion)
Table 42 Global TV Panel Market, By Form Factor, 2014�2020 (Million Units)
Table 43 Global Desktop Monitor Panel Market, By Technology, 2014�2020 (USD Million)
Table 44 Global Desktop Monitor Panel Market, By Technology, 2014�2020 (Million Units)
Table 45 Global Notebook Pc Panel Market, By Technology, 2014�2020 (USD Million)
Table 46 Global Notebook Pc Panel Market, By Technology, 2014�2020 (Million Units)
Table 47 Global Tablet Panel Market, By Technology, 2014�2020 (USD Billion)
Table 48 Global Tablet Panel Market, By Technology, 2014�2020 (Million Units)
Table 49 Global Tablet Panel Market, By Form Factor, 2014�2020 (USD Billion)
Table 50 Global Tablet Panel Market, By Form Factor, 2014�2020 (Million Units)
Table 51 Global Mobile Phone Panel Market, By Technology, 2014�2020 (USD Billion)
Table 52 Global Mobile Phone Panel Market, By Technology, 2014�2020 (Million Units)
Table 53 Global Mobile Phone Panel Market, By Form Factor, 2014�2020 (USD Billion)
Table 54 Global Mobile Phone Panel Market, By Form Factor, 2014�2020 (Million Units)
Table 55 Global Automotive Panel Market, By Technology, 2014�2020 (USD Million)
Table 56 Global Automotive Panel Market, By Technology, 2014�2020 (Million Units)
Table 57 Global Automotive Panel Market, By Form Factor, 2014�2020 (USD Million)
Table 58 Global Automotive Panel Market, By Form Factor, 2014�2020 (Million Units)
Table 59 Global Digital Signage Panel Market, By Technology, 2014�2020 (USD Million)
Table 60 Global Digital Signage Panel Market, By Technology, 2014�2020 (Million Units)
Table 61 Global Digital Signage Panel Market, By Form Factor, 2014�2020 (USD Million)
Table 62 Global Digital Signage Panel Market, By Form Factor, 2014�2020 (Million Units)
Table 63 Global Other Applications Display Panel Market, By Technology, 2014�2020 (USD Million)
Table 64 Global Other Applications Display Panel Market, By Technology, 2014�2020 (Million Units)
Table 65 Global Other Applications Display Panel Market, By Form Factor, 2014�2020 (USD Billion)
Table 66 Global Other Applications Display Panel Market, By Form Factor, 2014�2020 (Million Units)
Table 67 Global Display Panel Market, By Geography, 2014�2020 (USD Billion)
Table 68 North American Display Panel Market, By Country, 2014�2020 (USD Billion)
Table 69 European Display Panel Market, By Country, 2014�2020 (USD Billion)
Table 70 Asia-Pacific Display Panel Market, By Country, 2014�2020 (USD Billion)
Table 71 RoW Display Panel Market, By Region, 2014�2020 (USD Billion)
Table 72 New Product Launches, 2014�2015
Table 73 Mergers and Acquisitions, 2012�2014
Table 74 Agreements, Collaborations, Contracts, and Partnerships, 2013�2015
Table 75 Expansions, 2013�2014
List of Figures (70 Figures)
Figure 1 Markets Covered By the Global Display Panel Market
Figure 2 Global Display Panel Market, By Geography
Figure 3 Years Considered for the Study of the Global Display Panel Market
Figure 4 Research Design
Figure 5 Market Size Estimation Methodology: Bottom-Up Approach
Figure 6 Market Size Estimation Methodology: Top-Down Approach
Figure 7 Market Breakdown and Data Triangulation
Figure 8 Assumptions of the Research Study
Figure 9 Limitations of the Research Study
Figure 10 Global Display Panel Market Snapshot (2014 vs 2020): the Small & Medium Panel Segment to Witness the Highest Growth During the Forecast Period
Figure 11 Global Display Panel Market for the Digital Signage Application is Expected to Grow at the Highest Rate During the Forecast Period
Figure 12 Global Display Panel Market Snapshot (2014 vs 2020): OLED Panels to Witness the Highest Growth During the Forecast Period
Figure 13 Global Display Panel Market, By Geography, 2014
Figure 14 Attractive Market Opportunities for the Display Panel Market (2014�2020)
Figure 15 OLED Panel Segment is Expected to Witness the Highest Growth Rate During the Forecast Period
Figure 16 Asia-Pacific Held the Largest Share of the Display Panel Market in 2014
Figure 17 Asia-Pacific Accounted for Over Three-Fourth of the Global Display Panel Market in 2014
Figure 18 Large Display Panels Accounted for the Largest Share of the Display Panel Market in 2014
Figure 19 Flexible Display Panel Market Expected to Grow at the Highest Rate During the Forecast Period
Figure 20 Global Display Panel Market Segmentation
Figure 21 Global Display Market, By Type
Figure 22 Global Display Panel Market, By Size
Figure 23 Global Display Panel Market, By Form Factor
Figure 24 Global Display Panel Market, By Resolution
Figure 25 Global Display Panel Market, By Application
Figure 26 Global Display Panel Market, By Geography
Figure 27 Drivers, Restraints, Opportunities, and Challenges for the Display Panel Market
Figure 28 Global Motor Vehicle Production, By Vehicle Type, 2010�2014 (Million Units)
Figure 29 Global Motor Vehicle Production, By Geography, 2010�2014 (Thousand Units)
Figure 30 Global Motor Vehicle Sales, By Type, 2010�2014 (Million Units)
Figure 31 Global Motor Vehicle Sales, By Geography, 2010�2014 (Thousand Units)
Figure 32 Global Motor Vehicle, Production vs Sales, 2010�2014 (Million Units)
Figure 33 R&D Expenditure of Major Companies in the Display Panel Market, 2014
Figure 34 Global Display Panel Market: Value Chain Analysis
Figure 35 Porter�s Five Forces Analysis
Figure 36 The Porter�s Five Forces Analysis for the Global Display Panel Market
Figure 37 Global Display Panel Market: Degree of Rivalry
Figure 38 Global Display Panel Market: Bargaining Power of Suppliers
Figure 39 Global Display Panel Market: Bargaining Power of Buyers
Figure 40 Global Display Panel Market: Threat of New Entrants
Figure 41 Global Display Panel Market: Threat of Substitutes
Figure 42 Global Display Panel Market: Industry Life Cycle
Figure 43 Global Display Panel Market, By Technology
Figure 44 Global Display Panel Market, By Size
Figure 45 Global Display Panel Market, By Form Factor
Figure 46 Global Display Panel Market, By Resolution
Figure 47 Global Display Panel Market, By Application
Figure 48 Global Display Panel Market, By Geography, 2014
Figure 49 North American Display Panel Market, 2014-2020
Figure 50 European Display Panel Market, 2014�2020
Figure 51 Asia-Pacific Display Panel Market, 2014�2020
Figure 52 Top 5 Companies Adopted New Product Launches as the Key Growth Strategy Over the Last Three Years
Figure 53 Display Panel Market Share Analysis, 2014
Figure 54 Market Evolution Framework: New Product Launches Have Fueled Growth and Innovation in the Global Display Panel Market
Figure 55 Battle for Market Share: New Product Launches has Emerged as the Key Strategy
Figure 56 Geographic Revenue Mix of Top Market Players
Figure 57 LG Display Co., Ltd.: Company Snapshot
Figure 58 SWOT Analysis of LG Display Co., Ltd.
Figure 59 Samsung Electronics Co., Ltd.: Company Snapshot
Figure 60 SWOT Analysis of Samsung Electronics Co., Ltd.
Figure 61 AU Optronics Corporation: Company Snapshot
Figure 62 SWOT Analysis of AU Optronics Corp.
Figure 63 Innolux Corporation: Company Snapshot
Figure 64 SWOT Analysis of Innolux Corporation
Figure 65 Sharp Corporation: Company Snapshot
Figure 66 SWOT Analysis of Sharp Corporation
Figure 67 BOE Technology Group Co., Ltd.: Company Snapshot
Figure 68 Japan Display Inc: Company Snapshot
Figure 69 Panasonic Corporation: Company Snapshot
Figure 70 Hannstar Display Corporation: Company Snapshot


Growth opportunities and latent adjacency in Display Panel Market