Distributed Acoustic Sensing (DAS) Market by Component (Interrogator Units, Visualization Software), Fiber Type (Single-mode Fiber and Multimode fiber), Industry (Oil & Gas, Infrastructure, Transportation), and Region - Global Forecast to 2025


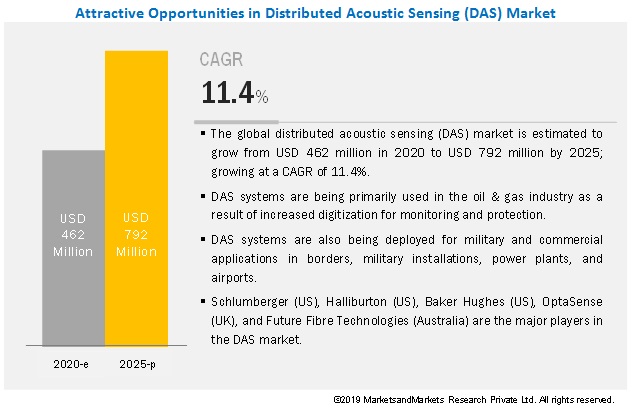
[172 Pages Report] According to MarketsandMarkets, the global distributed acoustic sensing market (DAS) is estimated to grow from USD 462 million in 2020 to USD 792 million by 2025; it is expected to grow at a Compound Annual Growth Rate (CAGR) of 11.4% during 2020�2025. Unlike traditional sensors that are electrically powered, DAS systems are immune to electromagnetic interferences, have a higher range, a longer lifespan, and can also operate in harsh environments. This is one of the primary drivers for their adoption in the oil & gas industry. In tandem, DAS systems have also been developed for other industries such as infrastructure, military, and transportation. As a result of the spread of COVID-19, DAS manufacturers that have an existing stock of hardware components (mainly interrogator units) may find it difficult to clear their current inventory due to low demand owing to the effects of the pandemic. Thus, many of the distributed acoustic sensing manufacturers are expected to decrease their production.
Distributed Acoustic Sensing Market for software component to grow at highest CAGR during forecast period
Distributed Acoustic Sensing Market for Single-mode fiber to hold larger share of market throughout forecast period
Oil & gas industry to dominate Distributed Acoustic Sensing market throughout forecast period
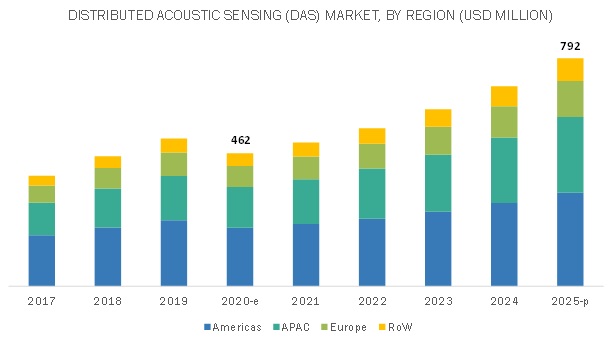
Distributed Acoustic Sensing Market in APAC expected to grow at highest CAGR during forecast period
Key Market Players
Get online access to the report on the World's First Market Intelligence Cloud
- Easy to Download Historical Data & Forecast Numbers
- Company Analysis Dashboard for high growth potential opportunities
- Research Analyst Access for customization & queries
- Competitor Analysis with Interactive dashboard
- Latest News, Updates & Trend analysis
Request Sample Scope of the Report
:
Get online access to the report on the World's First Market Intelligence Cloud
- Easy to Download Historical Data & Forecast Numbers
- Company Analysis Dashboard for high growth potential opportunities
- Research Analyst Access for customization & queries
- Competitor Analysis with Interactive dashboard
- Latest News, Updates & Trend analysis

|
Report Metric |
Detail |
| Market size available for years | 2017�2025 |
| Base year | 2019 |
| Forecast period | 2020�2025 |
| Units | Value (USD million/billion) |
| Segments covered | Component, fiber type, industry, and geography |
| Geographic regions covered | Americas, Europe, APAC, and RoW |
| Companies covered | Schlumberger (US), Halliburton (US), Baker Hughes (US), OptaSense (UK), Future Fibre Technologies (Australia), Fotech Solutions (UK), Bandweaver (China), Hifi Engineering (Canada), Omnisens (Switzerland), Silixa (UK), Aragon Photonics (Spain), Solifos (Switzerland), Febus Optics (France), ofs (US), fibrisTerre (Germany), Senstar (Canada), AP Sensing (Germany), T.G. Baker Americas (US), Fibre Completion Services (Canada), Yokogawa Electric (Japan), NKT Photonics (Denmark), Weatherford (US), Cementys (France), and Fiber SenSys (US) |
Distributed Acoustic Sensing Market By Component:
- Hardware (Interrogator Unit and Optical Fiber)
- Visualization Software
- Services (Installation and Maintenance)
- COVID-19 impact on various components of DAS systems
- Single-mode Fiber
- Multimode Fiber
- COVID-19 impact on market for fiber optic cable
- Oil & Gas (Oilfield Services and Pipeline Integrity)
- Infrastructure
- Military (Border Surveillance and Support Operations)
- Transportation (Rail and Road)
- Others (Underwater Asset Management and Cable Monitoring)
- COVID-19 impact on DAS Market for various industries
- Americas
- North America (US, Canada, Mexico)
- South America (Brazil, Argentina, Venezuela, and Rest of South America)
- Europe
- Russia
- Germany
- UK
- Rest of Europe
- APAC
- China
- Japan
- India
- Indonesia
- Australia
- Rest of APAC
- RoW
- Middle East
- Africa
- COVID-19 impact on DAS market in various regions
Recent Developments
- In October 2019, Halliburton (US) signed a multiyear agreement with Repsol S.A. (Spain), a company engaged in upstream and downstream activities in the oil & gas industry, to provide a cloud-based master data management solution for exploration and production (E&P) activities.
- The software as a service (SaaS) model enables users to load, ingest, manage, and access log, well, and other E&P data across different locations for greater efficiency and productivity throughout Repsol�s asset portfolio.
- In February 2020, OptaSense (UK) announced the opening of a new subsidiary in Canada to meet the growing demands of the Canadian market. The expansion is expected to support the company�s growth of its engineering, field, and service teams worldwide.
- In February 2020, Fotech Solutions (UK) was acquired by BP (UK), one of the world�s largest multinational oil & gas companies. Through this acquisition, Fotech will be able to enhance its technology offering.
COVIG 19-related Developments
- During the first quarter of 2020, the CEO of Halliburton (US) announced that it will reduce overhead costs by USD 1 billion, lower capital expenditures by USD 800 million, and take further actions in response to the evolving market conditions.
- In response to the COVID-19 pandemic, OptaSense (UK) has implemented the following actions to ensure business continuity: conduct daily briefings with parent company QinetiQ, and provide remote work access to employees, maintaining inventory levels to ensure no disruption in product supply lead times, and providing remote engineering services to its clients.
- In response to the COVID-19 pandemic, Fotech Solutions (UK) has implemented the following actions to ensure business continuity: the product manufacturing team is continuing to manufacture essential products to ensure supply, the company is also building up product stock to safeguard itself against further escalation of the crisis, and the company is ensuring that its suppliers deliver the necessary goods essential to manufacturing activities.
Key Questions Addressed in the Report
- What will be the dynamics for the adoption of DAS systems based on the fiber type?
- How will different regions (the Americas, Europe, APAC, and Row) contribute to the overall distributed acoustic sensing (DAS) market growth by 2025?
- Which countries are expected to adopt DAS systems at the fastest rate?
- What will be the value contribution from services, software, and various hardware components in the overall distributed acoustic sensing market?
- What are the key market dynamics influencing market growth? How will they turn into strengths or weaknesses of companies operating in the DAS market space?
1 INTRODUCTION (Page No. - 18) 1.1 STUDY OBJECTIVES
1.2 MARKET DEFINITION AND SCOPE
1.2.1 INCLUSIONS AND EXCLUSIONS
1.3 STUDY SCOPE
1.3.1 MARKETS COVERED
1.3.2 YEARS CONSIDERED
1.4 CURRENCY & PRICING
1.5 LIMITATIONS
1.6 STAKEHOLDERS
2 RESEARCH METHODOLOGY (Page No. - 22)
2.1 RESEARCH DATA
2.1.1 SECONDARY DATA
2.1.1.1 Major secondary sources
2.1.1.2 Key data from secondary sources
2.1.2 PRIMARY DATA
2.1.2.1 Key data from primary sources
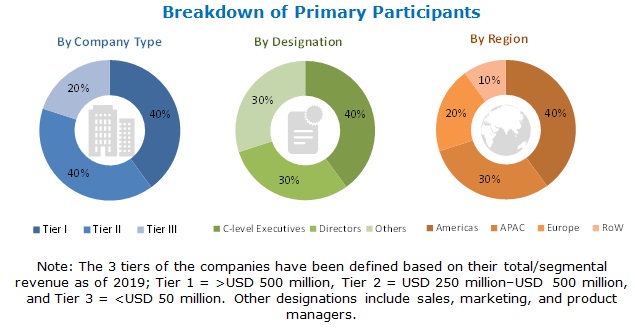
2.1.2.2 Breakdown of primaries
2.1.3 SECONDARY AND PRIMARY RESEARCH
2.1.3.1 Key industry insights
2.2 MARKET SIZE ESTIMATION
2.2.1 BOTTOM-UP APPROACH
2.2.2 TOP-DOWN APPROACH
2.2.3 MARKET PROJECTIONS
2.3 MARKET BREAKDOWN AND DATA TRIANGULATION
2.4 RESEARCH ASSUMPTIONS AND LIMITATIONS
2.4.1 ASSUMPTIONS
2.4.2 LIMITATIONS
3 EXECUTIVE SUMMARY (Page No. - 33)
3.1 REALISTIC SCENARIO
3.2 OPTIMISTIC SCENARIO
3.3 PESSIMISTIC SCENARIO
4 PREMIUM INSIGHTS (Page No. - 42) 4.1 ATTRACTIVE OPPORTUNITIES IN DISTRIBUTED ACOUSTIC SENSING MARKET
4.2 DAS MARKET, BY FIBER TYPE
4.3 DAS MARKET, BY COMPONENT
4.4 DAS MARKET IN NORTH AMERICA, BY INDUSTRY AND BY COUNTRY
4.5 DAS MARKET, BY COUNTRY
5 MARKET OVERVIEW (Page No. - 45)
5.1 INTRODUCTION
5.2 EVOLUTION
5.3 MARKET DYNAMICS
5.3.1 DRIVERS
5.3.1.1 Growing deployment of DAS systems in oil & gas industry due to digitization
5.3.1.2 Increasing adoption of DAS systems for perimeter and border surveillance
5.3.2 RESTRAINTS
5.3.2.1 Technical issues and cost constraints associated with deployment of optical fiber cables and interrogators
5.3.3 OPPORTUNITIES
5.3.3.1 Inherent advantages of DAS systems leading to use in new and unconventional applications
5.3.3.2 Use of distributed temperature sensing systems along with DAS systems
5.3.3.3 Monitoring of abandoned oil & gas wells using existing DAS systems
5.3.4 CHALLENGES
5.3.4.1 Interoperability issues with complex data sets and visualization software
5.3.4.2 Data storage issues in DAS systems
5.3.4.3 Lack of standards and guidelines for DAS equipment
5.3.4.4 Difficulty faced by DAS manufacturers in clearing their current inventory due to COVID-19 pandemic
5.4 VALUE CHAIN ANALYSIS
6 DISTRIBUTED ACOUSTIC SENSING MARKET, BY COMPONENT (Page No. - 54) 6.1 INTRODUCTION
6.2 HARDWARE
6.2.1 OPTICAL FIBER
6.2.1.1 Optical fibers act as sensors in DAS systems
6.2.2 INTERROGATOR UNIT
6.2.2.1 Interrogator units utilize Rayleigh backscatter phenomenon for DAS applications
6.3 VISUALIZATION SOFTWARE
6.3.1 VISUALIZATION SOFTWARE HELPS IN OBSERVING VARIOUS EVENTS DETECTED BY DAS SYSTEMS
6.4 SERVICES
6.4.1 INSTALLATION
6.4.1.1 Installation of DAS system requires long period of time and capital investment
6.4.2 MAINTENANCE
6.4.2.1 DAS systems generally require minimal maintenance throughout their lifetime
6.5 IMPACT OF COVID-19 ON VARIOUS COMPONENTS OF DAS SYSTEMS
6.5.1 MOST IMPACTED COMPONENT
6.5.2 LEAST IMPACTED COMPONENT
7 DISTRIBUTED ACOUSTIC SENSING MARKET, BY FIBER TYPE (Page No. - 61)
7.1 INTRODUCTION
7.2 SINGLE-MODE FIBERS
7.2.1 SINGLE-MODE FIBERS ARE INTENDED FOR LONG-DISTANCE APPLICATIONS
7.3 MULTIMODE FIBERS
7.3.1 MULTIMODE FIBERS ARE INTENDED FOR SHORT HAUL COMMUNICATIONS
7.4 IMPACT OF COVID-19 ON FIBER OPTIC CABLE MARKET
8 DISTRIBUTED ACOUSTIC SENSING MARKET, BY INDUSTRY (Page No. - 72)
8.1 INTRODUCTION
8.2 OIL & GAS
8.2.1 OILFIELD SERVICES
8.2.1.1 Production
8.2.1.1.1 Production services using DAS technology help in maintaining wellbore integrity
8.2.1.2 Completion
8.2.1.2.1 DAS systems provide real-time monitoring of fracture treatment operations
8.2.1.3 Evaluation
8.2.1.3.1 Borehole seismic evaluation using DAS can help in obtaining higher returns
8.2.2 PIPELINE INTEGRITY
8.2.2.1 Leak detection
8.2.2.1.1 DAS systems can detect leaks and ruptures in pipelines with high accuracy
8.2.2.2 Pipeline protection
8.2.2.2.1 DAS technology helps in detection of third-party intrusion of pipelines
8.3 MILITARY
8.3.1 BORDER SURVEILLANCE
8.3.1.1 DAS solutions can detect multiple threats in real-time for border surveillance operations
8.3.2 SUPPORT OPERATIONS
8.3.2.1 DAS systems are being used to detect surface and subsurface level threats
8.4 INFRASTRUCTURE
8.4.1 DAS TECHNOLOGY IS BEING UTILIZED FOR STRUCTURAL HEALTH MONITORING OF CIVIL INFRASTRUCTURES
8.5 TRANSPORTATION
8.5.1 RAIL
8.5.1.1 DAS systems act as continuous sensors along entire length of railway track
8.5.2 ROAD
8.5.2.1 DAS systems are being utilized for real-time traffic monitoring in roads and highways
8.6 OTHERS
8.6.1 UNDERWATER ASSET MANAGEMENT
8.6.1.1 DAS systems are deployed for protecting underwater assets such as pipelines, spool pieces, and cables
8.6.2 CABLE MONITORING
8.6.2.1 DAS systems can monitor overhead and underground power transmission cables
8.7 IMPACT OF COVID-19 ON VARIOUS INDUSTRIES ADOPTING DAS SYSTEMS
8.7.1 HIGHLY IMPACTED INDUSTRIES
8.7.2 LEAST IMPACTED INDUSTRIES
9 GEOGRAPHIC ANALYSIS (Page No. - 105)
9.1 INTRODUCTION
9.2 AMERICAS
9.2.1 NORTH AMERICA
9.2.1.1 US
9.2.1.1.1 US to remain largest market for DAS systems in North America throughout forecast period
9.2.1.2 Canada
9.2.1.2.1 Extensive oil production activities to fuel demand for DAS systems in Canada
9.2.1.3 Mexico
9.2.1.3.1 Increase in foreign investments in oil & gas industry driving demand for DAS systems
9.2.2 SOUTH AMERICA
9.2.2.1 Argentina
9.2.2.1.1 Government initiatives to encourage development of both conventional and unconventional oil & gas reserves to support DAS market growth
9.2.2.2 Brazil
9.2.2.2.1 Rise in new subsalt reserve oil production projects to encourage DAS market growth in Brazil
9.2.2.3 Venezuela
9.2.2.3.1 Entry of foreign oil & gas companies in Venezuela to support DAS market growth
9.3 EUROPE
9.3.1 RUSSIA
9.3.1.1 Russia was world�s third-largest oil & gas producer in 2019
9.3.2 GERMANY
9.3.2.1 Implementation of DAS systems in infrastructure industry to propel market growth
9.3.3 UK
9.3.3.1 Presence of several key DAS players to support DAS market growth in UK
9.3.4 REST OF EUROPE
9.4 APAC
9.4.1 CHINA
9.4.1.1 In 2019, China held largest share of DAS market in APAC
9.4.2 INDIA
9.4.2.1 Among all APAC countries, DAS market in India is expected to grow at highest CAGR during forecast period
9.4.3 JAPAN
9.4.3.1 DAS system deployment for infrastructure monitoring applications to drive market growth in Japan
9.4.4 INDONESIA
9.4.4.1 Government funding for infrastructure modernization to foster DAS market growth in Indonesia
9.4.5 AUSTRALIA
9.4.5.1 Australia is largest producer of LNG and has significant layover of pipelines
9.4.6 REST OF APAC
9.5 ROW
9.5.1 MIDDLE EAST
9.5.1.1 Middle East expected to hold larger share of market in RoW throughout forecast period
9.5.2 AFRICA
9.5.2.1 Government initiatives to enhance industrial sector to drive DAS market in Africa
9.6 IMPACT OF COVID-19 ON DAS MARKET IN VARIOUS REGIONS
9.6.1 REGIONS IN WHICH DAS MARKET MIGHT BE HIGHLY IMPACTED
9.6.2 REGION IN WHICH DAS MARKET MIGHT BE LEAST IMPACTED
10 COMPETITIVE LANDSCAPE (Page No. - 125) 10.1 OVERVIEW
10.2 RANKING OF TOP 5 COMPANIES
10.3 COMPETITIVE LEADERSHIP MAPPING
10.3.1 VISIONARY LEADERS
10.3.2 DYNAMIC DIFFERENTIATORS
10.3.3 INNOVATORS
10.3.4 EMERGING COMPANIES
10.4 STRENGTH OF PRODUCT PORTFOLIO (25 PLAYERS)
10.5 BUSINESS STRATEGY EXCELLENCE (25 PLAYERS)
10.6 COMPETITIVE SITUATIONS AND TRENDS
10.6.1 PARTNERSHIPS AND COLLABORATIONS & JOINT VENTURES
10.6.2 CONTRACTS AND AGREEMENTS
10.6.3 PRODUCT LAUNCHES
10.6.4 EXPANSIONS
10.6.5 ACQUISITIONS
11 COMPANY PROFILES (Page No. - 135)
11.1 INTRODUCTION
(Business overview, Products/solutions/services offered, Recent developments, COVID-19-related developments, SWOT analysis, MnM view)*
11.2 KEY PLAYERS
11.2.1 SCHLUMBERGER
11.2.2 HALLIBURTON
11.2.3 BAKER HUGHES
11.2.4 OPTASENSE
11.2.5 FUTURE FIBRE TECHNOLOGIES
11.2.6 FOTECH SOLUTIONS
11.2.7 BANDWEAVER
11.2.8 HIFI ENGINEERING
11.2.9 OMNISENS
11.2.10 SILIXA
*Business overview, Products/solutions/services offered, Recent developments, COVID-19-related developments, SWOT analysis, MnM view might not be captured in case of unlisted companies.
11.3 RIGHT TO WIN
11.3.1 SCHLUMBERGER
11.3.2 HALLIBURTON
11.3.3 BAKER HUGHES
11.3.4 OPTASENSE
11.3.5 FUTURE FIBRE TECHNOLOGY
11.4 OTHER KEY PLAYERS
11.4.1 ARAGON PHOTONICS
11.4.2 FIBRISTERRE
11.4.3 FEBUS OPTICS
11.4.4 AP SENSING
11.4.5 SENSTAR
11.4.6 ZIEBEL
11.4.7 FIBRE COMPLETION SERVICES
11.4.8 OFS
11.4.9 SOLIFOS
11.4.10 T.G. BAKER AMERICAS
12 APPENDIX (Page No. - 166) 12.1 DISCUSSION GUIDE
12.2 KNOWLEDGE STORE: MARKETSANDMARKETS� SUBSCRIPTION PORTAL
12.3 AVAILABLE CUSTOMIZATIONS
12.4 RELATED REPORTS
12.5 AUTHOR DETAILS
LIST OF TABLES (107 Tables)
TABLE 1 DISTRIBUTED ACOUSTIC SENSING MARKET, BY COMPONENT, 2017�2025 (USD MILLION)
TABLE 2 DAS MARKET FOR HARDWARE, BY TYPE, 2017�2025 (USD MILLION)
TABLE 3 EXAMPLES OF INTERROGATOR UNITS OFFERED BY VARIOUS DAS MANUFACTURERS
TABLE 4 DAS MARKET FOR INTERROGATOR UNITS, BY RANGE, 2017�2025 (USD MILLION)
TABLE 5 DAS MARKET FOR INTERROGATOR UNITS, BY RANGE, 2017�2025 (UNITS)
TABLE 6 DAS MARKET FOR SERVICES, BY TYPE, 2017�2025 (USD MILLION)
TABLE 7 DAS MARKET, BY FIBER TYPE, 2017�2025 (USD MILLION)
TABLE 8 DAS MARKET FOR SINGLE-MODE FIBERS, BY INDUSTRY, 2017�2025 (USD MILLION)
TABLE 9 SINGLE-MODE FIBER DAS MARKET FOR OIL & GAS INDUSTRY, BY APPLICATION, 2017�2025 (USD MILLION)
TABLE 10 SINGLE-MODE FIBER DAS MARKET FOR OILFIELD SERVICES, BY APPLICATION, 2017�2025 (USD MILLION)
TABLE 11 SINGLE-MODE FIBER DAS MARKET FOR PIPELINE INTEGRITY, BY APPLICATION, 2017�2025 (USD MILLION)
TABLE 12 SINGLE-MODE FIBER DAS MARKET FOR MILITARY, BY APPLICATION, 2017�2025 (USD MILLION)
TABLE 13 SINGLE-MODE FIBER DAS MARKET FOR TRANSPORTATION INDUSTRY, BY APPLICATION, 2017�2025 (USD THOUSAND)
TABLE 14 SINGLE-MODE FIBER DAS MARKET FOR OTHER INDUSTRIES, BY APPLICATION, 2017�2025 (USD MILLION)
TABLE 15 DISTRIBUTED ACOUSTIC SENSING MARKET FOR SINGLE-MODE FIBER, BY REGION, 2017�2025 (USD MILLION)
TABLE 16 DAS MARKET FOR SINGLE-MODE FIBER IN AMERICAS, BY REGION, 2017�2025 (USD MILLION)
TABLE 17 DAS MARKET FOR MULTIMODE FIBERS, BY INDUSTRY, 2017�2025 (USD THOUSAND)
TABLE 18 MULTIMODE FIBER DAS MARKET FOR OIL & GAS INDUSTRY, BY APPLICATION, 2017�2025 (USD MILLION)
TABLE 19 MULTIMODE FIBER DAS MARKET FOR OILFIELD SERVICES, BY APPLICATION, 2017�2025 (USD THOUSAND)
TABLE 20 MULTIMODE FIBER DAS MARKET FOR PIPELINE INTEGRITY, BY APPLICATION, 2017�2025 (USD THOUSAND)
TABLE 21 MULTIMODE FIBER DAS MARKET FOR MILITARY INDUSTRY, BY APPLICATION, 2017�2025 (USD THOUSAND)
TABLE 22 MULTIMODE FIBER DAS MARKET FOR TRANSPORTATION INDUSTRY, BY APPLICATION, 2017�2025 (USD THOUSAND)
TABLE 23 MULTIMODE FIBER DAS MARKET FOR OTHER INDUSTRIES, BY APPLICATION, 2017�2025 (USD THOUSAND)
TABLE 24 DAS MARKET FOR MULTIMODE FIBERS, BY REGION, 2017�2025 (USD THOUSAND)
TABLE 25 DAS MARKET FOR MULTIMODE FIBERS IN AMERICAS, BY REGION, 2017�2025 (USD THOUSAND)
TABLE 26 DAS MARKET, BY INDUSTRY, 2017�2025 (USD MILLION)
TABLE 27 DAS MARKET FOR OIL & GAS INDUSTRY, BY APPLICATION, 2017�2025 (USD MILLION)
TABLE 28 DAS MARKET FOR OIL & GAS INDUSTRY, BY REGION, 2017�2025 (USD MILLION)
TABLE 29 DAS MARKET FOR OIL & GAS INDUSTRY IN AMERICAS, BY REGION, 2017�2025 (USD MILLION)
TABLE 30 DAS MARKET FOR OIL & GAS INDUSTRY IN NORTH AMERICA, BY COUNTRY, 2017�2025 (USD THOUSAND)
TABLE 31 DAS MARKET FOR OIL & GAS INDUSTRY IN SOUTH AMERICA, BY COUNTRY, 2017�2025 (USD THOUSAND)
TABLE 32 DAS MARKET FOR OIL & GAS INDUSTRY IN EUROPE, BY COUNTRY, 2017�2025 (USD THOUSAND)
TABLE 33 DAS MARKET FOR OIL & GAS INDUSTRY IN APAC, BY COUNTRY, 2017�2025 (USD THOUSAND)
TABLE 34 DAS MARKET FOR OIL & GAS INDUSTRY IN ROW, BY REGION, 2017�2025 (USD THOUSAND)
TABLE 35 DAS MARKET FOR OILFIELD SERVICES, BY APPLICATION, 2017�2025 (USD MILLION)
TABLE 36 DAS MARKET FOR OILFIELD SERVICES, BY FIBER TYPE, 2017�2025 (USD MILLION)
TABLE 37 DAS MARKET FOR OILFIELD PRODUCTION SERVICES, BY FIBER TYPE, 2017�2025 (USD THOUSAND)
TABLE 38 DAS MARKET FOR OILFIELD COMPLETION SERVICES, BY FIBER TYPE, 2017�2025 (USD THOUSAND)
TABLE 39 DAS MARKET FOR OILFIELD EVALUATION SERVICES, BY FIBER TYPE, 2017�2025 (USD THOUSAND)
TABLE 40 DAS MARKET FOR PIPELINE INTEGRITY, BY APPLICATION, 2017�2025 (USD MILLION)
TABLE 41 DAS MARKET FOR LEAK DETECTION, BY FIBER TYPE, 2017�2025 (USD THOUSAND)
TABLE 42 DAS MARKET FOR PIPELINE PROTECTION, BY FIBER TYPE, 2017�2025 (USD MILLION)
TABLE 43 DAS MARKET FOR MILITARY INDUSTRY, BY APPLICATION, 2017�2025 (USD MILLION)
TABLE 44 DAS MARKET FOR MILITARY INDUSTRY, BY FIBER TYPE, 2017�2025 (USD THOUSAND)
TABLE 45 DAS MARKET FOR BORDER SURVEILLANCE, BY FIBER TYPE, 2017�2025 (USD THOUSAND)
TABLE 46 DAS MARKET FOR SUPPORT OPERATIONS, BY FIBER TYPE, 2017�2025 (USD THOUSAND)
TABLE 47 DISTRIBUTED ACOUSTIC SENSING MARKET FOR MILITARY INDUSTRY, BY REGION, 2017�2025 (USD THOUSAND)
TABLE 48 DAS MARKET FOR MILITARY INDUSTRY IN AMERICAS, BY REGION, 2017�2025 (USD THOUSAND)
TABLE 49 DAS MARKET FOR MILITARY INDUSTRY IN NORTH AMERICA, BY COUNTRY, 2017�2025 (USD THOUSAND)
TABLE 50 DAS MARKET FOR MILITARY INDUSTRY IN SOUTH AMERICA, BY COUNTRY, 2017�2025 (USD THOUSAND)
TABLE 51 DAS MARKET FOR MILITARY INDUSTRY IN EUROPE, BY COUNTRY, 2017�2025 (USD THOUSAND)
TABLE 52 DAS MARKET FOR MILITARY INDUSTRY IN APAC, BY COUNTRY, 2017�2025 (USD THOUSAND)
TABLE 53 DAS MARKET FOR MILITARY INDUSTRY IN ROW, BY REGION, 2017�2025 (USD THOUSAND)
TABLE 54 DAS MARKET FOR INFRASTRUCTURE INDUSTRY, BY FIBER TYPE, 2017�2025 (USD THOUSAND)
TABLE 55 DAS MARKET FOR INFRASTRUCTURE INDUSTRY, BY REGION, 2017�2025 (USD THOUSAND)
TABLE 56 DAS MARKET FOR INFRASTRUCTURE INDUSTRY IN AMERICAS, BY REGION, 2017�2025 (USD THOUSAND)
TABLE 57 DAS MARKET FOR INFRASTRUCTURE INDUSTRY IN NORTH AMERICA, BY COUNTRY, 2017�2025 (USD THOUSAND)
TABLE 58 DAS MARKET FOR INFRASTRUCTURE INDUSTRY IN SOUTH AMERICA, BY COUNTRY, 2017�2025 (USD THOUSAND)
TABLE 59 DAS MARKET FOR INFRASTRUCTURE INDUSTRY IN EUROPE, BY COUNTRY, 2017�2025 (USD THOUSAND)
TABLE 60 DAS MARKET FOR INFRASTRUCTURE INDUSTRY IN APAC, BY COUNTRY, 2017�2025 (USD THOUSAND)
TABLE 61 DAS MARKET FOR INFRASTRUCTURE INDUSTRY IN ROW, BY REGION, 2017�2025 (USD THOUSAND)
TABLE 62 DAS MARKET FOR TRANSPORTATION INDUSTRY, BY APPLICATION, 2017�2025 (USD THOUSAND)
TABLE 63 DAS MARKET FOR TRANSPORTATION INDUSTRY, BY FIBER TYPE, 2017�2025 (USD THOUSAND)
TABLE 64 DAS MARKET FOR RAIL, BY FIBER TYPE, 2017�2025 (USD THOUSAND)
TABLE 65 DAS MARKET FOR ROAD, BY FIBER TYPE, 2017�2025 (USD THOUSAND)
TABLE 66 DAS MARKET FOR TRANSPORTATION INDUSTRY, BY REGION, 2017�2025 (USD THOUSAND)
TABLE 67 DAS MARKET FOR TRANSPORTATION INDUSTRY IN AMERICAS, BY REGION, 2017�2025 (USD THOUSAND)
TABLE 68 DAS MARKET FOR TRANSPORTATION INDUSTRY IN NORTH AMERICA, BY COUNTRY, 2017�2025 (USD THOUSAND)
TABLE 69 DAS MARKET FOR TRANSPORTATION INDUSTRY IN SOUTH AMERICA, BY COUNTRY, 2017�2025 (USD THOUSAND)
TABLE 70 DAS MARKET FOR TRANSPORTATION INDUSTRY IN EUROPE, BY COUNTRY, 2017�2025 (USD THOUSAND)
TABLE 71 DAS MARKET FOR TRANSPORT INDUSTRY IN APAC, BY COUNTRY, 2017�2025 (USD THOUSAND)
TABLE 72 DAS MARKET FOR TRANSPORTATION INDUSTRY IN ROW, BY REGION, 2017�2025 (USD THOUSAND)
TABLE 73 DAS MARKET FOR OTHER INDUSTRIES, BY APPLICATION, 2017�2025 (USD MILLION)
TABLE 74 DAS MARKET FOR OTHER INDUSTRIES, BY FIBER TYPE, 2017�2025 (USD MILLION)
TABLE 75 DAS MARKET FOR UNDERWATER ASSET MANAGEMENT, BY FIBER TYPE, 2017�2025 (USD THOUSAND)
TABLE 76 DAS MARKET FOR CABLE MONITORING, BY FIBER TYPE, 2017�2025 (USD THOUSAND)
TABLE 77 DAS MARKET FOR OTHER INDUSTRIES, BY REGION, 2017�2025 (USD THOUSAND)
TABLE 78 DAS MARKET FOR OTHER INDUSTRIES IN AMERICAS, BY REGION, 2017�2025 (USD THOUSAND)
TABLE 79 DAS MARKET FOR OTHER INDUSTRIES IN NORTH AMERICA, BY COUNTRY, 2017�2025 (USD THOUSAND)
TABLE 80 DAS MARKET FOR OTHER INDUSTRIES IN SOUTH AMERICA, BY COUNTRY, 2017�2025 (USD THOUSAND)
TABLE 81 DAS MARKET FOR OTHER INDUSTRIES IN EUROPE, BY COUNTRY, 2017�2025 (USD THOUSAND)
TABLE 82 DAS MARKET FOR OTHER INDUSTRIES IN APAC, BY COUNTRY, 2017�2025 (USD THOUSAND)
TABLE 83 DISTRIBUTED ACOUSTIC SENSING MARKET FOR OTHER INDUSTRIES IN ROW, BY REGION, 2017�2025 (USD THOUSAND)
TABLE 84 DAS MARKET, BY REGION, 2017�2025 (USD MILLION)
TABLE 85 DAS MARKET IN AMERICAS, BY REGION, 2017�2025 (USD MILLION)
TABLE 86 DAS MARKET IN AMERICAS, BY INDUSTRY, 2017�2025 (USD MILLION)
TABLE 87 DAS MARKET IN AMERICAS, BY FIBER TYPE, 2017�2025 (USD MILLION)
TABLE 88 DAS MARKET IN NORTH AMERICA, BY COUNTRY, 2017�2025 (USD MILLION)
TABLE 89 DAS MARKET IN NORTH AMERICA, BY INDUSTRY, 2017�2025 (USD THOUSAND)
TABLE 90 DAS MARKET IN NORTH AMERICA, BY FIBER TYPE, 2017�2025 (USD MILLION)
TABLE 91 DAS MARKET IN SOUTH AMERICA, BY COUNTRY, 2017�2025 (USD THOUSAND)
TABLE 92 DAS MARKET IN SOUTH AMERICA, BY INDUSTRY, 2017�2025 (USD THOUSAND)
TABLE 93 DAS MARKET IN SOUTH AMERICA, BY FIBER TYPE, 2017�2025 (USD THOUSAND)
TABLE 94 DAS MARKET IN EUROPE, BY COUNTRY, 2017�2025 (USD THOUSAND)
TABLE 95 DAS MARKET IN EUROPE, BY INDUSTRY, 2017�2025 (USD THOUSAND)
TABLE 96 DAS MARKET IN EUROPE, BY FIBER TYPE, 2017�2025 (USD THOUSAND)
TABLE 97 DAS MARKET IN APAC, BY COUNTRY, 2017�2025 (USD MILLION)
TABLE 98 DAS MARKET IN APAC, BY INDUSTRY, 2017�2025 (USD MILLION)
TABLE 99 DAS MARKET IN APAC, BY FIBER TYPE, 2017�2025 (USD MILLION)
TABLE 100 DAS MARKET IN ROW, BY REGION, 2017�2025 (USD MILLION)
TABLE 101 DAS MARKET IN ROW, BY INDUSTRY, 2017�2025 (USD THOUSAND)
TABLE 102 DISTRIBUTED ACOUSTIC SENSING MARKET IN ROW, BY FIBER TYPE, 2017�2025 (USD THOUSAND)
TABLE 103 PARTNERSHIPS AND COLLABORATIONS & JOINT VENTURES, 2018�2019
TABLE 104 CONTRACTS AND AGREEMENTS, 2019
TABLE 105 PRODUCT LAUNCHES, 2018�2019
TABLE 106 EXPANSIONS, 2017�2019
TABLE 107 ACQUISITIONS, 2017
LIST OF FIGURES (47 Figures)
FIGURE 1 DISTRIBUTED ACOUSTIC SENSING MARKET SEGMENTATION
FIGURE 2 DAS MARKET: RESEARCH DESIGN
FIGURE 3 MARKET SIZE ESTIMATION METHODOLOGY: APPROACH 1 )� BOTTOM-UP (DEMAND SIDE)�DEMAND FOR INTERROGATORS
FIGURE 4 DAS MARKET: BOTTOM-UP APPROACH
FIGURE 5 MARKET SIZE ESTIMATION METHODOLOGY: APPROACH 2 (SUPPLY SIDE)�REVENUE GENERATED FROM PRODUCTS IN DAS MARKET
FIGURE 6 MARKET SIZE ESTIMATION METHODOLOGY: APPROACH 2 (SUPPLY SIDE)�ILLUSTRATION OF REVENUE ESTIMATION FOR COMPANY IN DAS MARKET
FIGURE 7 DAS MARKET: TOP-DOWN APPROACH
FIGURE 8 DATA TRIANGULATION
FIGURE 9 SCENARIOS IN TERMS OF RECOVERY OF GLOBAL ECONOMY
FIGURE 10 DAS MARKET GROWTH PROJECTION BY ADOPTING REALISTIC, OPTIMISTIC, AND PESSIMISTIC SCENARIOS
FIGURE 11 IMPACT OF COVID-19 ON DAS MARKET
FIGURE 12 HARDWARE COMPONENT HELD LARGEST SHARE OF DAS MARKET IN 2019
FIGURE 13 DAS MARKET FOR MULTIMODE FIBERS IS EXPECTED T0 GROW AT HIGHER CAGR DURING FORECAST PERIOD
FIGURE 14 DAS SYSTEMS WILL BE PRIMARILY DEPLOYED IN OIL & GAS INDUSTRY IN 2020
FIGURE 15 AMERICAS TO ACCOUNT FOR LARGEST SHARE OF DAS MARKET IN 2020
FIGURE 16 INCREASED DEPLOYMENT OF DAS SYSTEMS IN OIL & GAS INDUSTRY DUE TO DIGITIZATION TO FUEL GROWTH OF DAS MARKET DURING FORECAST PERIOD
FIGURE 17 SINGLE-MODE FIBER EXPECTED TO DOMINATE MARKET IN 2020
FIGURE 18 HARDWARE TO HOLD LARGEST SHARE OF DAS MARKET IN 2020
FIGURE 19 OIL & GAS INDUSTRY AND US TO BE LARGEST SHAREHOLDERS OF DAS MARKET IN NORTH AMERICA IN 2020
FIGURE 20 US TO HOLD LARGEST SHARE OF DAS MARKET IN 2020
FIGURE 21 EVOLUTION OF DISTRIBUTED ACOUSTIC SENSING
FIGURE 22 IMPACT OF DRIVERS AND OPPORTUNITIES ON DISTRIBUTED ACOUSTIC SENSING MARKET
FIGURE 23 IMPACT OF RESTRAINTS AND CHALLENGES ON DISTRIBUTED ACOUSTIC SENSING (DAS) MARKET
FIGURE 24 VALUE CHAIN ANALYSIS OF DAS ECOSYSTEM: R&D AND MANUFACTURING PHASES ADD MAXIMUM VALUE
FIGURE 25 HARDWARE COMPONENT EXPECTED TO CONTINUE TO HOLD LARGEST SHARE OF MARKET DURING FORECAST PERIOD
FIGURE 26 SINGLE-MODE FIBER TYPE TO HOLD LARGER SHARE OF MARKET IN 2025
FIGURE 27 SINGLE-MODE FIBER MARKET FOR OIL & GAS INDUSTRY TO GROW AT HIGHEST CAGR DURING FORECAST PERIOD
FIGURE 28 MULTIMODE FIBER DAS MARKET FOR TRANSPORTATION INDUSTRY TO GROW AT HIGHEST CAGR DURING FORECAST PERIOD
FIGURE 29 MARKET FOR OIL & GAS INDUSTRY TO GROW AT HIGHEST CAGR DURING FORECAST PERIOD
FIGURE 30 PIPELINE INTEGRITY TO HOLD LARGER SHARE OF MARKET FOR OIL & GAS INDUSTRY IN 2020
FIGURE 31 IN MILITARY, MARKET FOR SUPPORT OPERATIONS IS EXPECTED TO GROW AT HIGHER CAGR DURING FORECAST PERIOD
FIGURE 32 RAIL TRANSPORTATION IS EXPECTED TO HOLD LARGER SHARE OF MARKET FOR TRANSPORTATION INDUSTRY THROUGHOUT FORECAST PERIOD
FIGURE 33 UNDERWATER ASSET MANAGEMENT EXPECTED TO HOLD LARGER SHARE OF DAS MARKET FOR OTHER INDUSTRIES IN 2020
FIGURE 34 DAS MARKET IN APAC TO EXHIBIT SIGNIFICANT GROWTH DURING FORECAST PERIOD
FIGURE 35 AMERICAS: DAS MARKET SNAPSHOT
FIGURE 36 EUROPE: DAS MARKET SNAPSHOT
FIGURE 37 APAC: DAS MARKET SNAPSHOT
FIGURE 38 MIDDLE EAST TO HOLD LARGER SHARE OF DAS MARKET IN ROW THROUGHOUT FORECAST PERIOD
FIGURE 39 PLAYERS IN DAS MARKET ADOPTED PARTNERSHIPS, COLLABORATIONS & JOINT VENTURES, AND CONTRACTS & AGREEMENTS AS KEY STRATEGIES FOR BUSINESS EXPANSION FROM 2017 TO 2019
FIGURE 40 SCHLUMBERGER LED DAS MARKET IN 2019
FIGURE 41 DAS MARKET (GLOBAL), COMPETITIVE LEADERSHIP MAPPING, 2019
FIGURE 42 PRODUCT PORTFOLIO ANALYSIS OF TOP PLAYERS IN DISTRIBUTED ACOUSTIC SENSING (DAS) MARKET
FIGURE 43 BUSINESS STRATEGY EXCELLENCE OF TOP PLAYERS IN DISTRIBUTED ACOUSTIC SENSING MARKET
FIGURE 44 DAS MARKET WITNESSED SIGNIFICANT GROWTH FROM 2017 TO 2019
FIGURE 45 SCHLUMBERGER: COMPANY SNAPSHOT
FIGURE 46 HALLIBURTON: COMPANY SNAPSHOT
FIGURE 47 BAKER HUGHES: COMPANY SNAPSHOT
The study involved the estimation of the current size of the global distributed acoustic sensing (DAS) market. Exhaustive secondary research was carried out to collect information about the market and its peer markets. It was followed by the validation of findings, assumptions, and sizing with the industry experts across the value chain through primary research. Both top-down and bottom-up approaches were employed to estimate the complete size of the market. It was followed by the market breakdown and data triangulation methods to estimate the size of different segments and subsegments of the market.
Secondary Research
In the secondary research process, various secondary sources were referred to for identifying and collecting information pertinent to this study on the distributed acoustic sensing (DAS) market. Secondary sources included annual reports; press releases; investor presentations; white papers; journals and certified publications; and articles by recognized authors, directories, and databases. Secondary research was conducted to obtain key information about the supply chain of the industry, value chain of the market, the total pool of key players, market segmentation according to the industry trends (to the bottommost level), geographic markets, and key developments from both market- and technology-oriented perspectives.
After the complete market engineering (which included calculations for the market statistics, market breakdown, data triangulation, market size estimations, and market forecasting), extensive primary research was carried out to gather information, as well as to verify and validate the critical numbers obtained for the distributed acoustic sensing (DAS) market.
Primary Research
Extensive primary research was conducted after gaining knowledge about the current scenario of the distributed acoustic sensing (DAS) market through secondary research. Several primary interviews were conducted with the market experts from both demand (end users) and supply (equipment manufacturers and distributors) sides across 4 major regions: the Americas, Europe, Asia Pacific (APAC), and the Rest of the World (RoW). Approximately 20% and 80% of primary interviews were conducted with parties from the demand side and supply side, respectively. Primary data was collected through questionnaires, emails, and telephonic interviews.
Market Size Estimation
In the complete engineering process, both top-down and bottom-up approaches, along with several data triangulation methods, were used to estimate and validate the size of the distributed acoustic sensing (DAS) market and other dependent submarkets. Key players in the market were determined through primary and secondary research. This entire research methodology involved the study of the annual and financial reports of the top market players and extensive interviews with industry experts such as chief executive officers (CEOs), vice presidents (VPs), directors, and marketing executives for key insights (both qualitative and quantitative) about the distributed acoustic sensing (DAS) market. For every segment covered in the report (component, fiber type, industry, and geography), an analysis of COVID-19 impact on that specific segment has been done highlighting the least and most-affected subsegments. All percentage shares, splits, and breakdowns were determined using secondary sources and verified through primary sources. All the possible parameters that affect the market segments covered in this research study were accounted for, viewed in extensive detail, verified through primary research, and analyzed to get the final quantitative and qualitative data. This data was consolidated and supplemented with detailed inputs and analyses from MarketsandMarkets and presented in the report.
Data Triangulation
After arriving at the overall market size using the estimation processes explained above, the distributed acoustic sensing (DAS) market was split into several segments and subsegments. Data triangulation and market breakdown procedures were employed, wherever applicable, to complete the overall market engineering process and arrive at the exact statistics of each market segment and subsegment. The data was triangulated by studying various factors and trends from both the demand and supply sides for DAS systems.
Report Objectives
- To describe and forecast the distributed acoustic sensing (DAS) market, based on component, fiber type, and industry
- To describe and forecast the market size, for four main regions: Americas, Europe, APAC, and RoW
- To provide detailed information regarding drivers, restraints, opportunities, and challenges influencing the growth of the distributed acoustic sensing (DAS) market
- To provide an overview of the value chain pertaining to the distributed acoustic sensing (DAS) ecosystem
- To strategically analyze micromarkets with respect to individual growth trends, business prospects, and contribution to the total distributed acoustic sensing (DAS) market
- To analyze opportunities in the market for various stakeholders by identifying high-growth segments of the distributed acoustic sensing (DAS) market
Available Customizations
With the given market data, MarketsandMarkets offers customizations according to the specific requirements of companies. The following customization options are available for the distributed acoustic sensing (DAS) market report:
Product Analysis
- Product matrix that gives a detailed comparison of the product portfolio of each company
Company Information
- Detailed analysis and profiling of additional market players (up to 5)


Growth opportunities and latent adjacency in Distributed Acoustic Sensing (DAS) Market
Field of interest is distributed fiber-optic sensing (both DAS and others) Typical DAS applications have spatial resolution ~10 m. I am interested whether this report talks about short-length, high-spatial resolution distributed acoustic sensing, or only talks about tradition low-spatial resolution, long-length DAS. I am a one-owner/one-employee small business looking for market information to support my grant proposal activities. If you can offer any kind of discount for an (extremely) small business, I am curious to know what you can offer.
Transmission line sensing of temperature, galloping , PDs, and oil and gas pipelines leakage and integrity monitoring. Are these included in this report?
To understand possibility to use oil & gas industry-based solutions for system integration applications.