
Feed Pigment Market by Type (Carotenoids, Curcumin, Caramel, Spirulina & Others), Carotenoids Source (Natural & Synthetic), Livestock (Swine, Cattle, Poultry, Aquatic Animals & Others), & by Region - Global Trends & Forecasts to 2020
Market Segmentation
| Report Metrics | Details |
|
Market size available for years |
2015 - 2020 |
|
CAGR % |
3.2 |
Top 10 companies in Feed Pigment Market


[180 Pages Report] The overall feed pigment market is expected to grow from USD 917.4 million in 2015 to USD 1,071.4 million by 2020, at a CAGR of 3.2% from 2015 to 2020. Feed pigments are essential feed additives and play an important role in improving the characteristics of the feed. Apart from its primary function of giving the feed a distinct color, it also benefits the animal by strengthening the immune and reproduction systems and enhancing the metabolism level. Such feed can also contribute to auxiliary benefits to animals such as weight gain. The base year considered for the study is 2014, and the forecast has been provided for the period between 2015 and 2020.
Market Dynamics
Drivers
- Health benefits of carotenoids for animals
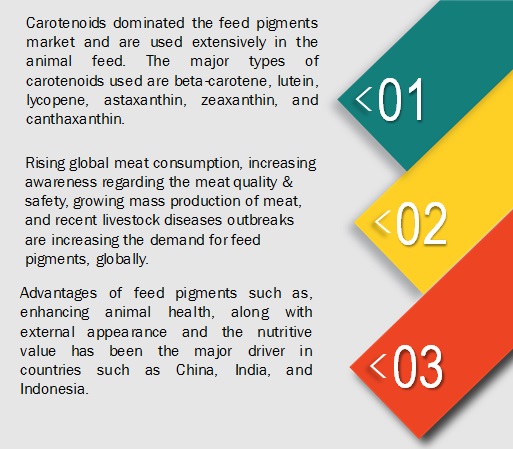
- Rising consumption of meat
- Industrialization of pork, poultry, and aquaculture businesses
- Increasing preference towards pellet feed
Restraints
- Regulatory aspects
- Rising cost of raw material
Opportunities
- Growing Asia Pacific market
- Aquaculture and feed pigments
Challenges
- Adulteration
Health benefits of carotenoids for animals drives the global feed pigment market
Feed pigments are generally used to enhance the appearance and nutritive value of animal feed. Among all the feed pigments, carotenoids play the most important role and also dominate the feed pigments market. Animals are unable to synthesize carotenoids and rely on their diet for these compounds.
Carotenoids have very high nutritional benefits and stimulate the production of white blood cells that help determine the overall immune status. They are known to act as antioxidants which can cure allergies, skin diseases, immune disorders, eye disorders, and to some extent any cardiovascular diseases present in the animals. There is an increasing awareness in the animal feed industry with regard to the health benefits of carotenoids for animals, thus driving the feed pigments market.
The following are the major objectives of the study.
- To define, segment, and project the size of the feed pigments market (in terms of value) based on type, carotenoids source, livestock, and region
- To provide detailed information about the major factors influencing the growth of the market (drivers, restraints, opportunities, and industry-specific challenges)
- To strategically analyze micromarkets with respect to individual growth trends, future prospects, and contribution to the total market
- To analyze opportunities in the market for stakeholders and details of the competitive landscape for market leaders
- To project the market size of the market, in terms of value (USD million) with respect to the five main regions�North America, Europe, Asia Pacific, Latin America and Rest of the World (RoW)
- To strategically profile the key players and comprehensively analyze their market share and core competencies
- To analyze competitive developments such as new product launches, acquisitions, investments, expansions, partnerships, agreements, joint ventures, collaborations, and product approvals in the feed pigments market
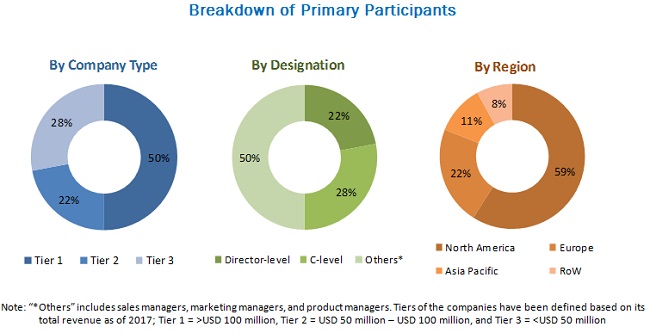
During this research study, major players operating in the feed pigment market in various regions have been identified, and their offerings, regional presence, and distribution channels have been analyzed through in-depth discussions. Top-down and bottom-up approaches have been used to determine the overall market size. Sizes of the other individual markets have been estimated using the percentage splits obtained through secondary sources such as Hoovers, Bloomberg BusinessWeek, and Factiva, along with primary respondents. The entire procedure includes the study of the annual and financial reports of the top market players and extensive interviews with industry experts such as CEOs, VPs, directors, and marketing executives for key insights (both qualitative and quantitative) pertaining to the market. The figure below shows the breakdown of the primaries on the basis of the company type, designation, and region considered during the research study.
To know about the assumptions considered for the study, download the pdf brochure
The feed pigment market comprises a network of players involved in the research and product development; raw material supply; component manufacturing; distribution and sale; and post-sales services. Key players considered in the analysis of the feed pigment market are BASF SE (Germany), Royal DSM NV (Netherlands), Kemin Industries, Inc. (US), Novus International, Inc. (US), Guangzhou Leader Bio-Technology Co., Ltd. (China), D.D. Williamson & Co., Inc. (DDW) (US), Nutrex NV (Belgium), Behn Meyer Group (Malaysia), Vitafor NV (Belgium), and Innovad AD NV/SA (Belgium).
Major Market Developments
- In November 2015, BASF SE (Germany) expanded its R&D capabilities in the Asia Pacific region by inaugurating the second phase of Innovation Campus the Asia Pacific in Shanghai (China). This expansion would help the company to develop new products focusing on new areas such as chemical processes and formulations. It will benefit the health and nutrition industry in terms of new products as well as revenue generation.
- In November 2015, Novus International, Inc., (US) acquired a methylmercaptopropanal (MMP) plant from Union Carbide Corporation (US), a subsidiary of The Dow Chemical Company (US). This acquisition would help the company to expand in the methionine market by promoting Alimet feed supplement in the US feed industry.
- In October 2015, DDW (US) opened a new manufacturing site in Louisville, US, for producing specialty colorings for prominent food & beverage companies in North America using innovative emulsion technology. The expansion would help the company to increase its revenue by supplying specialty colorings to the leading companies.
- In January 2015, Kemin Industries, Inc. (US) introduced new organic lutein, ORO GLO, for North American egg producers. This product would intensify the color of egg yolks and add lutein content.
- In January 2015, Behn Meyer Group (Malaysia) signed a partnership deed with AB Enzymes (Germany) for the distributorship of beverages, baking soda, and food & textile enzymes in Southeast Asia. It will help expand the business of the company in Southeast Asia and generate revenue.
Target Audience
- Feed pigment raw material suppliers and manufacturers
- Feed pigment importers and exporters
- Feed pigment traders and distributors
- Government and research organizations
- Associations and industry bodies such as Food and Agriculture Organization (FAO), EU Feed Additives and Pre-mixtures Association (FEFANA), European Feed Manufacturer�s Federation (FEFAC), The Compound Feed Manufacturers Association (CLMFA), Feed Ingredients & Additives Association of Australia (FIAAA), and International Feed Industry Federation (IFIF).
Report Scope
By Type :
- Carotenoids
- �-carotene
- Lutein
- Lycopene
- Astaxanthin
- Zeaxanthin
- Canthaxanthin
- Others (annato, citraxanthin, capsanthin, C-Ester, fluxoxanthin, and trans-beta-apo-8'-carotenal)
- Curcumin
- Caramel
- Spirulina
- Others (riboflavin, betalains, and vegetable black)
By Carotenoids Source
- Natural
- Synthetic
By Livestock:
- Swine
- Poultry
- Ruminants
- Aquatic animals
- Others (equines, sheep, and birds)
By Geography
- North America
- Europe
- Asia Pacific (APAC)
- Latin America
- Rest of the World (RoW)
Critical questions which the report answers
- What are new types in which the feed pigment manufacturers are exploring?
- Which are the key players in the market and how intense is the competition?
Available Customizations
Based on the given market data, MarketsandMarkets offers customizations in the reports as per the client�s specific requirements. The available customization options are as follows:
Product Analysis
- Product matrix which gives a detailed comparison of product portfolio of each company
Geographic Analysis
- Further breakdown of the Rest of Asia Pacific feed pigments market into Malaysia, Thailand, and Vietnam
Company Information
- Detailed analysis and profiling of additional market players (Up to five)
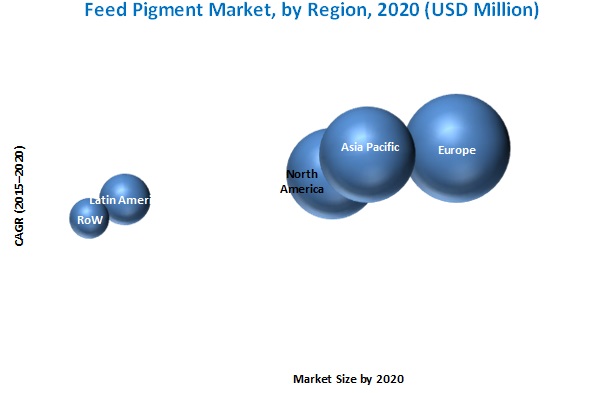
The overall feed pigment market expected to grow from USD 917.4 million in 2015 to USD 1,071.4 million by 2020, at a CAGR of 3.2% from 2015 to 2020. The market growth is driven by growing customer demand for meat products and raising awareness about the health benefits of carotenoids for animals among the livestock growers. The market is further driven by factors such as growing industrialization of pork, aquaculture, and poultry business and acknowledgment of the importance of feed pigments in fish farming. Depending upon livestock, the global market is led by the poultry segment, followed by ruminants and swine. These are used on a large scale in regions where there is extensive demand for meat and meat products.
The feed pigment market has been segmented, on the basis of type, into carotenoids, curcumin, caramel, spirulina, and others (riboflavin, betalains, and vegetable black). Among all feed pigment, carotenoids are majorly used in the feed industry. Carotenoids are added to the animal feed as nutrients, to support animal health and enhance the product quality. New forms or concentrated carotenoids are developed to help the feedstuff formulators to provide sufficient carotenoids to the animals at any given time; this contributes to the rapid growth of the market.
Europe accounted for the largest market share in 2014 for feed pigments, followed by the Asia Pacific and North America. France and Germany constituted the largest country markets in the European region in 2014. Increasing awareness about the benefits of feed pigments is leading to the growth in this region. Also, adding feed pigments is an economical option which has led to increased sales of meat products in the European market. The Asia Pacific region is projected to be the fastest-growing market with investments from several multinational manufacturers, especially in countries such as China, India, and Japan.
The demand for feed pigments is gaining more popularity as it improves the appearance of livestock and color of the meat and egg yolk produced.
Swine
The consumption of feed pigments by the swine industry is more in the European and Asia Pacific regions as these regions are the top pork producers. Feed pigments improves the microbial balance and digestibility when included in swine feed, and thus strengthens the immune system. Feed pigments also increases the intake of nutritious feed by piglets, which promotes weight gain. Thus, the quantity and quality of meat is enhanced resulting in more profits to the breeders.
With the increase in trade of pork and concerns over animal safety, the demand for feed pigments is projected to increase, so as to ensure good quality of pork/swine.
Poultry
Feed pigments provide poultry birds with enhanced nutrition, thereby increasing their growth rate. Feed pigments help in strengthening the immune system and also act as growth promoters; they help in adding nutritional value to feed.
Ruminants
Ruminants are one of the most domesticated species throughout human history and can consume many by-products, which are not of much value for human consumption. Feeding ruminants with nutritious feed is very important, as they are a prime source of milk and meat. The increase in ruminant breeding increases the demand for feed pigments in the segment. Feed pigments increase the palatability of feed and also the energy intake by the animals. Performance of the ruminant is strongly dependent on the dosage and inclusion levels of pigments in their feed.
Aquatic animals
Aquaculture is one of the fastest-growing cultures in the world's food production sector. Replicating the accurate natural color of fish is a challenge, and use of carotenoid pigments is effective in imparting wide spectrum of colors in fishes. Today, fish culture is suffering from serious losses due to various infectious diseases. The use of pesticides, antimicrobial drugs, and disinfectant for disease prevention in the aquaculture industry, growth promotion has led to the evolution of resistant strains of bacteria. Carotenoids are proven to be helpful in protection against damage caused by light and oxygen. They are responsible for the pigmentation of muscle in fish that are meant for consumption and skin in fish that are meant for fishkeeping. Presence of high levels of carotenoids makes fishes resistant to bacterial and fungal diseases. The quantity of pigment should be moderate; otherwise, it would deplete the level of oxygen, which is harmful to aquatic animals. Feed pigment, if supplemented in right quantities, would lead to the proper supply of essential nutrients.
Critical questions the report answers:
- Where will all these developments take the industry in the mid to long term?
- What are the upcoming types for feed pigments?
To speak to our analyst for a discussion on the above findings, click Speak to Analyst
The raw materials required for producing feed pigments are mainly extracted from natural sources such as seeds, roots, and plants. Depleting cultivable land and forest land has caused a negative impact on the growth of plants which are used as raw materials in feed pigments. Thus, there is a rise in the cost of extraction from these sources. The other factors such as a rise in the cost of materials, shifts in the manufacturing process, and innovations in the production process are restraining the growth of the feed pigment market.
Key players in the market include BASF SE (Germany), Royal DSM NV (Netherlands), Kemin Industries, Inc. (US), Novus International, Inc. (US), Guangzhou Leader Bio-Technology Co., Ltd. (China), D.D. Williamson & Co., Inc. (DDW) (US), Nutrex NV (Belgium), Behn Meyer Group (Malaysia), Vitafor NV (Belgium), and Innovad AD NV/SA (Belgium). These players are increasingly undertaking expansions, acquisitions, new product launches, and partnerships & collaborations to develop and introduce new products in the market.
Table of Contents
1 Introduction (Page No. - 15)
1.1 Objectives of the Study
1.2 Market Definition
1.3 Market Scope
1.3.1 Years Considered in the Report
1.4 Currency
1.5 Stakeholders
1.6 Limitations
2 Research Methodology (Page No. - 19)
2.1 Research Data
2.1.1 Secondary Data
2.1.1.1 Key Data From Secondary Sources
2.1.2 Primary Data
2.1.2.1 Key Data From Primary Sources
2.1.2.2 Key Industry Insights
2.1.2.3 Breakdown of Primary Interviews
2.2 Factor Analysis
2.2.1 Introduction
2.2.2 Demand-Side Analysis
2.2.2.1 Growing Livestock Population
2.2.2.2 Increasing Demand for Milk and Meat Products
2.2.2.3 Parent Market Analysis: Animal Feed Industry
2.3 Market Size Estimation
2.3.1 Bottom-Up Approach
2.3.2 Top-Down Approach
2.4 Market Breakdown & Data Triangulation
2.5 Research Assumptions
2.5.1 Assumptions
3 Executive Summary (Page No. - 33)
4 Premium Insights (Page No. - 38)
4.1 Attractive Opportunities in this Market
4.2 Carotenoids: Leading Segment By Type
4.3 Feed Pigments Market: 2015-2020 (USD Million)
4.4 Europe: Largest Feed Pigments Market
4.5 Carotenoids: Fastest-Growing Feed Pigments Market
4.6 Poultry: Dominating Segment in Feed Pigments Market, By Livestock
4.7 Synthetic: Largest Segment in the Feed Pigments Market, By Source
4.8 Life Cycle Analysis: By Region
5 Market Overview (Page No. - 46)
5.1 Introduction
5.2 Evolution
5.3 Market Segmentation
5.4 Market Dynamics
5.4.1 Drivers
5.4.1.1 Health Benefits of Carotenoids for Animals
5.4.1.2 Rising Consumption of Meat
5.4.1.3 Industrialization of Pork, Poultry, and Aquaculture Businesses
5.4.1.4 Increasing Preference Towards Pellet Feed
5.4.2 Restraints
5.4.2.1 Regulatory Aspects
5.4.2.2 Rising Cost of Raw Materials
5.4.3 Opportunities
5.4.3.1 Growing Asia-Pacific Market
5.4.3.2 Aquaculture and Feed Pigments
5.4.4 Challenges
5.4.4.1 Adulteration
6 Industry Trends (Page No. - 58)
6.1 Introduction
6.2 Value Chain Analysis
6.3 Supply Chain Analysis
6.3.1 Prominent Companies
6.3.2 Small & Medium Enterprises
6.3.3 End Users/Consumers
6.4 Porter�s Five Forces Analysis
6.4.1 Intensity of Competitive Rivalry
6.4.2 Bargaining Power of Suppliers
6.4.3 Bargaining Power of Buyers
6.4.4 Threat of New Entrants
6.4.5 Threat of Substitutes
7 Feed Pigments Market, By Type (Page No. - 65)
7.1 Introduction
7.2 Carotenoids
7.2.1 Beta-Carotene
7.2.2 Lutein
7.2.3 Lycopene
7.2.4 Astaxanthin
7.2.5 Zeaxanthin
7.2.6 Canthaxanthin
7.2.7 Other Carotenoids
7.3 Curcumin
7.4 Caramel
7.5 Spirulina
7.6 Other Feed Pigments
8 Feed Pigments Market, By Carotenoids Source (Page No. - 79)
8.1 Introduction
8.2 Natural Feed Pigments
8.3 Synthetic Feed Pigments
9 Feed Pigments Market, By Livestock (Page No. - 85)
9.1 Introduction
9.2 Swine
9.3 Poultry
9.4 Ruminants
9.5 Aquatic Animals
9.6 Feed Pigments for Other Livestock Types
10 Feed Pigments Market, By Region (Page No. - 94)
10.1 Introduction
10.2 North America
10.2.1 U.S.
10.2.2 Canada
10.2.3 Mexico
10.3 Europe
10.3.1 Germany
10.3.2 France
10.3.3 Italy
10.3.4 the Netherlands
10.3.5 Spain
10.3.6 Rest of Europe
10.4 Asia-Pacific
10.4.1 China
10.4.2 India
10.4.3 Japan
10.4.4 Indonesia
10.4.5 Rest of Asia-Pacific
10.5 Latin America
10.5.1 Brazil
10.5.2 Argentina
10.5.3 Rest of Latin America
10.6 Rest of the World
10.6.1 South Africa
10.6.2 Others in RoW
11 Competitive Landscape (Page No. - 139)
11.1 Overview
11.2 Competitive Situation & Trends
11.3 Expansions
11.4 Acquisitions
11.5 New Product Launches
11.6 Partnerships & Collaborations
12 Company Profiles (Page No. - 147)
(Company at A Glance, Recent Financials, Products & Services, Strategies & Insights, & Recent Developments)*
12.1 Introduction
12.2 BASF SE
12.3 Royal DSM N.V.
12.4 Kemin Industries Inc.
12.5 Novus International, Inc.
12.6 Guangzhou Leader Bio-Technology Co., Ltd
12.7 D.D. Williamson & Co., Inc.
12.8 Nutrex NV
12.9 Behn Meyer Group
12.10 Vitafor NV
12.11 Innovad AD NV/SA
*Details on Company at A Glance, Recent Financials, Products & Services, Strategies & Insights, & Recent Developments Might Not Be Captured in Case of Unlisted Companies.
13 Appendix (Page No. - 172)
13.1 Insights of Industry Experts
13.2 Discussion Guide
13.3 Company Developments
13.3.1 New Product Launches/Developments
13.3.2 Partnerships & Collaborations
13.3.3 Acquisitions
13.3.4 Expansions
13.4 Introducing RT: Real-Time Market Intelligence
13.5 Available Customizations
13.6 Related Reports
List of Tables (107 Tables)
Table 1 Per Capita Consumption of Meat
Table 2 Impact of Key Drivers on the this Market
Table 3 Approved Carotenoids for Food & Feed Industries By Different Organizations
Table 4 Impact of Key Restraints on the Feed Pigments Market
Table 5 Opportunities for Feed Pigments Market
Table 6 Challenges to this Market
Table 7 Feed Pigments Market Size, By Type, 2013�2020 (USD Million)
Table 8 Market Size, By Carotenoid Type, 2013�2020 (USD Million)
Table 9 Nature of Carotenoids
Table 10 Feed Carotenoids Market Size, By Region, 2013�2020 (USD Million)
Table 11 Feed Beta-Carotene Market Size, By Region, 2013�2020 (USD Million)
Table 12 Lutein Monograph
Table 13 Feed Lutein Market Size, By Region, 2013�2020 (USD Million)
Table 14 Feed Lycopene Market Size, By Region, 2013�2020 (USD Million)
Table 15 Astaxanthin Monograph
Table 16 Astaxanthin Market Size, By Region, 2013�2020 (USD Million)
Table 17 Feed Zeaxanthin Market Size, By Region, 2013�2020 (USD Million)
Table 18 Canthaxanthin Monograph
Table 19 Feed Canthaxanthin Market Size, By Region, 2013�2020 (USD Million)
Table 20 Other Carotenoids Market Size, By Region, 2013�2020 (USD Million)
Table 21 Feed Curcumin Market Size, By Region, 2013�2020 (USD Million)
Table 22 Feed Caramel Market Size, By Region, 2013�2020 (USD Million)
Table 23 Spirulina: Feed Pigments Market Size, By Region, 2013�2020 (USD Million)
Table 24 Other Feed Pigments Market Size, By Region, 2013�2020 (USD Million)
Table 25 Feed Pigments Market Size, By Source, 2013-2020 (USD Million)
Table 26 Natural: Feed Pigments Market Size, By Region, 2013-2020 (USD Million)
Table 27 Synthetic: Feed Pigments Market Size, By Region, 2013-2020 (USD Million)
Table 28 Feed Pigments Market Size, By Livestock, 2013�2020 (USD Million)
Table 29 Per Capita Pork Consumption, By Key Country/Region, 2013�2020 (Kg/Year)
Table 30 Swine Feed Pigments Market Size, By Region, 2013�2020 (USD Million)
Table 31 Per Capita Poultry Consumption, By Key Country/Region, 2013�2020 (Kg/Year)
Table 32 Poultry Feed Pigments Market Size, By Region, 2013�2020 (USD Million)
Table 33 Per Capita Beef Consumption, By Key Country/Region, 2013�2020 (Kg/Year)
Table 34 Ruminant Feed Pigments Market Size, By Region, 2013�2020 (USD Million)
Table 35 Per Capita Fish Consumption, By Key Country, 2013�2014 (Kg/Year)
Table 36 Aquafeed Pigments Market Size, By Region, 2013�2020 (USD Million)
Table 37 Other Livestock Feed Pigments Market Size, By Region, 2013�2020 (USD Million)
Table 38 Feed Pigments Market Size, By Region, 2013�2020 (USD Million)
Table 39 Market Size, By Region, 2013-2020 (KT)
Table 40 North America: Feed Pigments Market Size, By Country, 2013�2020 (USD Million)
Table 41 North America: Market Size, By Type, 2013�2020 (USD Million)
Table 42 North America: Market Size, By Carotenoid Type, 2013-2020 (USD Million)
Table 43 North America: Market Size, By Livestock, 2013-2020 (USD Million)
Table 44 North America: Market Size, By Carotenoids Source, 2013-2020 (USD Million)
Table 45 U.S.: Feed Pigments Market Size, By Type, 2013�2020 (USD Million)
Table 46 U.S.: Market Size, By Carotenoid Type, 2013�2020 (USD Million)
Table 47 Canada: Feed Pigments Market Size, By Type, 2013�2020 (USD Million)
Table 48 Canada: Market Size, By Carotenoid Type, 2013�2020 (USD Million)
Table 49 Mexico: Feed Pigments Market Size, By Type, 2013�2020 (USD Million)
Table 50 Mexico: Market Size, By Carotenoid Type, 2013�2020 (USD Million)
Table 51 Europe: Feed Pigments Market Size, By Country, 2013�2020 (USD Million)
Table 52 Europe: Market Size, By Type, 2013�2020 (USD Million)
Table 53 Europe: Market Size, By Carotenoid Type, 2013-2020 (USD Million)
Table 54 Europe: Market Size, By Livestock, 2013-2020 (USD Million)
Table 55 Europe: Market Size, By Source, 2013-2020 (USD Million)
Table 56 Germany: Feed Pigments Market Size, By Type, 2013�2020 (USD Million)
Table 57 Germany: Market Size, By Carotenoid Type, 2013�2020 (USD Million)
Table 58 France: Feed Pigments Market Size, By Type, 2013�2020 (USD Million)
Table 59 France: Market Size, By Carotenoid Type, 2013-2020 (USD Million)
Table 60 Italy: Feed Pigments Market Size, By Type, 2013�2020 (USD Million)
Table 61 Italy: Market Size, By Carotenoid Type, 2013�2020 (USD Million)
Table 62 The Netherlands: Feed Pigments Market Size, By Type, 2013�2020 (USD Million)
Table 63 The Netherlands: Market Size, By Carotenoid Type, 2013�2020 (USD Million)
Table 64 Spain: Feed Pigments Market Size, By Type, 2013�2020 (USD Million)
Table 65 Spain: Market Size, By Carotenoid Type, 2013�2020 (USD Million)
Table 66 Rest of Europe: Feed Pigments Market Size, By Type, 2013�2020 (USD Million)
Table 67 Rest of Europe: Market Size, By Carotenoid Type, 2013�2020 (USD Million)
Table 68 Asia-Pacific: Feed Pigments Market Size, By Country, 2013�2020 (USD Million)
Table 69 Asia-Pacific: Market Size, By Type, 2013�2020 (USD Million)
Table 70 Asia-Pacific: Market Size, By Carotenoid Type, 2013�2020 (USD Million)
Table 71 Asia-Pacific: Market Size, By Livestock, 2013�2020 (USD Million)
Table 72 Asia-Pacific: Market Size, By Source, 2013�2020 (USD Million)
Table 73 China: Feed Pigments Market Size, By Type, 2013�2020 (USD Million)
Table 74 China: Market Size, By Carotenoid Type, 2013�2020 (USD Million)
Table 75 India: Feed Pigments Market Size, By Type, 2013�2020 (USD Million)
Table 76 India: Market Size, By Carotenoid Type, 2013�2020 (USD Million)
Table 77 Japan: Feed Pigments Market Size, By Type, 2013�2020 (USD Million)
Table 78 Japan: Market Size, By Carotenoid Type, 2013�2020 (USD Million)
Table 79 Indonesia: Feed Pigments Market Size, By Type, 2013�2020 (USD Million)
Table 80 Indonesia: Market Size, By Carotenoid Type, 2013�2020 (USD Million)
Table 81 Rest of Asia-Pacific: Feed Pigments Market Size, By Type, 2013�2020 (USD Million)
Table 82 Rest of Asia-Pacific: Market Size, By Carotenoid Type, 2013�2020 (USD Million)
Table 83 Latin America: Feed Pigments Market Size, By Region, 2013�2020 (USD Million)
Table 84 Latin America: Market Size, By Type, 2013�2020 (USD Million)
Table 85 Latin America: Market Size, By Carotenoid Type, 2013�2020 (USD Million)
Table 86 Latin America: Market Size, By Livestock, 2013�2020 (USD Million)
Table 87 Latin America: Market Size, By Source, 2013�2020 (USD Million)
Table 88 Brazil: Feed Pigments Market Size, By Type, 2013�2020 (USD Million)
Table 89 Brazil: Market Size, By Carotenoid Type, 2013�2020 (USD Million)
Table 90 Argentina: Feed Pigments Market Size, By Type, 2013�2020 (USD Million)
Table 91 Argentina: Market Size, By Carotenoid Type, 2013�2020 (USD Million)
Table 92 Rest of Latin America: Feed Pigments Market Size, By Type, 2013�2020 (USD Million)
Table 93 Rest of Latin America: Market Size, By Carotenoid Type, 2013�2020 (USD Million)
Table 94 RoW: Feed Pigments Market Size, By Region, 2013�2020 (USD Million)
Table 95 RoW: Market Size, By Type, 2013�2020 (USD Million)
Table 96 RoW: Market Size, By Carotenoid Type, 2013�2020 (USD Million)
Table 97 RoW: Market Size, By Livestock, 2013�2020 (USD Million)
Table 98 RoW: Market Size, By Source, 2013�2020 (USD Million)
Table 99 South Africa: Feed Pigments Market Size, By Type, 2013�2020 (USD Million)
Table 100 South Africa: Market Size, By Carotenoid Type, 2013�2020 (USD Million)
Table 101 Others in RoW: Feed Pigments Market Size, By Type, 2013�2020 (USD Million)
Table 102 Rest of RoW: Market Size, By Carotenoid Type, 2013�2020 (USD Million)
Table 103 Expansions, 2014-2015
Table 104 Acquisitions, 2013-2015
Table 105 New Product Launches, 2012-2015
Table 106 Partnerships and Collaborations, 2012-2015
Table 107 Vitafor NV: Feed Pigment Products
List of Figures (46 Figures)
Figure 1 Market Segmentation
Figure 2 Research Design
Figure 3 Global Ruminants Population, 2000-2013, Billion Heads
Figure 4 Per Capita Consumption of Livestock Products
Figure 5 Feed Production Share By Livestock Type (Million Tons), 2014
Figure 6 Feed Consumption Share, By Livestock Type (Million Tons), 2014
Figure 7 Market Size Estimation Methodology: Bottom-Up Approach
Figure 8 Market Size Estimation Methodology: Top-Down Approach
Figure 9 Data Triangulation
Figure 10 Poultry to Be the Fastest Growing Segment in Feed Pigments Market,2015-2020 (USD Million)
Figure 11 Feed Pigments Market Size, By Region, 2015�2020 (USD Million)
Figure 12 Market Size, By Type, 2015�2020 (USD Million)
Figure 13 Market Share (Value), By Region, 2014
Figure 14 Strong Growth Potential for Feed Pigments Market, 2015-2020 (USD Million)
Figure 15 Carotenoids Projected to Be the Largest and Fastest- Growing Segment
Figure 16 U.S.: Largest Market for Estimated to Be the Largest Market During the Forecast Period.
Figure 17 Carotenoids Segment Accounted for Largest Share in the European Feed Pigments Market, 2014
Figure 18 Astaxanthin Segment Accounted for Largest Share in the Carotenoids Feed Pigments Market, 2014
Figure 19 Poultry Segment Accounted for Largest Share in the Feed Pigments Market, 2014
Figure 20 Synthetic Segment Accounts for the Largest Share in the Feed Pigments Market, 2014
Figure 21 Asia-Pacific to Provide Immense Opportunities for this Market Growth
Figure 22 Development of Feed Pigments Market
Figure 23 Industrialization of Pork, Poultry & Aquaculture Business is Driving the Growth of this Market
Figure 24 Global Feed Market, 2014
Figure 25 R&D Contributes Major Value to Overall Price of Feed Pigments Market
Figure 26 Research Organizations & Technologists: Integral Part of Supply Chain of Feed Pigments Market
Figure 27 Porter�s Five Forces Analysis: Feed Pigments Market
Figure 28 Carotenoids to Be Fastest-Growing Feed Pigments Market
Figure 29 Synthetic Feed Pigments to Be Fastest Growing Segment
Figure 30 Europe is Projected to Lead the Feed Pigments Market in 2020
Figure 31 Europe is Projected to Lead the Synthetic Feed Pigments Market By 2020
Figure 32 Feed Pigments Market Size, By Livestock, 2014 vs 2020 (USD Million)
Figure 33 Geographic Snapshot (2015�2020): Rapidly Growing Markets are Emerging as New Hotspots
Figure 34 European Feed Pigments Market: A Snapshot
Figure 35 Asia-Pacific Feed Pigments Market: A Snapshot
Figure 36 Acquisitions & Expansions: Most Preferred Approach of Key Companies
Figure 37 Expanding Revenue Base Through Business Expansions 2014-2015
Figure 38 Expansion: the Key Strategy, 2010-2015
Figure 39 Geographical Revenue Mix of Top 5 Market Players
Figure 40 BASF SE: Company Snapshot
Figure 41 BASF SE: SWOT Analysis
Figure 42 Royal DSM: Company Snapshot
Figure 43 Royal DSM N.V.: SWOT Analysis
Figure 44 Kemin Industries Inc.: SWOT Analysis
Figure 45 Novus International, Inc.: SWOT Analysis
Figure 46 Guangzhou Leader Bio-Technology Co., Ltd: SWOT Analysis


Growth opportunities and latent adjacency in Feed Pigment Market