
Food Automation Market by Type (Motor Controls, Discrete controllers & visualization, rotary & linear products), Function (Palletizing, Sorting & Grading, Picking & Placing, Processing), Application (Dairy, Bakery), and Region - Global Forecast to 2022
Market Segmentation
| Report Metrics | Details |
|
Market size available for years |
2017 - 2022 |
|
CAGR % |
6.9 |
Top 10 companies in Food Automation Market
Food Automation Market News


[153 Pages Report] The food automation market was valued at USD 8.22 Billion in 2016. It is projected to grow at a CAGR of 6.90% from 2017, to reach 12.26 Billion by 2022. The base year considered for this study is 2016 and the forecast period is from 2017 to 2022. The objectives of the study are to define, segment, and measure the size of the market with respect to type, application, function, and region. The report also aims to provide detailed information about the crucial factors influencing the growth of the market, strategical analysis of micromarkets, opportunities for stakeholders, details of the competitive landscape, and profile of the key players with respect to their market share and competencies.
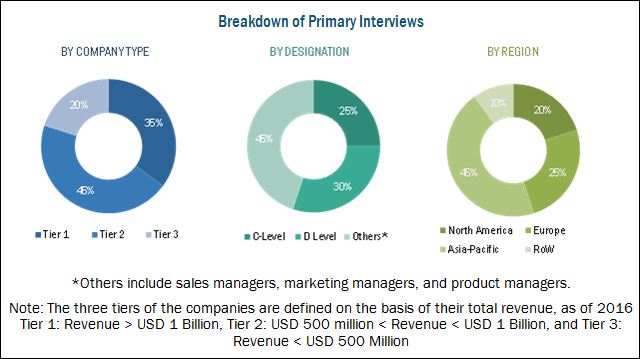
This report includes estimations of the market size in terms of value (USD million). Both, top-down and bottom-up approaches have been used to estimate and validate the size of the global food automation market and to estimate the size of various other dependent submarkets in the overall market. Key players in the market have been identified through secondary research; some of the sources are press releases, annual reports, and financial journals, and paid databases such as Factiva and Bloomberg. All percentage shares, splits, and breakdowns have been determined using secondary sources and verified through primary sources. The figure below shows the breakdown of profiles of industry experts that participated in the primary discussions.
To know about the assumptions considered for the study, download the pdf brochure
The key players in this market include Rockwell Automation, Inc. (U.S.), Siemens AG (Germany), ABB Ltd (Switzerland), Mitsubishi Electric Corporation (Japan), and Schneider Electric SE (France). Other players include Yokogawa Electric Corporation (Japan), GEA Group (Germany), Fortive Corporation (U.S.), Yaskawa Electric Corporation (Japan), Rexnord Corporation (U.S.), Emerson Electric Co. (U.S.), and Nord Drivesystems (Germany).
This report is targeted at the existing players in the industry, which are as follows:
- Food automation manufacturers, suppliers, and formulators
- Food automation product traders, suppliers, and distributors
- Professional food automation providers, associations, and industry bodies
- Research and development organizations
- Government authorities and agencies related to public health, environment, and agriculture
�The study answers several questions for stakeholders, primarily which market segments to focus on in the next two to five years for prioritizing efforts and investments.�
Get online access to the report on the World's First Market Intelligence Cloud
Request Sample Scope of the Report

The food automation market has been segmented as follows:
On the basis of Type,
- Motors & generators
- Motor controls
- Discrete controllers & visualization
- Rotary products
- Linear products
- Others
On the basis of Application,
- Dairy
- Bakery
- Confectionery
- Fruit & vegetable
- Meat, poultry, and seafood
- Beverages
On the basis of Function,
- Processing
- Packaging & Repackaging
- Palletizing
- Sorting & Grading
- Picking & Placing
- Others
On the basis of Region,
- North America
- Europe
- Asia-Pacific
- Rest of the World (RoW)
Available Customizations
With the given market data, MarketsandMarkets offers customizations according to the company�s specific scientific needs.
The following customization options are available for the report:
Segment Analysis
- Product matrix, which gives a detailed comparison of the product portfolio of each company
- Detailed analysis at volume level can also be provided
Geographic Analysis
- Further breakdown of the Rest of Europe food automation market into Russia, Denmark, Turkey, the Netherlands, Switzerland, Sweden, Belgium, and Norway.
- Further breakdown of the Rest of Asia-Pacific food automation market into Vietnam, Indonesia, Singapore, Thailand, and New Zealand.
- Further breakdown of other countries in the Rest of the World food automation market into South America, Africa, and the Middle East.
Company Information
- Detailed analyses and profiling of additional market players (up to five)
The food automation market is projected to grow at a CAGR of 6.90% from 2017, to reach a projected value of USD 12.26 Billion by 2022. The growth of this market can be attributed to the inclination of consumers towards processed and ready to eat foods, technological advancements in automation and stringent international food safety regulations.
The motors & generators segment, on the basis of various types, accounted for the largest market share in 2016. The motors & generators segment is mainly driven by their multi-functional nature. The increasing significance of motors in motion control applications involving high-pressure wash-down and high torque applications with precise motion control has greatly enhanced their functionality. Smooth and efficient functioning of systems is promoted by using generators in the food industry. It is also coupled with the increasing awareness about the efficient energy management benefits of generators. The discrete controllers & visualization segment, on the basis of type, accounted for the second highest market share in 2016 owing to its comprehensive nature to offer integrated and flexible production options to manufacturers.
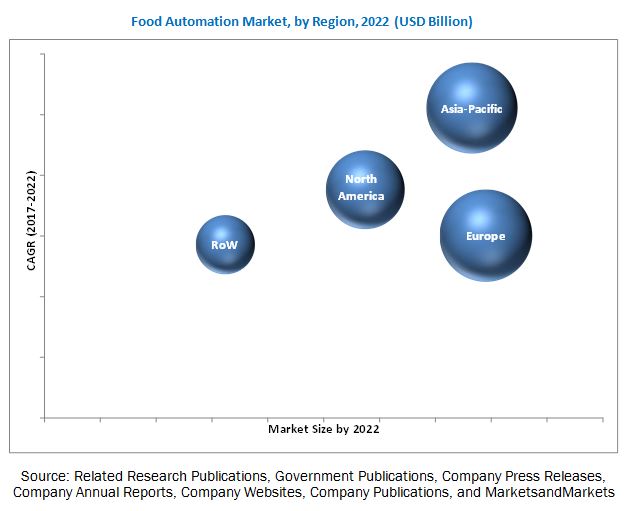
Europe accounted for the largest market share in 2016 and can be attributed due to the processed food market in Western Europe, which is well-established owing to which it is expected to witness steady growth during the forecast period. Furthermore, developing regions, such as Eastern Europe, are expected to witness significant growth in the processed food & beverage market, which positively impacts the equipment sector and boosts the market growth. Asia-Pacific is projected to be the fastest-growing region from 2017 to 2022 due to its large market base for the food & beverage industry; the improved standard of living due to the rise in income levels, and growing number of manufacturers in the region. The food & beverage market in the Asia-Pacific region is currently undergoing a transformation in response to rapid urbanization, diet diversification, and the liberalization of foreign direct investment in the food sector.
Big players in the food & beverage industry are investing in the food automation whereas small- or medium-sized (SME) companies have been much slower in incorporating automation. The high variability of food products, complexity of food processes, and requirement of high investments, limit the use of automation/robots in the food industry. On the other hand, one of the greatest difficulties the food processing industry faces is addressing the skills gap, such as finding enough skilled engineers to operate and maintain the machines. Large investments in R&D activities, laboratories, and research equipment, and hiring trained professionals also pose a barrier for this market.
The food automation market is dominated by key players such as include the Rockwell Automation, Inc. (U.S.), Siemens AG (Germany), ABB Ltd (Switzerland), Mitsubishi Electric Corporation (Japan), and Schneider Electric SE (France). Other players include Yokogawa Electric Corporation (Japan), GEA Group (Germany), Fortive Corporation (U.S.), Yaskawa Electric Corporation (Japan), Rexnord Corporation (U.S.), Emerson Electric Co. (U.S.) and Nord Drivesystems (Germany). The key players have adopted strategic developments such as new product launches, acquisitions, expansions, partnerships, and agreements in order to explore the market in new geographies.
To speak to our analyst for a discussion on the above findings, click Speak to Analyst
Table of Contents
1 Introduction (Page No. - 14)
1.1 Objectives of the Study
1.2 Market Definition
1.3 Market Scope
1.4 Periodization
1.5 Currency
1.6 Stakeholders
2 Research Methodology (Page No. - 18)
2.1 Research Data
2.1.1 Secondary Data
2.1.1.1 Key Data From Secondary Sources
2.1.2 Primary Data
2.1.2.1 Key Data From Primary Sources
2.1.2.2 Key Industry Insights
2.1.2.3 Breakdown of Primaries
2.2 Market Size Estimation
2.3 Market Breakdown & Data Triangulation
2.4 Research Assumptions & Limitations
2.4.1 Assumptions
2.4.2 Limitations
3 Executive Summary (Page No. - 28)
4 Premium Insights (Page No. - 32)
4.1 Attractive Opportunities in the Food Automation Market
4.2 Asia-Pacific: Market for Food Automation, By Country and Application
4.3 Market for Food Automation, By Country
4.4 Life Cycle Analysis, By Region
5 Market Overview (Page No. - 36)
5.1 Introduction
5.2 Macro Indicators
5.2.1 Growth of the Global Food & Beverage Industry
5.2.2 Increasing Per Capita Food Consumption
5.3 Market Dynamics
5.3.1 Drivers
5.3.1.1 Technological Advancements in Automation
5.3.1.2 Stringent International Food Safety Regulations
5.3.2 Restraints
5.3.2.1 High Capital Investment Requirement
5.3.3 Opportunities
5.3.3.1 Demand for Advanced Machinery With High Productivity and Efficiency
5.3.4 Challenges
5.3.4.1 Difficulty in Training and Managing Labor
5.4 Value Chain Analysis
5.5 Regulatory Environment
6 Market for Food Automation, By Type (Page No. - 45)
6.1 Introduction
6.2 Motors & Generators
6.3 Motor Controls
6.4 Discrete Controller Systems & Visualization
6.5 Rotary & Linear Products
6.6 Others
7 Market for Food Automation, By Function (Page No. - 51)
7.1 Introduction
7.2 Packaging & Re-Packaging
7.3 Palletizing
7.4 Sorting & Grading
7.5 Picking & Placing
7.6 Processing
7.7 Other Functions
8 Market for Food Automation, By Application (Page No. - 57)
8.1 Introduction
8.2 Dairy
8.3 Bakery
8.4 Beverage
8.5 Confectionery
8.6 Fruits & Vegetables
8.7 Meat, Poultry, and Seafood
8.8 Others
9 Market for Food Automation, By Region (Page No. - 64)
9.1 Introduction
9.2 North America
9.2.1 U.S.
9.2.2 Canada
9.2.3 Mexico
9.3 Europe
9.3.1 Germany
9.3.2 France
9.3.3 Italy
9.3.4 U.K.
9.3.5 Spain
9.3.6 Rest of Europe
9.4 Asia-Pacific
9.4.1 China
9.4.2 Japan
9.4.3 Australia
9.4.4 South Korea
9.4.5 Taiwan
9.4.6 India
9.4.7 Rest of Asia-Pacific
9.5 Rest of the World (RoW)
9.5.1 South America
9.5.1.1 Brazil
9.5.1.2 Argentina
9.5.2 Africa
9.5.3 Middle East
10 Competitive Landscape (Page No. - 95)
10.1 Introduction
10.2 Competitive Leadership Mapping
10.2.1 Visionary Leaders
10.2.2 Innovators
10.2.3 Dynamic Differentiators
10.2.4 Emerging Companies
10.3 Competitive Benchmarking
10.3.1 Strength of Product Portfolio (For 25 Players)
10.3.2 Business Strategy Excellence (For 25 Players)
*Top 25 Companies Analyzed for This Study are � Mitsubishi Electric Corporation (Japan), ABB Ltd (Switzerland), Rockwell Automation, Inc. (U.S.), Siemens AG (Germany), Yokogawa Electric Corporation (Japan), Schneider Electric SE (France), GEA Group (Germany), Fortive Corporation (U.S.), Yaskawa Electric Corporation (Japan), Rexnord Corporation (U.S.), Emerson Electric Co. (U.S.), Nord Drivesystems (Germany), Horner Apg, LLC. (Hs Motion Group) (U.S.), Scandinova Systems Ab (Sweden), Festo AG & Co. Kg (Germany), Eaton Corporation PLC (Ireland), Ametek Inc. (U.S.), Tetra Laval International Sa (Switzerland), Copa-Data GmbH (Austria), Frontmatec (Denmark), Proleit AG (Germany), Hollysys Automation Technologies Ltd. (China), Elwood Corporation (U.S.), Keb Automation Kg (Germany), St�ber Antriebstechnik GmbH & Co. Kg (Germany)
10.4 Ranking Analysis
11 Company Profiles (Page No. - 101)
(Company Overview, Strength of Product Portfolio, Product Offerings, Business Strategy Excellence, Recent Developments)*
11.1 Mitsubishi Electric Corporation
11.2 ABB Ltd
11.3 Rockwell Automation, Inc.
11.4 Siemens AG
11.5 Yokogawa Electric Corporation
11.6 Schneider Electric SE
11.7 GEA Group
11.8 Fortive Corporation
11.9 Yaskawa Electric Corporation
11.10 Rexnord Corporation
11.11 Emerson Electric Co.
11.12 Nord Drivesystems
*Details on Company Overview, Strength of Product Portfolio, Product Offerings, Business Strategy Excellence, Recent Developments Might Not Be Captured in Case of Unlisted Companies.
12 Appendix (Page No. - 144)
12.1 Key Industry Insights
12.2 Discussion Guide
12.3 Knowledge Store: Marketsandmarkets� Subscription Portal
12.4 Introducing RT: Real-Time Market Intelligence
12.5 Available Customizations
12.6 Related Reports
12.7 Author Details
List of Tables (60 Tables)
Table 1 Food Automation Market Size, By Type, 2015�2022 (USD Million)
Table 2 Motors & Generators Market Size, By Region, 2015�2022 (USD Million)
Table 3 Motor Controls Market Size, By Region, 2015�2022 (USD Million)
Table 4 Discrete Controllers & Visualization Market Size, By Region, 2015�2022 (USD Million)
Table 5 Rotary Products Market Size, By Region, 2015�2022 (USD Million)
Table 6 Linear Products Market Size, By Region, 2015�2022 (USD Million)
Table 7 Market Size for Food Automation for Other Types, By Region, 2015�2022 (USD Million)
Table 8 Market Size for Food Automation, By Function, 2015�2022 (USD Million)
Table 9 Packaging & Re-Packaging: Market Size for Food Automation, By Region, 2015�2022 (USD Million)
Table 10 Palletizing: Market Size for Food Automation, By Region, 2015�2022 (USD Million)
Table 11 Sorting & Grading: Market Size, By Region, 2015�2022 (USD Million)
Table 12 Picking & Placing: Market Size for Food Automation, By Region, 2015�2022 (USD Million)
Table 13 Processing: Market Size, By Region, 2015�2022 (USD Million)
Table 14 Other Functions: Market Size for Food Automation, By Region, 2015�2022 (USD Million)
Table 15 Market Size for Food Automation, By Application, 2015�2022 (USD Million)
Table 16 Market Size for Food Automation in Dairy, By Region, 2015�2022 (USD Million)
Table 17 Market Size in Bakery, By Region, 2015�2022 (USD Million)
Table 18 Market Size in Beverage, By Region, 2015�2022 (USD Million)
Table 19 Market Size in Confectionery, By Region, 2015�2022 (USD Million)
Table 20 Market Size in Fruits & Vegetables, By Region, 2015�2022 (USD Million)
Table 21 Market Size in Meat, Poultry, and Seafood, By Region, 2015�2022 (USD Million)
Table 22 Market Size in Other Applications, By Region, 2015�2022 (USD Million)
Table 23 Market Size, By Region, 2015�2022 (USD Million)
Table 24 North America: Food Automation Market Size, By Country, 2015�2022 (USD Million)
Table 25 North America: Market Size, By Type, 2015�2022 (USD Million)
Table 26 North America: Market Size, By Function, 2015�2022 (USD Million)
Table 27 North America: Market Size, By Application, 2015�2022 (USD Million)
Table 28 U.S.: Market Size for Food Automation, By Function, 2015�2022 (USD Million)
Table 29 Canada: Market Size, By Function, 2015�2022 (USD Million)
Table 30 Mexico: Market Size for Food Automation, By Function, 2015�2022 (USD Million)
Table 31 Europe: Market Size for Food Automation, By Country, 2015�2022 (USD Million)
Table 32 Europe: Market Size, By Type, 2015�2022 (USD Million)
Table 33 Europe: Market Size, By Function, 2015�2022 (USD Million)
Table 34 Europe: Market Size, By Application, 2015�2022 (USD Million)
Table 35 Germany: Market Size for Food Automation, By Function, 2015�2022 (USD Million)
Table 36 France: Market Size for Food Automation, By Function, 2015�2022 (USD Million)
Table 37 Italy: Market Size for Food Automation, By Function, 2015�2022 (USD Million)
Table 38 U.K.: Market Size for Food Automation, By Function, 2015�2022 (USD Million)
Table 39 Spain: Market Size for Food Automation, By Function, 2015�2022 (USD Million)
Table 40 Rest of Europe: Market Size, By Function, 2015�2022 (USD Million)
Table 41 Asia-Pacific: Food Automation Market Size, By Country, 2015�2022 (USD Million)
Table 42 Asia-Pacific: Market Size, By Type, 2015�2022 (USD Million)
Table 43 Asia-Pacific: Market Size, By Function, 2015�2022 (USD Million)
Table 44 Asia-Pacific: Market Size, By Application, 2015�2022 (USD Million)
Table 45 China: Market Size for Food Automation, By Function, 2015�2022 (USD Million)
Table 46 Japan: Market Size for Food Automation, By Function, 2015�2022 (USD Million)
Table 47 Australia: Market Size for Food Automation, By Function, 2015�2022 (USD Million)
Table 48 South Korea: Market Size for Food Automation, By Function, 2015�2022 (USD Million)
Table 49 Taiwan: Market Size for Food Automation, By Function, 2015�2022 (USD Million)
Table 50 India: Market Size for Food Automation, By Function, 2015�2022 (USD Million)
Table 51 Rest of Asia-Pacific: Market Size, By Function, 2015�2022 (USD Million)
Table 52 RoW: Market Size for Food Automation, By Region, 2015�2022 (USD Million)
Table 53 RoW: Market Size, By Type, 2015�2022 (USD Million)
Table 54 RoW: Market Size, By Function, 2015�2022 (USD Million)
Table 55 RoW: Market Size, By Application, 2015�2022 (USD Million)
Table 56 South America: Market Size for Food Automation, By Function, 2015�2022 (USD Million)
Table 57 Brazil: Market Size for Food Automation, By Function, 2015�2022 (USD Million)
Table 58 Argentina: Market Size for Food Automation, By Function, 2015�2022 (USD Million)
Table 59 Africa: Market Size, By Function, 2015�2022 (USD Million)
Table 60 Middle East: Food Automation Market Size, By Function, 2015�2022 (USD Million)
List of Figures (35 Figures)
Figure 1 Market Segmentation
Figure 2 Regional Scope
Figure 3 Food Automation Market: Research Design
Figure 4 Food Automation Market: Breakdown of Primary Interviews
Figure 5 Market Size Estimation Methodology: Bottom-Up Approach
Figure 6 Market Size Estimation Methodology: Top-Down Approach
Figure 7 Data Triangulation Methodology
Figure 8 Discrete Controllers and Visualization Projected to Be the Fastest-Growing Segment During the Forecast Period
Figure 9 Palletizing is Projected to Account for the Largest Share During the Forecast Period
Figure 10 Demand for Automation is Projected to Be the Highest in Beverage Through 2022
Figure 11 Europe Was the Largest Market in 2016
Figure 12 Technological Advancements and Stringent Food Regulations are Expected to Drive Growth in the Market
Figure 13 Beverage Segment Accounted for the Largest Share in the Asia-Pacific Market in 2016
Figure 14 South Korea is Projected to Grow at the Highest Rate From 2017 to 2022
Figure 15 Food Automation Market is Projected to Experience Strong Growth in the Asia-Pacific Region
Figure 16 Global Food, Beverage, and Tobacco Industries, 2006�2015 (USD Billion)
Figure 17 Global Per Capita Food Consumption Across Regions (Kcal Per Capita Per Day)
Figure 18 Market Dynamics: Food Automation
Figure 19 Value Chain of Food Automation
Figure 20 Geographic Snapshot (2017�2022): Rapidly Growing Markets are Emerging as New Hotspots
Figure 21 U.S. Was the Largest Market for Food Automation in North America
Figure 22 Germany Held the Largest Market Share for Food Automation in Europe in 2016
Figure 23 China Held the Largest Share in the Asia-Pacific Food Automation Market
Figure 24 Global Food Automation Market: Competitive Leadership Mapping, 2017
Figure 25 Mitsubishi Electric Corporation: Company Snapshot
Figure 26 ABB Ltd: Company Snapshot
Figure 27 Rockwell Automation, Inc.: Company Snapshot
Figure 28 Siemens AG: Company Snapshot
Figure 29 Yokogawa Electric Corporation: Company Snapshot
Figure 30 Schneider Electric SE: Company Snapshot
Figure 31 GEA Group: Company Snapshot
Figure 32 Fortive Corporation: Company Snapshot
Figure 33 Yaskawa Electric Corporation: Company Snapshot
Figure 34 Rexnord Corporation: Company Snapshot
Figure 35 Emerson Electric Co.: Company Snapshot


Growth opportunities and latent adjacency in Food Automation Market