Formic Acid Market by Types (Grades of 85%, 94%, 99%, and others) by Application (Agriculture, Leather & Textile, Rubber, Chemical & Pharmaceuticals, & others) & by Geography - Global Trends, Forecasts to 2019


The formic acid market, along with its end products, has witnessed a linear growth in the past few years and this growth is estimated to increase in the coming years. Formic acid is one of the basic organic chemical raw materials widely used in pesticide, leather, dyes, pharmaceuticals and rubber industries. The high quality and environmental acceptability are some of the major features creating an upsurge in the demand in the industry. The upcoming safety regulations for the use of these products will be the key influencing factors for the global market with the increased emphasis on the different types of products and their varied applications.
The formic acid market is experiencing enormous growth which is expected to continue in the near future, mainly driven by the highly growing Asia-Pacific, Europe and North America. Considerable amount of investments are made by some major players to serve the end-user applications industry in the future. The Asia-Pacific region is the major consumer in the market and have accounted for about 47% market share with respect to volume in 2012. The region is further expected to show a high growth in the future, mainly due to the high growth potential of the agriculture market in China and India.
Almost 45% of the total formic acid demand was for the silage preservation, animal feed, and other agriculture applications in 2012, with the leather & textile and rubber industry also being the fastest growing end-use segments, primarily due to high penetration of leather and textiles in all the regions.
The drivers of the industry are: Emphasis on health and environment, ban of antibiotics as growth promoter in silage preservation and animal feed, and the increasing penetration with emerging application.
The study basically aims to estimate the market for 2014 and is projected up to 2019. This market research study provides a detailed qualitative and quantitative analysis of the formic acid market. We have used various secondary sources such as encyclopedia, directories, industry journals, and databases to identify and collect information useful for this extensive commercial study of the market. The primary sources � experts from related industries and suppliers - have been interviewed to obtain and verify critical information as well as to assess the future prospects of the industry.
Competitive scenarios of the top players in the market have been discussed in detail. We have also profiled leading players of this industry with their recent developments and other strategic industry activities. These include: key formic acid manufacturers such as BASF SE (Germany), Perstorp AB (Sweden), Feicheng Acid Chemicals Co. Ltd. (China), Gujarat Narmada Valley Fertilizers Co. Ltd. (India), Taminco Corporation (Belgium), and others.
Get online access to the report on the World's First Market Intelligence Cloud
Request Sample Scope of the Report
:

This research report categorizes the global market for formic acid on the basis of applications, end-user industries, and geography along with forecasting volume, value, and analyzing trends in each of the submarkets.
On the basis of types:
- Grade 85%
- Grade 94%
- Grade 99%
- Others
On the basis of applications:
- Agriculture
- Leather & Textile
- Rubber
- Chemical & Pharmaceutical
- Others
Each application is described in detail in the report with volume and revenue forecasts for each application.
On the basis of geography:
- Asia-Pacific
- North America
- Europe
- ROW
The market is further analyzed for key countries in each of these regions.
The formic acid market is estimated to be 762,123.8 thousand tons by volume by 2019 signifying a firm annualized growth rate of over 3.8% from 2014 to 2019.
The global formic acid market, along with its end products, witnessed a significant growth in the past few years and this growth is estimated to continue in the coming years. Quality, readily degradable nature & effective substitute to other acids, an upsurge in the demand for these products and innovative techniques developed for its use will be the key influencing factors for the global market with the increased emphasis on its different types and their applications.
Currently, the Asia-Pacific region is the largest consumer in the industry. Among all the countries in the region, China and India lead the formic acid market, with the largest share in the regional volumetric consumption in 2012. The market volume of these products is comparatively low in the ROW region, but is estimated to grow with a moderate CAGR from 2014 to 2019.
Almost 45% of the total formic acid demand was for the agriculture sector in 2012, with silage preservation and animal feed application as the fastest growing end-user segment. As an end-user, agriculture is the largest segment of the industry, primarily due to its high penetration in all the regions and the ban of antibiotics promotion growth by the European Union in its applications.
The European region is the most active market in terms of strategic initiatives, owing to their emerging and mature market demands respectively. The animal feed global market is estimated to be around $16,183.0 million in 2012 and is estimated to reach $20,333.2 million in the next 5 years with the CAGR of 3.8%.
The important formic acid manufacturers include BASF SE (Germany), BASF SE (Germany), Feicheng Acid Chemicals Co. Ltd. (China), Gujarat Narmada Valley Fertilizers & Chemicals Ltd. (India), Perstorp AB (Sweden), and Taminco Corporation (Belgium), and others.
Formic Acid, by Geography, 2012
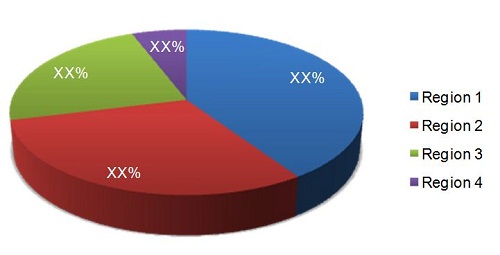
Source: Secondary Research, Expert Interviews, and MarketsandMarkets Analysis
This report covers the formic acid market by key regions and important countries in each of these regions. It also provides a detailed segmentation of the market on the basis of key types and applications, along with its projection till 2019.
Table Of Contents
1 Introduction (Slide No. - 20)
1.1 Key Deliverables
1.2 Report Description
1.3 Market At A Glance
1.4 Stakeholders
1.5 Research Methodology
1.5.1 Market Size
1.5.2 Key Data Points Taken From Secondary Sources
1.5.3 Key Data Points Taken From Primary Sources
1.5.4 Assumptions Made For This Report
1.6 Key Questions Answered
2 Executive Summary (Slide No. - 36)
2.1 Introduction
2.2 Industry Snapshot
3 Premium Insights (Slide No. - 39)
3.1 Formic Acid Market Share, 2012
3.2 Market Trends & Forecasts, By Geography
3.3 Market Attractiveness, By Geography
3.4 Market Attractiveness, By Application
4 Global Formic Acid Market Assessment, 2012 (Slide No. - 44)
4.1 Market, By Grade, 2012
4.2 Market, By Application, 2012
4.3 Market, By Geography, 2012
5 Market Overview (Slide No. - 49)
5.1 Introduction
5.2 Formic Acid Properties
5.3 Value Chain Analysis
5.4 Formic Acid Production Process*
5.5 Comparison of Different Acids� Environmental Characteristics
5.6 Market Dynamics
5.6.1 Drivers
5.6.2 Restraints
5.6.3 Opportunities
5.7 Market Porter�s Five Forces Analysis
5.8 Burning Issues
5.9 Winning Imperatives
5.10 Formic Acid: SWOT Analysis
6 Market Assessment, By Grade (Slide No. - 67)
6.1 Formic Acid Market Trend, By Grade
6.2 Market Trends & Forecasts, By Grades
6.3 85% Grade Market Trend, By Geography
6.4 94% Grade Market Trend, By Geography
6.5 99% Grade Market Trend, By Geography
6.6 Other Grades Market Trend, By Geography
7 Market Assessment, By Applications (Slide No. - 77)
7.1 Formic Acid Global Market, By Application
7.2 Global Market Trend, By Application
7.2.1 Agriculture
7.2.2 Leather & Tanning and Textile
7.2.3 Rubber
7.2.4 Chemical & Pharmaceuticals
7.2.5 Others
8 Market Assessment, By Geography (Slide No. - 92)
8.1 Formic Acid Market Trend, By Geography
8.2 North America: Market Trend, By Country
8.2.1 North America: Market Trend, By Application
8.2.2 North America: Market Trend, By Grade
8.2.3 U.S.:Market Trend, 2012-2019
8.2.4 U.S. : Market Trend, By Application
8.2.5 Canada: Market Trend, 2012-2019
8.2.6 Canada: Market Trend, By Applications
8.2.7 Mexico: Market Trend, 2012-2019
8.2.8 Mexico: Market Trend, By Application
8.3 Europe: Market Trend, By Country
8.3.1 Europe: Market Trend, By Application
8.3.2 Europe: Market Trend, By Grade
8.3.3 Germany: Market Trend, 2012-2019
8.3.4 Germany: Market Trend, By Applications
8.3.5 Italy:Market Trend, 2012-2019
8.3.6 Italy: Market Trend, By Applications
8.3.7 U.K. : Market Trend, 2012-2019
8.3.8 U.K.: Market Trend, By Application
8.3.9 Others: Market Trend, 2012-2019
8.3.10 Others: Market Trend, By Application
8.4 Asia-Pacific: Formic Acid Market Trend, By Application
8.4.1 Asia-Pacific: Market Trend, By Application
8.4.2 Asia-Pacific: Market Trend, By Grade
8.4.3 China: Market Trend, By Application
8.4.4 China: Market Trend, By Application
8.4.5 India: Market Trend, By Application
8.4.6 India: Market Trend, By Application
8.4.7 Japan: Market Trend, By Application
8.4.8 Japan: Market Trend, By Application
8.4.9 Others: Market Trend, By Application
8.4.10 Others: Market Trend, By Applications
8.5 ROW: Formic Acid Market Trend, By Application
8.5.1 ROW: Market Trend, By Application
8.5.2 ROW: Market Trend, By Grade
8.5.3 Latin America: Market Trend, By Application
8.5.4 Latin America: Market Trend, By Application
8.5.5 The Middle East: Market Trend, By Application
8.5.6 The Middle East: Market Trend, By Application
8.5.7 Others: Market Trend, By Application
8.5.8 Others : Market Trend, By Application
9 Competitive Landscape (Slide No. - 157)
9.1 Key Findings
9.2 Introduction
9.3 Key Developments in The Global Formic Acid Market Share
9.4 Capacity Share Analysis
9.5 Competitor Product Mapping, By Grade
9.6 Competitor Product Mapping, By Application
9.7 Patent Analysis
10 Company Profiles (Slide No. - 166)
10.1 BASF SE
10.2 Taminco Corporation
10.3 Perstorp AB
10.4 Feicheng Acid Chemicals Co. Ltd.
10.5 Gujarat Narmada Valley Fertilizers Co. Ltd.
10.6 Alfa Aesar
10.7 Chongqing Chuandong Chemical (Group) Co. Ltd.
10.8 Samsung Fine Chemicals Co. Ltd.
10.9 Helm Italia S.R.L
10.1 Shanxiyuanping Chemicals Co. Ltd.
List of Tables (93 Tables)
Table 1 Detailed Research Methodology For Market Size
Table 2 Data From Secondary Sources
Table 3 Data From Primary Sources
Table 4 Market Industry Snapshot
Table 5 Formic Acid - An Efficient Substitute
Table 6 Comparison of Environmental Characteristics
Table 7 Market Size, By Grade, 2012-2019 (Mt)
Table 8 Market Size, By Grade, 2012-2019 ($Thousand)
Table 9 85% Grade Market Size, By Geography, 2012-2019 (Mt)
Table 10 85% Grade Market Size, By Geography, 2012-2019 ($Thousand)
Table 11 94% Grade Market Size, By Geography, 2012-2019 (Mt)
Table 12 94% Grade Market Size, By Geography, 2012-2019 ($Thousand)
Table 13 99% Grade Market Size, By Geography, 2012-2019 (Mt)
Table 14 99% Grade Market Size, By Geography, 2012-2019 ($Thousand)
Table 15 Other Grades Market Size, By Geography, 2012-2019 (Mt)
Table 16 Other Grades Market Size, By Geography, 2012-2019 ($Thousand)
Table 17 Market Size, By Application, 2012-2019 (Mt)
Table 18 Market Size, By Application, 2012-2019 ($Thousand)
Table 19 Inhibition of Bacteria By Formic Acid
Table 20 Agriculture Market Size, By Geography, 2012-2019 (Mt)
Table 21 Agriculture Market Size, By Geography, 2012-2019 ($Thousand)
Table 22 Leather & Textile Market Size, By Geography, 2012-2019 (Mt)
Table 23 Leather & Textile Market Size, By Geography, 2012-2019 ($Thousand)
Table 24 Rubber Market Size, By Geography, 2012-2019 (Mt)
Table 25 Rubber Market Size, By Geography, 2012-2019 ($Thousand)
Table 26 Chemical &Pharma Market Size, By Geography, 2012-2019 (Mt)
Table 27 Chemical &Pharma Market Size, By Geography, 2012-2019 ($Thousand)
Table 28 Others Market Size, By Geography, 2012-2019 (Mt)
Table 29 Others Market Size, By Geography, 2012-2019 ($Thousand)
Table 30 Market Size, By Geography, 2012-2019 (Mt)
Table 31 Market Size, By Geography, 2012-2019 ($Thousand)
Table 32 North America: Formic Acid Market Size, 2012-2019
Table 33 North America: Market Size, By Application, 2012-2019 (Mt)
Table 34 North America: Market Size, By Application, 2012-2019 ($Thousand)
Table 35 North America: Market Size, By Grade, 2012-2019 (Mt)
Table 36 North America: Market Size, By Grade, 2012-2019 ($Thousand)
Table 37 U.S.: Formic Acid Market Size, 2012-2019
Table 38 U.S.: Market Size, By Application, 2012-2019 (Mt)
Table 39 U.S.: Market Size, By Application, 2012-2019 ($Thousand)
Table 40 Canada: Market Size, 2012-2019
Table 41 Canada: Market Size, By Application, 2012-2019 (Mt)
Table 42 Canada: Market Size, By Application, 2012-2019 ($Thousand)
Table 43 Mexico: Market Size, 2012-2019
Table 44 Mexico: Market Size, By Application, 2012-2019 (Mt)
Table 45 Mexico: Market Size, By Application, 2012-2019 ($Thousand)
Table 46 Europe: Formic Acid Market Size, 2012-2019
Table 47 Europe: Market Size, By Application, 2012-2019 (Mt)
Table 48 Europe: Market Size, By Application, 2012-2019 ($Thousand)
Table 49 Europe: Market Size, By Grade, 2012-2019 (Mt)
Table 50 Europe: Market Size, By Grade, 2012-2019 ($Thousand)
Table 51 Germany: Market Size, 2012-2019
Table 52 Germany: Market Size, By Application, 2012-2019 (Mt)
Table 53 Germany: Market Size, By Application, 2012-2019 ($Thousand)
Table 54 Italy: Market Size, 2012-2019
Table 55 Italy: Market Size, By Application, 2012-2019 (Mt)
Table 56 Italy: Market Size, By Application, 2012-2019 ($Thousand)
Table 57 U.K.: Market Size, 2012-2019
Table 58 U.K.: Market Size, By Application, 2012-2019 (Mt)
Table 59 U.K.: Market Size, By Application, 2012-2019 ($Thousand)
Table 60 Others: Formic Acid Market Size, 2012-2019
Table 61 Others: Market Size, By Application, 2012-2019 (Mt)
Table 62 Others: Market Size, By Application, 2012-2019 ($Thousand)
Table 63 Asia-Pacific: Formic Acid Market Size, 2012-2019
Table 64 Asia-Pacific: Market Size, By Application, 2011-2018 (Mt)
Table 65 Asia-Pacific: Market Size, By Application, 2012-2019 ($Thousand)
Table 66 Asia-Pacific: Market Size, By Grade, 2012-2019 (Mt)
Table 67 Asia-Pacific: Market Size, By Grade, 2012-2019 ($Thousand)
Table 68 China: Market Size, 2012-2019
Table 69 China:Market Size, By Application, 2012-2019 (Mt)
Table 70 China: Market Size, By Application, 2012-2019 ($Thousand)
Table 71 India: Market Size, 2012-2019
Table 72 India: Market Size, By Application, 2012-2019 (Mt)
Table 73 India: Market Size, By Application, 2012-2019 ($Thousand)
Table 74 Japan: Market Size, 2012-2019
Table 75 Japan: Market Size, By Application, 2012-2019 (Mt)
Table 76 Japan: Market Size, By Application, 2012-2019 ($Thousand)
Table 77 Others: Formic Acid Market Size, 2012-2019
Table 78 Others: Market Size, By Application, 2012-2019 (Mt)
Table 79 Others: Market Size, By Application, 2012-2019 ($Thousand)
Table 80 ROW: Formic Acid Market Size, 2012-2019
Table 81 ROW: Market Size, By Application, 2012-2019 (Mt)
Table 82 ROW: Market Size, By Application, 2012-2019 ($Thousand)
Table 83 ROW: Market Size, By Grade, 2012-2019 (Mt)
Table 84 ROW: Market Size, By Grade, 2012-2019 ($Thousand)
Table 85 Latin America: Formic Acid Market Size, 2012-2019
Table 86 Latin America: Market Size, By Application, 2012-2019 (Mt)
Table 87 Latin America: Market Size, By Application, 2012-2019 ($Thousand)
Table 88 The Middle East: Formic Acid Market Size, 2012-2019
Table 89 The Middle East: Market Size, By Application, 2012-2019 (Mt)
Table 90 The Middle East: Market Size, By Application, 2012-2019 ($Thousand)
Table 91 Others: Formic Acid Market Size, 2012-2019
Table 92 Others: Market Size, By Application, 2012-2019 (Mt)
Table 93 Others: Market Size, By Application, 2012-2019 ($Thousand)
List of Figures (26 Figures)
Figure 1 Formic Acid Market Segmentation
Figure 2 Research Methodology Forecasting Model
Figure 3 Research Methodology Demand Side
Figure 4 Research Methodology Supply Side
Figure 5 Research Methodology Triangulation
Figure 6 Formic Acid Market Share (Value), By Grade & Application, 2012
Figure 7 Market Size, By Geography, 2012-2019 & Market Share (Volume), By Geography, 2012
Figure 8 Market Attractiveness, By Geography, 2014-2019
Figure 9 Market Attractiveness, By Application, 2014-2019
Figure 10 Market Share(Value), By Grade, 2012
Figure 11Market Share (Volume), By Grade, 2012
Figure 12 Market Share (Value), By Application, 2012
Figure 13 Market Share (Volume), By Application, 2012
Figure 14 Market Share (Value), By Geography, 2012
Figure 15 Market Share (Volume), By Geography, 2012
Figure 16 Value Chain Analysis
Figure 17 Formic Acid � End User Industry
Figure 18 Application Areas
Figure 19 Porter�s Five Forces Analysis
Figure 20 Global Registration Agencies
Figure 21 Formic Acid Market Size, By Grade, 2012-2019 & Market Share (Volume), By Grade, 2012
Figure 22 Important Applications of Formic Acid
Figure 23 Market Share, By Growth Strategy, 2010-2013*
Figure 24 Formic Acid Capacity Share Analysis
Figure 25 Market Patent Analysis, By Geography, 2010-2014*
Figure 26 Market Patent Analysis, By Company, 2010� 2014*


Growth opportunities and latent adjacency in Formic Acid Market