Packaging Additives (Functional Additives and Barrier Coatings) Market by Type (Antioxidants, UV Stabilizers, Antimicrobials, Metalized Coatings, and Organic Liquid Coatings), by Application (Food, Beverage, Cosmetic & Personal Care), and by Region - Global Trends & Forecast 2020


[191 Pages Report] The global packaging additives (functional additives and barrier coatings) market is projected to reach USD 4.90 Billion by 2020, registering a CAGR of 5.5% between 2015 and 2020. In this study, 2014 has been considered as the base year and 2015�2020 as forecast period for estimating the market size. The report aims at estimating the market size and future growth potential across different segments such as type, application, and region.
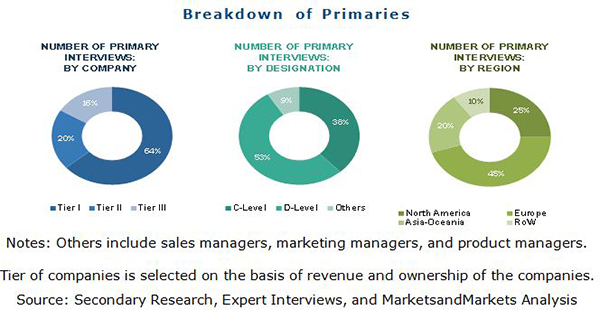
In the secondary research process, different sources have been referred to identify and collect information for this study. These secondary sources include annual reports, press releases, and investor presentations of companies, white papers, certified publications, and articles from recognized authors. In the primary research process, sources from both supply and demand sides have been interviewed to obtain qualitative and quantitative information for this report. The bottom-up approach has been used to estimate the market size based on application and region, in terms of volume. The top-down approach has been implemented to validate the market size, in terms of value. With the data triangulation procedure and validation of data through primaries, the exact values of the overall parent market size and individual market sizes have been determined and confirmed in this study.
Below is the figure showing break-up of profile of primary discussion participants.
To know about the assumptions considered for the study, download the pdf brochure
The packaging additives (functional additives and barrier coatings) market is highly diversified, with many small and medium market players; however, the market is dominated by some large market players. The established ecosystem includes chemical companies manufacturing plastic additives and barrier coatings, plastic producers, plastic compounders and processors, end users, and government organizations. Some of the prominent packaging additive (functional additive and barrier coating) manufacturers include BASF SE (Germany), Songwon Industrial Co. Ltd. (South Korea), Cytec-Solvay Group (U.S.), Clariant Corp. (Switzerland), and Addivant (U.S.).
This study answers several questions for the stakeholders, including which market segments to focus in next two�five years for prioritizing the efforts and investments.
Target Audience:
- Functional additive manufacturing companies
- Barrier coating manufacturing companies
- Plastic packaging manufacturing companies
- Traders, distributors, and retailers
- Raw material suppliers
- Commercial R&D institutes
- Trade associations
- Government agencies
Get online access to the report on the World's First Market Intelligence Cloud
Request Sample Scope of the Report
:

This research report categorizes the market for packaging additives (functional additive and barrier coatings) based on type, applications, and region, and forecasts revenue growth and analysis of trends in each of the submarkets.
On the Basis of Type: The packaging additives (functional additive and barrier coatings) market is segmented into the following on the basis of type:
- Antioxidants
- UV stabilizers
- Anti-block
- Clarifying agents
- Anti-static
- Anti-fog
- Antimicrobial
- Metalized coating
- Organic liquid coatings
- Inorganic oxide coatings
Each type is described in detail in the report with value as well as volume forecasts till 2020.
On the Basis of Application: The packaging additives (functional additive and barrier coatings) market is segmented into the following on the basis of application:
- Food
- Beverages
- Pharmaceutical & Healthcare
- Cosmetic & Personal Care
- Others
The market segments are described in detail in the report with value as well as volume forecasts till 2020.
On the Basis of Region: The packaging additives (functional additive and barrier coatings) market is segmented by region as:
- North America : U.S., Canada, and Mexico
- Europe: Germany, France, U.K., Italy, Russia, Spain, Turkey, and Rest of Europe
- Asia-Pacific: China, Japan, India, and Rest of Asia-Pacific
- RoW: Brazil and Maghreb
Available Customizations: The following customization options are available in the report:
- Detailed company profiles for additional market player (up to three)
- List of compounders on regional level
Analysis and profiling of additional global as well as regional market players (Up to three)
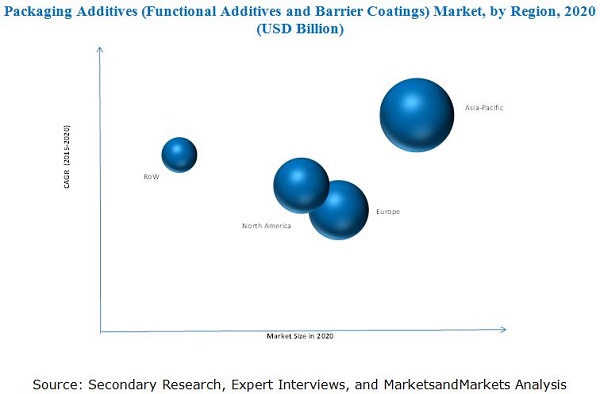
The market size of packaging additives (functional additives and barrier coatings) is projected to reach USD 4.90 Billion by 2020, at a CAGR of 5.5% between 2015 and 2020. The increased use of packaging material, especially in Asia-Pacific, owing to the changing lifestyle, higher population, and rapid urbanization is one of the key factors driving the market.
The pharmaceutical & healthcare segment is projected to be the fastest-growing application of the packaging additives (functional additives and barrier coatings) market during the forecast period. Packaging additives (functional additives and barrier coatings) provide the required physical and chemicals stability (effective barrier to moisture, oxygen, microorganism, and light) to the end product. The demand for these additives and coatings used in pharmaceutical packaging are projected to be fueled by industry demands, regulatory pressures, enhanced patient care, and cost-cutting measures.
Functional additives are classified into seven types including antioxidants, UV stabilizers, anti-block, clarifying agents, anti-static, anti-fog, and antimicrobial. Barrier coatings include metalized coatings, organic liquid coatings, and inorganic oxide coatings. In terms of volume, antioxidant is the largest segment followed by anti-block. However, in terms of value, antimicrobial additives were the largest type segment in 2015. For barrier coatings, the metalized coatings segment accounted for the largest share, both in terms of value and volume, in 2015.
Currently, Asia-Pacific is the largest packaging additives (functional additives and barrier coatings) market, accounting for more than two-fifth of the global market size, in terms of value, in 2015. Among all the countries, China dominates the market, closely followed by the U.S. Presence of a large number of global as well as regional market players, well-established packaging industry, high population, increased levels of disposable income, and changing lifestyle are the key factors driving the market in China.
Although the packaging additives (functional additives and barrier coatings) market is growing at a significant growth rate, few factors hinder the market growth worldwide. Volatile raw material prices and stringent regulations imposed on the use of these additives and coatings are the major restraint of the packaging additives (functional additives and barrier coatings) market.
Companies, such as BASF SE (Germany), Songwon Industrial Co. Ltd. (South Korea), Cytec- Solvay Group (U.S.), Clariant Corp. (Switzerland), and Addivant (U.S.) are the dominant market players in the global packaging additives (functional additives and barrier coatings) market. The diverse product portfolio and strategically positioned R&D centers, continuous adoption of development strategies, and technological advances are some of the factors responsible for strengthening the position of these companies in the global market. These companies have been adopting various organic and inorganic growth strategies such as expansions, mergers & acquisitions, partnerships, and new product launches & products development to enhance their current market share.
To speak to our analyst for a discussion on the above findings, click Speak to Analyst
Table of Contents
1 Introduction (Page No. - 18)
1.1 Objectives of the Study
1.2 Market Definition
1.3 Market Scope
1.3.1 Markets Covered
1.3.2 Years Considered for the Study
1.4 Currency
1.5 Package Size
1.6 Stakeholders
2 Research Methodology (Page No. - 21)
2.1 Reserach Data
2.2 Research Data
2.2.1 Secondary Data
2.2.1.1 Key Data From Secondary Sources
2.2.2 Primary Data
2.2.2.1 Key Data From Primary Sources
2.2.2.2 Key Industry Insights
2.2.2.3 Break Down of Primary Interviews
2.3 Market Size Estimation
2.3.1 Bottom-Up Approach
2.3.2 Top-Down Approach
2.4 Market Breakdown and Data Triangulation
2.5 Research Assumptions and Limitations
2.5.1 Assumptions
2.5.2 Limitations
3 Executive Summary (Page No. - 29)
4 Premium Insights (Page No. - 34)
4.1 Attractive Opportunity in the Functional Additives and Barrier Coatings Market
4.2 Functional Additives Market � Top Five Additive Types
4.3 Barrier Coatings Market � By Type
4.4 Functional Additives and Barrier Coatings Market in Asia-Pacific Region
4.5 China - Largest Functional Additives and Barrier Coatings Market
4.6 Functional Additives and Barrier Coatings Market, By Application and By Region
4.7 Functional Additives and Barrier Coatings Market: Developed vs Developing Nations
4.8 Life Cycle Analysis, By Region (2015)
5 Market Overview (Page No. - 41)
5.1 Introduction
5.2 Market Segmentation
5.2.1 Functional Additives, By Type
5.2.2 Barrier Coatings, By Type
5.2.3 By Application
5.2.4 By Region
5.3 Market Dynamics
5.3.1 Drivers
5.3.1.1 Increasing Demand From End-Use Industry and Growing Economies
5.3.1.2 Rising Disposable Income and Busy Lifestyles
5.3.2 Restraints
5.3.2.1 Volatile Raw Material Prices
5.3.2.2 Stringent Regulations in Plastic Additive Industry
5.3.3 Opportunities
5.3.3.1 Polymeric Nanocomposite Coatings
5.3.3.2 Development of New Functional Additives
5.3.4 Challenge
5.3.4.1 Disposal of Plastic Waste
6 Industry Trends (Page No. - 49)
6.1 Introduction
6.2 Value-Chain Analysis
6.3 Prevailing Trends
6.4 Porter�s Five Forces Analysis
6.4.1 Threat of New Entrants
6.4.2 Threat of Substitutes
6.4.3 Bargaining Power of Buyers
6.4.4 Bargaining Power of Suppliers
6.4.5 Intensity of Competitive Rivalry
7 Functional Additives Market, By Type (Page No. - 54)
7.1 Introduction
7.2 Antioxidants
7.3 UV Stabilizers
7.4 Anti-Block
7.5 Clarifying Agent
7.6 Anti-Static
7.7 Anti-Fog
7.8 Antimicrobial
8 Barrier Coatings Market, By Type (Page No. - 67)
8.1 Introduction
8.2 Metalized Coatings
8.3 Organic Liquid Coating
8.4 Inorganic Oxide Coatings
9 Functional Additives and Barrier Coatings Market, By Application (Page No. - 73)
9.1 Introduction
9.2 Food
9.3 Beverage
9.4 Pharmaceutical & Healthcare
9.5 Cosmetic & Personal Care
10 Functional Additives and Barrier Coatings Market, By Region (Page No. - 84)
10.1 Introduction
10.2 Asia-Pacific
10.2.1 China: Dominant Market in the World
10.2.2 Japan
10.2.3 India
10.2.4 Rest of Asia-Pacific
10.3 Europe
10.3.1 Germany
10.3.2 France
10.3.3 U.K.
10.3.4 Italy
10.3.5 Russia
10.3.6 Spain
10.3.7 Turkey
10.3.8 Rest of Europe
10.4 North America
10.4.1 U.S.
10.4.2 Canada
10.4.3 Mexico
10.5 RoW: Emerging Market
10.5.1 Brazil
10.5.2 Maghreb Countries
10.5.3 Others
11 Competitive Landscape (Page No. - 148)
11.1 Overview
11.2 Maximum Developments in 2014
11.3 Competitive Situations and Trends
11.3.1 Expansions
11.3.2 Partnerships, Agreements, and Collaborations
11.3.3 New Product Launches
11.3.4 Mergers & Acquisitions
12 Company Profiles (Page No. - 156)
(Overview, Financial*, Products & Services, Strategy, and Developments)
12.1 Introduction
12.2 BASF SE
12.3 Songwon Industrial Co. Ltd
12.4 Cytec Solvay Group
12.5 Clariant
12.6 Addivant
12.7 Adeka Corporation
12.8 Akzonobel
12.9 Altana AG
12.10 Amcor
12.11 E.I. Du Pont De Nemours and Company
12.12 Milliken & Company
12.13 Sabo S.P.A.
*Details Might Not Be Captured in Case of Unlisted Companies.
13 Appendix (Page No. - 187)
13.1 Insights of Industry Experts
13.2 Discussion Guide
13.3 Introducing RT: Real Time Market Intelligence
13.4 Available Customizations
13.5 Related Reports
List of Tables (158 Tables)
Table 1 Functional Additives Market Size, By Type, 2013�2020 (USD Million)
Table 2 Functional Additives Market Size, By Type, 2013�2020 (Kiloton)
Table 3 Antioxidants Market Size, By Region, 2013�2020 (USD Million)
Table 4 Antioxidantss Market Size, By Region, 2013�2020 ( Kiloton)
Table 5 UV Stabilizers Market Size, By Region, 2013�2020 (USD Million)
Table 6 UV Stabilizers Market Size, By Region, 2013�2020 (Kiloton)
Table 7 Anti-Block Market Size, By Region, 2013�2020 (USD Million)
Table 8 Anti-Block Market Size, By Region, 2013�2020 ( Kiloton)
Table 9 Clarifying Agent Market Size, By Region, 2013�2020 (USD Million)
Table 10 Clarifying Agent Market Size, By Region, 2013�2020( Kiloton)
Table 11 Anti- Static Market Size, By Region, 2013�2020 (USD Million)
Table 12 Anti-Static Market Size, By Region, 2013�2020 ( Kiloton)
Table 13 Anti-Fog Market Size, By Region, 2013�2020 (USD Million)
Table 14 Anti-Fog Market Size, By Region, 2013�2020 ( Kiloton)
Table 15 Antimicrobial Market Size, By Region, 2013�2020 (USD Million)
Table 16 Antimicrobial Market Size, By Region, 2013�2020 (Kiloton)
Table 17 Barrier Coatings Market Size, By Type, 2013�2020 (USD Million)
Table 18 Barrier Coatings Market Size, By Type, 2013�2020 (Kiloton)
Table 19 Metalized Coatings Market Size, By Region, 2013�2020 (USD Million)
Table 20 Metalized Coatings Market Size, By Region, 2013�2020 (Kiloton)
Table 21 Organic Liquid Coatings Market Size, By Region, 2013�2020 (USD Million)
Table 22 Organic Liquid Coatings Market Size, By Region, 2013�2020 (Kiloton)
Table 23 Inorganic Oxide Coatings Market Size, By Region, 2013�2020 (USD Million)
Table 24 Inorganic Oxide Coatings Market Size, By Region, 2013�2020 (Kiloton)
Table 25 Functional Additives and Barrier Coatings Market Size, By Application, 2013�2020 (USD Million)
Table 26 Market Size, By Application, 2013�2020 (Kiloton)
Table 27 Functional Additives and Barrier Coatings Market Size in Food Application, By Region, 2013�2020 (USD Million)
Table 28 Market Size in Food Application, By Region, 2013�2020 (Kiloton)
Table 29 Functional Additives and Barrier Coatings Market Size in Beverage Application, By Region, 2013�2020 (USD Million)
Table 30 Market Size in Beverage Application, By Region, 2013�2020 (Kiloton)
Table 31 Functional Additives and Barrier Coatings Market Size in Pharmaceutical & Healthcare Application, By Region, 2013�2020 (USD Million)
Table 32 Market Size in Pharmaceutical & Healthcare Application, By Region, 2013�2020 (Kiloton)
Table 33 Functional Additives and Barrier Coatings Market Size in Cosmetic & Personal Care Application, By Region, 2013�2020 (USD Million)
Table 34 Market Size in Cosmetic & Personal Care, By Region, 2013�2020 (Kiloton)
Table 35 Functional Additives and Barrier Coatings Market Size in Other Applications, By Region, 2013�2020 (USD Million)
Table 36 Market Size in Other Applications, By Region, 2013�2020 (Kiloton)
Table 37 Functional Additives and Barrier Coatings Market Size, By Region, 2013�2020 (USD Million)
Table 38 Market Size, By Region, 2013�2020 (Kiloton)
Table 39 Asia-Pacific: Functional Additives and Barrier Coatings Market Size, By Country, 2013�2020 (USD Million)
Table 40 Asia-Pacific: Market Size, By Country, 2013�2020 (Kiloton)
Table 41 China: Functional Additives Market Size, By Type, 2013�2020 (USD Million)
Table 42 China: Market Size, By Type, 2013�2020 (Ton)
Table 43 China: Barrier Coatings Market Size, By Type, 2013�2020 (USD Million)
Table 44 China: Market Size, By Type, 2013�2020 (Ton)
Table 45 China: Market Size, By Application, 2013�2020 (USD Million)
Table 46 China: Market Size, By Application, 2013�2020 (Ton)
Table 47 Japan: Functional Additives Market Size, By Type, 2013�2020 (USD Million)
Table 48 Japan: Market Size, By Type, 2013�2020 (Ton)
Table 49 Japan: Barrier Coatings Market Size, By Type, 2013�2020 (USD Million)
Table 50 Japan: Barrier Coatings Market Size, By Type, 2013�2020 (Ton)
Table 51 Japan: Functional Additives and Barrier Coatings Market Size, By Application, 2013�2020 (USD Million)
Table 52 Japan: Market Size, By Application, 2013�2020 (Tons)
Table 53 India: Functional Additives Market Size, By Type, 2013�2020 (USD Million)
Table 54 India: Functional Additives Market Size, By Type, 2013�2020 (Ton)
Table 55 India: Barrier Coatings Market Size, By Type, 2013�2020 (USD Million)
Table 56 India: Barrier Coatings Market Size, By Type, 2013�2020 (Ton)
Table 57 India: Functional Additives and Barrier Coatings Market Size, By Application, 2013�2020 (USD Million)
Table 58 India: Market Size, By Application, 2013�2020 (Ton)
Table 59 Rest of Asia-Pacific: Functional Additives Market Size, By Type, 2013�2020 (USD Million)
Table 60 Rest of Asia-Pacific: Functional Additives Market Size, By Type, 2013�2020 (Ton)
Table 61 Rest of Asia-Pacific: Barrier Coatings Market Size, By Type, 2013�2020 (USD Million)
Table 62 Rest of Asia-Pacific: Barrier Coatings Market Size, By Type, 2013�2020 (Ton)
Table 63 Rest of Asia-Pacific: Functional Additives and Barrier Coatings Market Size, By Application, 2013�2020 (USD Million)
Table 64 Rest of Asia-Pacific: Market Size, By Application, 2013�2020 (Tons)
Table 65 Europe: Functional Additives and Barrier Coatings Market Size, By Country, 2013�2020 (USD Million)
Table 66 Europe: Market Size, By Country, 2013�2020 (Kiloton)
Table 67 Germany: Functional Additives Market Size, By Type, 2013�2020 (USD Million)
Table 68 Germany: Functional Additives Market Size, By Type, 2013�2020 (Ton)
Table 69 Germany: Barrier Coatings Market Size, By Type, 2013�2020 (USD Million)
Table 70 Germany: Barrier Coatings Market Size, By Type, 2013�2020 (Ton)
Table 71 Germany: Functional Additives and Barrier Coatings Market Size, By Application, 2013�2020 (USD Million)
Table 72 Germany: Market Size, By Application, 2013�2020 (Tons)
Table 73 France: Functional Additives Market Size, By Type, 2013�2020 (USD Million)
Table 74 France: Functional Additives Market Size, By Type, 2013�2020 (Ton)
Table 75 France: Barrier Coatings Market Size, By Type, 2013�2020 (USD Million)
Table 76 France: Barrier Coatings Market Size, By Type, 2013�2020 (Ton)
Table 77 France: Functional Additives and Barrier Coatings Market Size, By Application, 2013�2020 (USD Million)
Table 78 France: Market Size, By Application, 2013�2020 (Ton)
Table 79 U.K.: Functional Additives Market Size, By Type, 2013�2020 (USD Million)
Table 80 U.K.: Functional Additives Market Size, By Type, 2013�2020 (Ton)
Table 81 U.K.: Barrier Coatings Market Size, By Type, 2013�2020 (USD Million)
Table 82 U.K.: Barrier Coatings Market Size, By Type, 2013�2020 (Ton)
Table 83 U.K.: Functional Additives and Barrier Coatings Market Size, By Application, 2013�2020 (USD Million)
Table 84 U.K.: Market Size, By Application, 2013�2020 (Tons)
Table 85 Italy: Functional Additives Market Size, By Type, 2013�2020 (USD Million)
Table 86 Italy: Functional Additives Market Size, By Type, 2013�2020 (Ton)
Table 87 Italy: Barrier Coatings Market Size, By Type, 2013�2020 (USD Million)
Table 88 Italy: Barrier Coatings Market Size, By Type, 2013�2020 (Ton)
Table 89 Italy: Functional Additives and Barrier Coatings Market Size, By Application, 2013�2020 (USD Million)
Table 90 Italy: Market Size, By Application, 2013�2020 (Tons)
Table 91 Functional Additives Market Size in Russia, By Type, 2013�2020 (USD Million)
Table 92 Functional Additives Market Size in Russia, By Type, 2013�2020 (Ton)
Table 93 Barrier Coatings Market Size in Russia, By Type, 2013�2020 (USD Million)
Table 94 Barrier Coatings Market Size in Russia, By Type, 2013�2020 (Ton)
Table 95 Functional Additives and Barrier Coatings Market Size in Russia, By Application, 2013�2020 (USD Million)
Table 96 Market Size in Russia, By Application, 2013�2020 (Ton)
Table 97 Functional Additives Market Size in Spain, By Type, 2013�2020 (USD Million)
Table 98 Functional Additives Market Size in Spain, By Type, 2013�2020 (Ton)
Table 99 Barrier Coatings Market Size in Spain, By Type, 2013�2020 (USD Million)
Table 100 Barrier Coatings Market Size in Spain, By Type, 2013�2020 (Ton)
Table 101 Functional Additives and Barrier Coatings Market Size in Spain, By Application, 2013�2020 (USD Million)
Table 102 Market Size in Spain, By Application, 2013�2020 (Ton)
Table 103 Functional Additives Market Size in Turkey, By Type, 2013�2020 (USD Million)
Table 104 Functional Additives Market Size in Turkey, By Type, 2013�2020 (Ton)
Table 105 Barrier Coatings Market Size in Turkey, By Type, 2013�2020 (USD Million)
Table 106 Barrier Coatings Market Size in Turkey, By Type, 2013�2020 (Ton)
Table 107 Functional Additives and Barrier Coatings Market Size in Turkey, By Application, 2013�2020 (USD Million)
Table 108 Market Size in Turkey, By Application, 2013�2020 (Ton)
Table 109 Functional Additives Market Size in Rest of Europe, By Type, 2013�2020 (USD Million)
Table 110 Functional Additives Market Size in Rest of Europe, By Type, 2013�2020 (Ton)
Table 111 Barrier Coatings Market Size in Rest of Europe, By Type, 2013�2020 (USD Million)
Table 112 Barrier Coatings Market Size in Rest of Europe, By Type, 2013�2020 (Ton)
Table 113 Functional Additives and Barrier Coatings Market Size in Rest of Europe, By Application, 2013�2020 (USD Million)
Table 114 Market Size in Rest of Europe, By Application, 2013�2020 (Ton)
Table 115 Functional Additives and Barrier Coatings Market Size in North America, By Country, 2013�2020 (USD Million)
Table 116 Market Size in North America, By Country, 2013�2020 (Kiloton)
Table 117 Functional Additives Market Size in U.S., By Type, 2013�2020 (USD Million)
Table 118 Functional Additives Market Size in U.S., By Type, 2013�2020 (Ton)
Table 119 Barrier Coatings Market Size in U.S., By Type, 2013�2020 (USD Million)
Table 120 Barrier Coatings Market Size in U.S., By Type, 2013�2020 (Ton)
Table 121 Functional Additives and Barrier Coatings Market Size in U.S., By Application, 2013�2020 (USD Million)
Table 122 Market Size in U.S., By Application, 2013�2020 (Ton)
Table 123 Functional Additives Market Size in Canada, By Type, 2013�2020 (USD Million)
Table 124 Functional Additives Market Size in Canada, By Type, 2013�2020 (Ton)
Table 125 Barrier Coatings Market Size in Canada, By Type, 2013�2020 (USD Million)
Table 126 Barrier Coatings Market Size in Canada, By Type, 2013�2020 (Ton)
Table 127 Functional Additives and Barrier Coatings Market Size in Canada, By Application, 2013�2020 (USD Million)
Table 128 Market Size in Canada, By Application, 2013�2020 (Ton)
Table 129 Functional Additives Market Size in Mexico, By Type, 2013�2020 (USD Million)
Table 130 Functional Additives Market Size in Mexico, By Type, 2013�2020 (Ton)
Table 131 Barrier Coatings Market Size in Mexico, By Type, 2013�2020 (USD Million)
Table 132 Barrier Coatings Market Size in Mexico, By Type, 2013�2020 (Ton)
Table 133 Functional Additives and Barrier Coatings Market Size in Mexico, By Application, 2013�2020 (USD Million)
Table 134 Market Size in Mexico, By Application, 2013�2020 (Ton)
Table 135 Market Size in RoW, By Country, 2013�2020 (USD Million)
Table 136 Market Size in RoW, By Country, 2013�2020 (Kiloton)
Table 137 Functional Additives Market Size in Brazil, By Type, 2013�2020 (USD Million)
Table 138 Functional Additives Market Size in Brazil, By Type, 2013�2020 (Ton)
Table 139 Barrier Coatings Market Size in Brazil, By Type, 2013�2020 (USD Million)
Table 140 Barrier Coatings Market Size in Brazil, By Type, 2013�2020 (Ton)
Table 141 Functional Additives and Barrier Coatings Market Size in Brazil, By Application, 2013�2020 (USD Million)
Table 142 Market Size in Brazil, By Application, 2013�2020 (Ton)
Table 143 Functional Additives Market Size in Maghreb Countries, By Type, 2013�2020 (USD Million)
Table 144 Functional Additives Market Size in Maghreb Countries, By Type, 2013�2020 (Ton)
Table 145 Barrier Coatings Market Size in Maghreb Countries, By Type, 2013�2020 (USD Million)
Table 146 Barrier Coatings Market Size in Maghreb Countries, By Type, 2013�2020 (Ton)
Table 147 Functional Additives and Barrier Coatings Market Size in Maghreb Countries, By Application, 2013�2020 (USD Million)
Table 148 Market Size in Maghreb Countries, By Application, 2013�2020 (Ton)
Table 149 Functional Additives Market Size in Other Regions, By Type, 2013�2020 (USD Million)
Table 150 Functional Additives Market Size in Other Regions, By Type, 2013�2020 (Ton)
Table 151 Barrier Coatings Market Size in Other Regions, By Type, 2013�2020 (USD Million)
Table 152 Barrier Coatings Market Size in Other Regions, By Type, 2013�2020 (Ton)
Table 153 Functional Additives and Barrier Coatings Market Size in Other Regions, By Application, 2013�2020 (USD Million)
Table 154 Market Size in Other Regions, By Application, 2013�2020 (Ton)
Table 155 Expansions, 2011�2015
Table 156 Partnerships, Agreements, and Collaborations, 2011�2015
Table 157 New Product Launches, 2011�2015
Table 158 Mergers & Acquisitions, 2011�2015
List of Figures (57 Figures)
Figure 1 Functional Additives and Barrier Coatings: Research Design
Figure 2 Market Size Estimation Methodology: Bottom-Up Approach
Figure 3 Market Size Estimation Methodology: Top-Down Approach
Figure 4 Market Size Estimation Methodology: Data Triangulation
Figure 5 Functional Additives Market Size, By Type (2015 vs 2020)
Figure 6 Barrier Coatings Market Size, By Type (2015 vs 2020)
Figure 7 Functional Additives and Barrier Coatings Market Size, By Application (2015 vs 2020)
Figure 8 Functional Additives and Barrier Coatings Market Share, By Region, 2020 (Kilotons)
Figure 9 Attractive Growth Opportunities in the Functional Additives and Barrier Coatings Market During the Forecast Period (2015-2020)
Figure 10 Antioxidants Additives are Expected to Grow at the Highest Rate During the Forecast Period (2015-2020)
Figure 11 Organic Liquid Coatings to Grow at the Highest Rate During the Forecast Period (2015-2020)
Figure 12 Food Application has the Maximum Share in the Asia-Pacific Market
Figure 13 Rapid Growth Expectation in Asia-Pacific Region During the Forecast Period
Figure 14 APAC Expected to Dominate the Functional Additives and Barrier Coatings Market Across All Segments (2020)
Figure 15 Developing Markets are Expected to Grow Faster Than the Developed Ones During the Forecast Period (2015-2020)
Figure 16 Asia-Pacific Market to Witness Rapid Growth During 2015-2020
Figure 17 Growing Demand From End-Use Industries is A Major Driving Factor of the Market
Figure 18 Value-Chain Analysis: Major Value is Added During Compounding & Processing
Figure 19 Innovation and R&D : A Major Trend Among the Key Market Players
Figure 20 Porter�s Five Forces Analysis
Figure 21 Antimicrobial Additives is the Largest Segment for Functional Additives in Terms of Value (USD Million)
Figure 22 Functional Additives Market, By Region (Kiloton)
Figure 23 Antioxidants Market Size, (Ton), 2015 vs 2020
Figure 24 Increasing Use of UV Stabilizers in Asia Drives the Functional Additives Market
Figure 25 Anti-Block Market Size, (Ton), 2015 vs 2020
Figure 26 Antimicrobial vs Clarifying Agents (USD Million), 2015 vs 2020
Figure 27 Barrier Coatings Market, By Type (USD Million)
Figure 28 Metalized Coatings Market, By Region (USD Million)
Figure 29 Functional Additives and Barrier Coatings Market, By Application
Figure 30 Growth of Functional Additives and Barrier Coatings Market in Food Application
Figure 31 Beverages Market Size, By Region
Figure 32 Pharmaceutical & Healthcare is the Fastest-Growing Application in Functional Additives and Barrier Coatings Market
Figure 33 Development of New Packaging Applications in Asia is Estimated to Drive the Market in the Coming Years
Figure 34 India: Emerging Market for Functional Additives and Barrier Coatings
Figure 35 Asia-Pacific: Functional Additives and Barrier Coatings Market Snapshot � Most Lucrative Opportunities
Figure 36 China: Largest Functional Additive and Barrier Coating Market Globally
Figure 37 Germany: Growth in Functional Additives and Barrier Coatings Market
Figure 38 Functional Additives and Barrier Coatings Market in North America
Figure 39 Functional Additives and Barrier Coatings Market in Brazil
Figure 40 Expansion Was the Key Growth Strategy, 2011�2015
Figure 41 Expansion: Key Strategy Adopted By the Major Players for Expanding Their Regional Footprint
Figure 42 Developments in the Functional Additives and Barrier Coatings Market, 2011�2015
Figure 43 Regional Revenue Mix of Top Market Players
Figure 44 BASF SE: Company Snapshot
Figure 45 BASF SE: SWOT Analysis
Figure 46 Songwon Industrial Co. Ltd: Company Snapshot
Figure 47 Songwon Industrial Co. Ltd : SWOT Analysis
Figure 48 Cytec Solvay Group: Company Snapshot
Figure 49 Cytec Solvay Group : SWOT Analysis
Figure 50 Clariant: Company Snapshot
Figure 51 Clariant: SWOT Analysis
Figure 52 Clariant: SWOT Analysis
Figure 53 Adeka Corporation: Company Snapshot
Figure 54 Akzonobel: Company Snapshot
Figure 55 Altana AG: Company Snapshot
Figure 56 Amcor: Company Snapshot
Figure 57 E.I. Du Pont De Nemours and Company: Company Snapshot


Growth opportunities and latent adjacency in Packaging Additives (Functional Additives and Barrier Coatings) Market