Geotextile Market by Material Type (Synthetic, Natural), Product Type (Nonwoven, Woven, Knitted), Application (Road Construction and Pavement Repair, Erosion, Drainage, Railway Work, Agriculture), and Region - Global Forecast to 2022


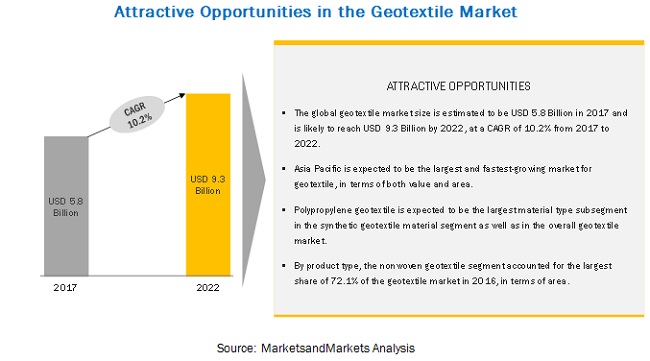
[102 Pages Report] MarketsandMarkets forecasts the Geotextile market to grow from USD 5.8 billion in 2017 to USD 9.4 billion by 2022, at a Compound Annual Growth Rate (CAGR) of 10.2% during the forecast period. Superior properties, low cost, high demand in road construction, and growing infrastructure activities in emerging economies are the key factors driving the geotextile market globally.
By application, Road Construction and Pavement Repair is the largest segment of the geotextile market
Road construction and pavement repair is the largest segment of the geotextile market, by application. Geotextiles have proven to be the optimum solution for ground stabilization problems, increasing pavement life, repair and rehabilitation of highways, cost control, and better lifespan of roads. Hence, there is a high demand of geotextile by this application segment.
By product type, Nonwoven Geotextile is the largest segment of the geotextile market
The nonwoven geotextile segment is expected to account for the largest share of the geotextile market in 2016. This large share is mainly attributed to the material being cost-effective and the key functional properties which make it a preferred material especially for the construction industry.
By material type, Synthetic Geotextile is the largest segment of the geotextile market
Synthetic geotextile is the largest material type segment of the geotextile market. Within the synthetic geotextile segment, polypropylene is cheaper in comparison to other raw material, which makes it a preferred material especially for the applications in the construction industry.
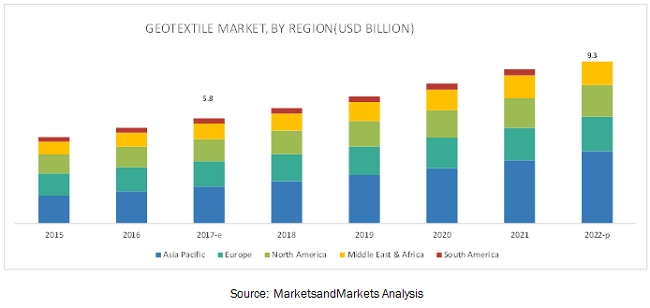
Asia Pacific is expected to lead the geotextile market during the forecast period.
Asia Pacific is expected to lead the global geotextile market during the forecast period. The growth of the Asia Pacific geotextile market is mainly driven by the rising infrastructure activities especially in ASEAN countries apart from India and China. The geotextile market in the Asia Pacific region is expected to grow at the highest CAGR from 2017 to 2022.
Market Dynamics
Driver: High demand for geotextiles in road construction
From major motorways to haul roads, geotextiles have proven to be the optimum solution for ground stabilization problems, increasing pavement life, repair and rehabilitation of highways, cost control, and better lifespan of roads. Geotextiles are one of the basic materials used in the construction of roads, highways, flyovers, bridges, and pavements for filtration and separation functions as they help prevent migration and mingling of materials and allow free movement of water. Thus, geotextiles are emerging as an alternative for concrete in the road industry.
Pavement and road damage is mainly caused due to the contamination of the aggregate base which results in loss of aggregate strength. Continuous vehicle pressure over time can cause subgrade soils to migrate into the aggregate base. This significantly reduces the effective aggregate thickness, destroying the road support and reducing roadway performance and life. The road tends to lose its strength mainly due to the soil beneath the road being very silty, or traffic load causing the soil to become wet and mucky. Although the subgrade may be reinforced with a base course of gravel, water moving upward carries soil fines or silt particles into the gravel, reducing its strength. Geotextiles are widely used to stabilize roads through separation and drainage. They help keep the layers of subgrade and base materials separate and manage water movement through or off the roadbed.
Restraint: Volatile raw material prices affect the demand for synthetic geotextiles
Geotextiles are manufactured using synthetic fibers such as polypropylene, polyester, and polyethylene and natural fibers like jute, coir, and ramie. Any change in the demand and supply of these raw materials could have a significant impact on the geotextile industry. The materials of synthetic fibers are derived from crude oil, thus the increase in prices of crude oil results in price hike of raw materials, hence impacting the geotextile industry. The fluctuations in prices of the raw materials also affect the operating margins of manufacturers, which, in turn, makes it difficult for them to sustain in the global geotextile market.
Opportunity: Growing consumption of bio-based geotextiles
Bio-based geotextiles are made from various bio-based materials such as agricultural products and waste streams. Maize-based PLA geotextiles, sheep wool erosion mats, and straw and coconut erosion mats are examples of bio-based geotextiles. Resource efficiency and reduction/elimination of Greenhouse Gas (GHG) emissions are some of the key advantages of bio-based geotextiles. These materials are light in weight, thus reducing application and transportation costs.
Jute is the most widely consumed type of natural geotextile in the global market due to its abundant availability and renewable nature. Jute geotextile enhances soil nutrition and is less expensive as compared to other natural geotextiles. Other advantages of jute are its high moisture-absorbing capacity, excellent drapability, high initial tensile strength, low extension at break, high spin ability, and biddability. The characteristics of jute geotextile such as flexibility and high moisture absorption capacity have made it a preferred material in the civil engineering field.
Challenge: Limited technical knowledge and expertise about geotextiles in emerging economies
As the use of geotextiles in infrastructural development is prevalent in developed countries, civil engineers in such regions have considerable insight about geotextile. However, in developing countries, the level of awareness is low, and construction standards do not have geotextile as a basic construction material.
Get online access to the report on the World's First Market Intelligence Cloud
- Easy to Download Historical Data & Forecast Numbers
- Company Analysis Dashboard for high growth potential opportunities
- Research Analyst Access for customization & queries
- Competitor Analysis with Interactive dashboard
- Latest News, Updates & Trend analysis
Request Sample Scope of the Report
Get online access to the report on the World's First Market Intelligence Cloud
- Easy to Download Historical Data & Forecast Numbers
- Company Analysis Dashboard for high growth potential opportunities
- Research Analyst Access for customization & queries
- Competitor Analysis with Interactive dashboard
- Latest News, Updates & Trend analysis

|
Report Metric |
Details |
|
Market size available for years |
2016�2022 |
|
Base year considered |
2016 |
|
Forecast period |
2017�2022 |
|
Forecast units |
Billion (USD) |
|
Segments covered |
Material Type (Synthetic, Natural), Product Type (Nonwoven Geotextile, Woven Geotextile, Knitted Geotextile), Application (Road construction and pavement repair, Erosion, Drainage, Railway work, Agriculture, Others) |
|
Geographies covered |
North America, Europe, Asia Pacific, Middle East & Africa, and South America |
|
Companies covered |
BASF SE (Germany), Covestro (Germany), Solvay SA (Belgium), Celanese (US), DowDuPont (US), LG Chem (South Korea), SABIC (Saudi Arabia), Evonik Industries (Germany), Lanxess (Germany), and Mitsubishi Geotextile (Japan) and 16 others |
The research report categorizes the Geotextile to forecast the revenues and analyze the trends in each of the following sub-segments:
Geotextile Market by Material Type
- Synthetic
- Polypropylene
- Polyester (PET)
- Polyethylene
- Others
- Polyamide
- Polyvinyl Chloride
- Natural
- Jute
- Others
- Coir
- Ramie
Geotextile Market by Product Type
- Nonwoven Geotextile
- Woven Geotextile
- Knitted Geotextile
Geotextile Market by Application
- Road construction and pavement repair
- Erosion
- Drainage
- Railway work
- Agriculture
- Others
- Sports field construction
- Retaining walls
Geotextile Market by Region
- North America
- Europe
- Asia Pacific
- Middle East and Africa
- South America
Key Market Players
Koninklijke TenCate (Netherlands), Low & Bonar (UK), Fibertex Nonwovens (Denmark), Thrace Group (Greece), Huesker (Germany), Berry Global (US), DuPont (US), Strata Systems (US), Leggett & Platt (US), Officine Maccaferri (Italy), GSE Environmental (US), Kaytech (South Africa), Mattex (Saudi Arabia), NAUE (Germany), Propex Operating Company (US), Carthage Mills (US), and Asahi Kasei Advance Corporation (Japan), among others.
Recent Developments
- In September 2017, HUESKER Russia started production at its Klin facility (Russia). The new facility is spread across approximately 5,000 m� and is engaged in the production of tried-and-tested geotextiles such as HaTelit, Basetrac, and Stabilenka. With this development, the company further strengthened its position in the European market.
- In August 2017, Fibertex signed a supply agreement to supply 1,500,000 m2 of the Controlled Permeability Formwork (CPF Liner) Formtex for the construction of one of the world's largest bridge project in Kuwait. With this development, the company strengthened its presence further in the Middle East.
- In January 2017, Hanes Geo Components, a subsidiary of Leggett & Platt, signed an agreement to acquire Terrafix Geosynthetics Inc (Canada). Terrafix is a leading distributor of geosynthetic products in Canada. This acquisition is in line with the strategy of the company to develop a North American distribution network for geotextile and erosion control products.
- In June 2016, Hanes Geo Components, a subsidiary of Leggett & Platt, signed an agreement to acquire Terrafix Geosynthetics Inc (Canada). Terrafix is a leading distributor of geosynthetic products in Canada. This acquisition is in line with the strategy of the company to develop a North American distribution network for geotextile and erosion control products.
- In January 2016, Low & Bonar launched an innovative concrete reinforcement fiber, Durus S500. The new fiber significantly outperforms conventional products and is characterized by its enhanced bond within the concrete. With this launch, the company further improved its product portfolio for civil engineering products while maximizing construction speed.
Critical questions the report answers:
- Where will all these developments take the industry in the long term?
- What are the upcoming trends for the Geotextile market?
- Which segment provides the most opportunity for growth?
- Who are the leading vendors operating in this market?
- What are the opportunities for new market entrants?
To speak to our analyst for a discussion on the above findings, click Speak to Analyst
Table of Contents
1 Introduction (Page No. - 20)
1.1 Objectives of the Study
1.2 Market Definition
1.3 Market Scope
1.3.1 Years Considered for the Study
1.4 Currency
1.5 Stakeholders
1.6 Units Considered for the Study
1.7 Limitations
2 Research Methodology (Page No. - 23)
2.1 Research Data
2.1.1 Secondary Data
2.1.1.1 Key Data From Secondary Sources
2.1.2 Primary Data
2.1.2.1 Key Data From Primary Sources
2.1.2.2 Key Industry Insights
2.1.2.3 Breakdown of Primary Interviews
2.2 Market Size Estimation
2.3 Data Triangulation
2.4 Assumptions
3 Executive Summary (Page No. - 31)
4 Premium Insights (Page No. - 36)
4.1 Attractive Opportunities in the Geotextile Market
4.2 Geotextile Market, By Material Type
4.3 Geotextile Market, By Product Type
4.4 Geotextile Market, By Application
4.5 Geotextile Market, By Region
5 Market Overview (Page No. - 40)
5.1 Introduction
5.2 Market Dynamics
5.2.1 Drivers
5.2.1.1 Rising Demand for Geotextiles Due to Superior Properties and Cost Savings
5.2.1.2 High Demand for Geotextiles in Road Construction
5.2.1.3 Growing Infrastructure Activities in Emerging Economies
5.2.2 Restraints
5.2.2.1 Volatile Raw Material Prices Affect the Demand for Synthetic Geotextiles
5.2.3 Opportunities
5.2.3.1 Growing Consumption of Bio-Based Geotextiles
5.2.3.2 Growing Investments in Nonwoven Geotextile
5.2.4 Challenges
5.2.4.1 Limited Technical Knowledge and Expertise About Geotextiles in Emerging Economies
5.2.4.2 Lack of Quality Control Across Developing Countries
5.3 Porter�s Five Forces Analysis
5.3.1 Bargaining Power of Suppliers
5.3.2 Bargaining Power of Buyers
5.3.3 Threat of Substitutes
5.3.4 Threat of New Entrants
5.3.5 Intensity of Rivalry
5.4 Economic Indicators
5.4.1 Construction Industry Outlook
6 Geotextile Market, By Material Type (Page No. - 50)
6.1 Introduction
6.2 Synthetic Geotextile
6.2.1 Polypropylene Geotextile
6.2.2 Polyester (Pet) Geotextile
6.2.3 Polyethylene Geotextile
6.2.4 Others
6.2.4.1 Polyamide
6.2.4.2 Polyvinyl Chloride (PVC)
6.3 Natural Geotextile
6.3.1 Jute Geotextile
6.3.2 Others
6.3.2.1 Ramie
6.3.2.2 Coir
7 Geotextile Market, By Product Type (Page No. - 67)
7.1 Introduction
7.2 Nonwoven Geotextile
7.2.1 Needle-Punched Nonwoven Geotextile
7.2.2 Heat-Bonded Nonwoven Geotextile
7.3 Woven Geotextile
7.3.1 Slit-Film Woven Geotextile
7.3.2 Monofilament Woven Geotextile
7.3.3 Multifilament Woven Geotextile
7.4 Knitted Geotextile
7.4.1 Classical Knits
7.4.2 Insertion Knits
8 Geotextile Market, By Application (Page No. - 76)
8.1 Introduction
8.2 Road Construction and Pavement Repair
8.3 Erosion Control
8.4 Drainage
8.5 Railway Work
8.6 Agriculture
8.7 Others
9 Regional Analysis (Page No. - 90)
9.1 Introduction
9.2 Asia Pacific
9.2.1 China
9.2.2 Japan
9.2.3 India
9.2.4 South Korea
9.2.5 Australia
9.2.6 Rest of Asia Pacific
9.3 Europe
9.3.1 Germany
9.3.2 UK
9.3.3 France
9.3.4 Italy
9.3.5 Russia
9.3.6 Rest of Europe
9.4 North America
9.4.1 US
9.4.2 Canada
9.4.3 Mexico
9.5 Middle East & Africa
9.5.1 Saudi Arabia
9.5.2 UAE
9.5.3 Qatar
9.5.4 South Africa
9.5.5 Nigeria
9.5.6 Rest of Middle East & Africa
9.6 South America
9.6.1 Brazil
9.6.2 Argentina
9.6.3 Rest of South America
10 Company Landscape (Page No. - 152)
10.1 Company Ranking
11 Company Profiles (Page No. - 153)
(Business Overview, Products Offered, Scorecard of Product Offering, Scorecard of Business Strategy, and New Product Launch)
11.1 Gse Environmental
11.2 Low & Bonar
11.3 Koninklijke Ten Cate
11.4 Fibertex Nonwovens
11.5 Thrace Group
11.6 Huesker
11.7 Officine Maccaferri
11.8 Strata Systems
11.9 Leggett & Platt
11.10 Berry Global
11.11 Agru America
11.12 Dupont
11.13 Mada Nonwovens
11.14 Kaytech
11.15 Mattex
11.16 Asahi Kasei Advance Corporation
11.17 Other Key Players in the Geotextile Market
11.17.1 Belton Industries
11.17.2 Exeed Industries
11.17.3 Tenax
11.17.4 HOV Environment Solutions
11.17.5 Nilex
11.17.6 Propex Operating Company
11.17.7 NAUE
11.17.8 Contech Engineered Solutions
11.17.9 Carthage Mills
11.17.10 Cha Technologies Group
11.17.11 Ofertex
11.17.12 Daeyoun Geotech
*Details Might Not Be Captured in Case of Unlisted Companies
12 Appendix (Page No. - 194)
12.1 Discussion Guide
12.2 Knowledge Store: Marketsandmarkets Subscription Portal
12.3 Introducing RT: Real Time Market Intelligence
12.4 Available Customizations
12.5 Related Reports
12.6 Author Details
List of Tables (209 Tables)
Table 1 Geotextile Market Snapshot
Table 2 Geotextile Market, By Material Type, 2015�2022 (USD Million)
Table 3 Geotextile Market, By Material Type, 2015�2022 (Million Square Meter)
Table 4 Properties Comparison of Different Synthetic Geotextile Materials
Table 5 Synthetic Geotextile Market, By Region, 2015�2022 (USD Million)
Table 6 Synthetic Geotextile Market, By Region, 2015�2022 (Million Square Meter)
Table 7 Synthetic Geotextile Market, By Material Type, 2015�2022 (USD Million)
Table 8 Geotextile Market, By Material Type, 2015�2022 (Million Square Meter)
Table 9 Polypropylene Properties
Table 10 Testing Standards for Polypropylene Geotextile
Table 11 Polypropylene Geotextile Market, By Region, 2015�2022 (USD Million)
Table 12 Polypropylene Geotextile Market, By Region, 2015�2022 (Million Square Meter)
Table 13 Polyester (Pet) Geotextile Market, By Region, 2015�2022 (USD Million)
Table 14 Polyester (Pet) Geotextile Market, By Region, 2015�2022 (Million Square Meter)
Table 15 Polyethylene Geotextile Market, By Region, 2015�2022 (USD Million)
Table 16 Polyethylene Geotextile Market, By Region, 2015�2022 (Million Square Meter)
Table 17 Other Synthetic Material Types Geotextile Market, By Region, 2015�2022 (USD Million)
Table 18 Other Synthetic Material Types Geotextile Market, By Region, 2015�2022 (Million Square Meter)
Table 19 Natural Geotextile Market, By Region, 2015�2022 (USD Million)
Table 20 Natural Geotextile Market, By Region, 2015�2022 (Million Square Meter)
Table 21 Natural Geotextile Market, By Material Type, 2015�2022 (USD Million)
Table 22 Natural Geotextile Market, By Material Type, 2015�2022 (Million Square Meter)
Table 23 Jute Geotextile Market, By Region, 2015�2022 (USD Million)
Table 24 Jute Geotextile Market, By Region, 2015�2022 (Million Square Meter)
Table 25 Other Natural Geotextile Market, By Region, 2015�2022 (USD Million)
Table 26 Other Natural Geotextile Market, By Region, 2015�2022 (Million Square Meter)
Table 27 Geotextile Market, By Product Type, 2015�2022 (USD Million)
Table 28 Geotextile Market, By Product Type, 2015�2022 (Million Square Meter)
Table 29 Comparison of Types of Nonwoven Geotextiles
Table 30 Nonwoven Geotextile Market, By Region, 2015�2022 (USD Million)
Table 31 Nonwoven Geotextile Market, By Region, 2015�2022 (Million Square Meter)
Table 32 Woven Geotextile Market, By Region, 2015�2022 (USD Million)
Table 33 Woven Geotextile Market, By Region, 2015�2022 (Million Square Meter)
Table 34 Knitted Geotextile Market, By Region, 2015�2022 (USD Million)
Table 35 Knitted Geotextile Market, By Region, 2015�2022 (Million Square Meter)
Table 36 Largest Construction Projects Across the Globe
Table 37 Functions of Geotextile
Table 38 Geotextile Market, By Application, 2015�2022 (USD Million)
Table 39 Geotextile Market, By Application, 2015�2022 (Million Square Meter)
Table 40 Geotextile Market in Road Construction and Pavement Repair, By Region, 2015�2022 (USD Million)
Table 41 Geotextile Market in Road Construction and Pavement Repair, By Region, 2015�2022 (Million Square Meter)
Table 42 Geotextile Market in Erosion Control, By Region, 2015�2022 (USD Million)
Table 43 Geotextile Market in Erosion Control, By Region, 2015�2022 (Million Square Meter)
Table 44 Geotextile Market in Drainage, By Region, 2015�2022 (USD Million)
Table 45 Geotextile Market in Drainage, By Region, 2015�2022 (Million Square Meter)
Table 46 Geotextile Market in Railway Work, By Region, 2015�2022 (USD Million)
Table 47 Geotextile Market in Railway Work, By Region, 2015�2022 (Million Square Meter)
Table 48 Geotextile Market in Agriculture, By Region, 2015�2022 (USD Million)
Table 49 Geotextile Market in Agriculture, By Region, 2015�2022 (Million Square Meter)
Table 50 Geotextile Market in Others, By Region, 2015�2022 (USD Million)
Table 51 Geotextile Market in Others, By Region, 2015�2022 (Million Square Meter)
Table 52 Geotextile Market, By Region, 2015�2022 (USD Million)
Table 53 Geotextile Market, By Region, 2015�2022 (Million Square Meter)
Table 54 Asia Pacific Geotextile Market, By Country, 2015�2022 (USD Million)
Table 55 Asia Pacific Geotextile Market, By Country, 2015�2022 (Million Square Meter)
Table 56 Asia Pacific Geotextile Market, By Product Type, 2015�2022 (USD Million)
Table 57 Asia Pacific Geotextile Market, By Product Type, 2015�2022 (Million Square Meter)
Table 58 Asia Pacific Geotextile Market, By Material Type, 2015�2022 (USD Million)
Table 59 Asia Pacific Geotextile Market, By Material Type, 2015�2022 (Million Square Meter)
Table 60 Asia Pacific: Synthetic Geotextile Segment, By Type, 2015�2022 (Million Square Meter)
Table 61 Asia Pacific: Synthetic Geotextile Segment, By Type, 2015�2022 (USD Million)
Table 62 Asia Pacific: Natural Geotextile Segment, By Type, 2015�2022 (USD Million)
Table 63 Asia Pacific: Natural Geotextile Segment, By Type, 2015�2022 (Million Square Meter)
Table 64 Asia Pacific Geotextile Market, By Application, 2015�2022 (USD Million)
Table 65 Asia Pacific Geotextile Market, By Application, 2015�2022 (Million Square Meter)
Table 66 China Geotextile Market, By Application, 2015�2022 (USD Million)
Table 67 China Geotextile Market, By Application, 2015�2022 (Million Square Meter)
Table 68 China Geotextile Market, By Product Type, 2015�2022 (USD Million)
Table 69 China Geotextile Market, By Product Type, 2015�2022 (Million Square Meter)
Table 70 Japan Geotextile Market, By Application, 2015�2022 (USD Million)
Table 71 Japan Geotextile Market, By Application, 2015�2022 (Million Square Meter)
Table 72 Japan Geotextile Market, By Product Type, 2015�2022 (USD Million)
Table 73 Japan Geotextile Market, By Product Type, 2015�2022 (Million Square Meter)
Table 74 India Geotextile Market, By Application, 2015�2022 (USD Million)
Table 75 India Geotextile Market, By Application, 2015�2022 (Million Square Meter)
Table 76 India Geotextile Market, By Product Type, 2015�2022 (USD Million)
Table 77 India Geotextile Market, By Product Type, 2015�2022 (Million Square Meter)
Table 78 South Korea Geotextile Market, By Application, 2015�2022 (USD Million)
Table 79 South Korea Geotextile Market, By Application, 2015�2022 (Million Square Meter)
Table 80 South Korea Geotextile Market, By Product Type, 2015�2022 (USD Million)
Table 81 South Korea Geotextile Market, By Product Type, 2015�2022 (Million Square Meter)
Table 82 Australia Geotextile Market, By Application, 2015�2022 (USD Million)
Table 83 Australia Geotextile Market, By Application, 2015�2022 (Million Square Meter)
Table 84 Australia Geotextile Market, By Product Type, 2015�2022 (USD Million)
Table 85 Australia Geotextile Market, By Product Type, 2015�2022 (Million Square Meter)
Table 86 Rest of Asia Pacific Geotextile Market, By Application, 2015�2022 (USD Million)
Table 87 Rest of Asia Pacific Geotextile Market, By Application, 2015�2022 (Million Square Meter)
Table 88 Rest of Asia Pacific Geotextile Market, By Product Type, 2015�2022 (USD Million)
Table 89 Rest of Asia Pacific Geotextile Market, By Product Type, 2015�2022 (Million Square Meter)
Table 90 Europe Geotextile Market, By Country, 2015�2022 (USD Million)
Table 91 Europe Geotextile Market, By Country, 2015�2022 (Million Square Meter)
Table 92 Europe Geotextile Market, By Product Type, 2015�2022 (USD Million)
Table 93 Europe Geotextile Market, By Product Type, 2015�2022 (Million Square Meter)
Table 94 Europe Geotextile Market, By Material Type, 2015�2022 (USD Million)
Table 95 Europe Geotextile Market, By Material Type, 2015�2022 (Million Square Meter)
Table 96 Europe: Synthetic Geotextile Segment, By Type, 2015�2022 (USD Million)
Table 97 Europe: Synthetic Geotextile Segment, By Type, 2015�2022 (Million Square Meter)
Table 98 Europe: Natural Geotextile Segment, By Type, 2015�2022 (USD Million)
Table 99 Europe: Natural Geotextile Segment, By Type, 2015�2022 (Million Square Meter)
Table 100 Europe Geotextile Market, By Application, 2015�2022 (USD Million)
Table 101 Europe Geotextile Market, By Application, 2015�2022 (Million Square Meter)
Table 102 Germany Geotextile Market, By Application, 2015�2022 (USD Million)
Table 103 Germany Geotextile Market, By Application, 2015�2022 (Million Square Meter)
Table 104 Germany Geotextile Market, By Product Type, 2015�2022 (USD Million)
Table 105 Germany By Market, By Product Type, 2015�2022 (Million Square Meter)
Table 106 UK Geotextile Market, By Application, 2015�2022 (USD Million)
Table 107 UK Geotextile Market, By Application, 2015�2022 (Million Square Meter)
Table 108 UK Geotextile Market, By Product Type, 2015�2022 (USD Million)
Table 109 UK Geotextile Market, By Product Type, 2015�2022 (Million Square Meter)
Table 110 France Geotextile Market, By Application, 2015�2022 (USD Million)
Table 111 France Geotextile Market, By Application, 2015�2022 (Million Square Meter)
Table 112 France Geotextile Market, By Product Type, 2015�2022 (USD Million)
Table 113 France Geotextile Market, By Product Type, 2015�2022 (Million Square Meter)
Table 114 Italy Geotextile Market, By Application, 2015�2022 (USD Million)
Table 115 Italy Geotextile Market, By Application, 2015�2022 (Million Square Meter)
Table 116 Italy Geotextile Market, By Product Type, 2015�2022 (USD Million)
Table 117 Italy By Market, By Product Type, 2015�2022 (Million Square Meter)
Table 118 Russia Geotextile Market, By Application, 2015�2022 (USD Million)
Table 119 Russia Geotextile Market, By Application, 2015�2022 (Million Square Meter)
Table 120 Russia Geotextile Market, By Product Type, 2015�2022 (USD Million)
Table 121 Russia By Market, By Product Type, 2015�2022 (Million Square Meter)
Table 122 Rest of Europe Geotextile Market, By Application, 2015�2022 (USD Million)
Table 123 Rest of Europe Geotextile Market, By Application, 2015�2022 (Million Square Meter)
Table 124 Rest of Europe Geotextile Market, By Product Type, 2015�2022 (USD Million)
Table 125 Rest of Europe Geotextile Market, By Product Type, 2015�2022 (Million Square Meter)
Table 126 North America Geotextile Market, By Country, 2015-2022 (USD Million)
Table 127 North America Geotextile Market, By Country, 2015�2022 (Million Square Meter)
Table 128 North America Geotextile Market, By Product Type, 2015-2022 (USD Million)
Table 129 North America Geotextile Market, By Product Type, 2015-2022 (Million Square Meter)
Table 130 North America By Market, By Material Type, 2015�2022 (USD Million)
Table 131 North America By Market, By Material Type, 2015�2022 (Million Square Meter)
Table 132 North America: Synthetic Geotextile Segment, By Type, 2015�2022 (USD Million)
Table 133 North America: Synthetic Geotextile Segment, By Type, 2015�2022 (Million Square Meter)
Table 134 North America: Natural Geotextile Segment, By Type, 2015�2022 (USD Million)
Table 135 North America: Natural Geotextile Segment, By Type, 2015�2022 (Million Square Meter)
Table 136 North America Geotextile Market, By Application, 2015-2022 (USD Million)
Table 137 North America Geotextile Market, By Application, 2015�2022 (Million Square Meter)
Table 138 US Geotextile Market, By Application, 2015-2022 (USD Million)
Table 139 US Geotextile Market, By Application, 2015�2022 (Million Square Meter)
Table 140 US Geotextile Market, By Product Type, 2015�2022 (USD Million)
Table 141 US Geotextile Market, By Product Type, 2015�2022 (Million Square Meter)
Table 142 Canada Geotextile Market, By Application, 2015-2022 (USD Million)
Table 143 Canada Geotextile Market, By Application, 2015�2022 (Million Square Meter)
Table 144 Canada Geotextile Market, By Product Type, 2015�2022 (USD Million)
Table 145 Canada Geotextile Market, By Product Type, 2015�2022 (Million Square Meter)
Table 146 Mexico Geotextile Market, By Application, 2015-2022 (USD Million)
Table 147 Mexico Geotextile Market, By Application, 2015�2022 (Million Square Meter)
Table 148 Mexico Geotextile Market, By Product Type, 2015�2022 (USD Million)
Table 149 Mexico Geotextile Market, By Product Type, 2015�2022 (Million Square Meter)
Table 150 Middle East & Africa Geotextile Market, By Country, 2015�2022 (USD Million)
Table 151 Middle East & Africa Geotextile Market, By Country, 2015�2022 (Million Square Meter)
Table 152 Middle East & Africa Geotextile Market, By Product Type, 2015�2022 (USD Million)
Table 153 Middle East & Africa Geotextile Market, By Product Type, 2015�2022 (Million Square Meter)
Table 154 Middle East & Africa Geotextile Market, By Material Type, 2015�2022 (USD Million)
Table 155 Middle East & Africa Geotextile Market, By Material Type, 2015�2022 (Million Square Meter)
Table 156 Middle East & Africa: Synthetic Geotextile Segment, By Type, 2015�2022 (USD Million)
Table 157 Middle East & Africa: Synthetic Geotextile Segment, By Type, 2015�2022 (Million Square Meter)
Table 158 Middle East & Africa: Natural Geotextile Segment, By Type, 2015�2022 (USD Million)
Table 159 Middle East & Africa: Natural Geotextile Segment, By Type, 2015�2022 (Million Square Meter)
Table 160 Middle East & Africa By Market, By Application, 2015�2022 (USD Million)
Table 161 Middle East & Africa By Market, By Application, 2015�2022 (Million Square Meter)
Table 162 Saudi Arabia Geotextile Market, By Application, 2015-2022 (USD Million)
Table 163 Saudi Arabia By Market, By Application, 2015�2022 (Million Square Meter)
Table 164 Saudi Arabia By Market, By Product Type, 2015�2022 (USD Million)
Table 165 Saudi Arabia By Market, By Product Type, 2015�2022 (Million Square Meter)
Table 166 UAE Geotextile Market, By Application, 2015-2022 (USD Million)
Table 167 UAE By Market, By Application, 2015�2022 (Million Square Meter)
Table 168 UAE By Market, By Product Type, 2015�2022 (USD Million)
Table 169 UAE By Market, By Product Type, 2015�2022 (Million Square Meter)
Table 170 Qatar Geotextile Market, By Application, 2015-2022 (USD Million)
Table 171 Qatar By Market, By Application, 2015�2022 (Million Square Meter)
Table 172 Qatar By Market, By Product Type, 2015�2022 (USD Million)
Table 173 Qatar By Market, By Product Type, 2015�2022 (Million Square Meter)
Table 174 South Africa Geotextile Market, By Application, 2015-2022 (USD Million)
Table 175 South Africa By Market, By Application, 2015�2022 (Million Square Meter)
Table 176 South Africa By Market, By Product Type, 2015�2022 (USD Million)
Table 177 South Africa By Market, By Product Type, 2015�2022 (Million Square Meter)
Table 178 Nigeria Geotextile Market, By Application, 2015-2022 (USD Million)
Table 179 Nigeria By Market, By Application, 2015�2022 (Million Square Meter)
Table 180 Nigeria By Market, By Product Type, 2015�2022 (USD Million)
Table 181 Nigeria By Market, By Product Type, 2015�2022 (Million Square Meter)
Table 182 Rest of Middle East & Africa Geotextile Market, By Application, 2015-2022 (USD Million)
Table 183 Rest of Middle East & Africa By Market, By Application, 2015�2022 (Million Square Meter)
Table 184 Rest of Middle East & Africa By Market, By Product Type, 2015�2022 (USD Million)
Table 185 Rest of Middle East & Africa By Market, By Product Type, 2015�2022 (Million Square Meter)
Table 186 South America Geotextile Market, By Country, 2015�2022 (USD Million)
Table 187 South America By Market, By Country, 2015�2022 (Million Square Meter)
Table 188 South America By Market, By Product Type, 2015�2022 (USD Million)
Table 189 South America By Market, By Product Type, 2015�2022 (Million Square Meter)
Table 190 South America By Market, By Material Type, 2015�2022 (USD Million)
Table 191 South America By Market, By Material Type, 2015�2022 (Million Square Meter)
Table 192 South America: Synthetic Geotextile Segment, By Type, 2015�2022 (USD Million)
Table 193 South America: Synthetic Geotextile Segment, By Type, 2015�2022 (Million Square Meter)
Table 194 South America: Natural Geotextile Segment, By Type, 2015�2022 (USD Million)
Table 195 South America: Natural Geotextile Segment, By Type, 2015�2022 (Million Square Meter)
Table 196 South America Geotextile Market, By Application, 2015�2022 (USD Million)
Table 197 South America By Market, By Application, 2015�2022 (Million Square Meter)
Table 198 Brazil Geotextile Market, By Application, 2015�2022 (USD Million)
Table 199 Brazil Geotextile Market, By Application, 2015-2022 (Million Square Meter)
Table 200 Brazil Geotextile Market, By Product Type, 2015�2022 (USD Million)
Table 201 Brazil By Market, By Product Type, 2015-2022 (Million Square Meter)
Table 202 Argentina Geotextile Market, By Application, 2015�2022 (USD Million)
Table 203 Argentina Geotextile Market, By Application, 2015-2022 (Million Square Meter)
Table 204 Argentina Geotextile Market, By Product Type, 2015�2022 (USD Million)
Table 205 Argentina Geotextile Market, By Product Type, 2015-2022 (Million Square Meter)
Table 206 Rest of South America Geotextile Market, By Application, 2015�2022 (USD Million)
Table 207 Rest of South America Geotextile Market, By Application, 2015-2022 (Million Square Meter)
Table 208 Rest of South America Geotextile Market, By Product Type, 2015�2022 (USD Million)
Table 209 Rest of South America Geotextile Market, By Product Type, 2015-2022 (Million Square Meter)
List of Figures (56 Figures)
Figure 1 Geotextile Market: Research Design
Figure 2 Bottom-Up Approach
Figure 3 Top-Down Approach
Figure 4 Geotextile Market: Data Triangulation
Figure 5 Nonwoven Geotextile Expected to Be the Largest Product Type Segment in 2017
Figure 6 Synthetic Geotextile is Expected to Be the Largest Material Type Segment in 2017
Figure 7 Road Construction and Pavement Repair is Expected to Be the Largest Application Segment in 2017
Figure 8 Asia Pacific is Expected to Be the Largest Geotextile Market in 2017
Figure 9 Growing Road and Highway Construction Activities in the Emerging Countries Offers Lucrative Opportunities for the Market Players
Figure 10 Synthetic Geotextile Segment is Expected to Be the Fastest-Growing Material Type Segment During the Forecast Period
Figure 11 Nonwoven Geotextile is Expected to Be the Fastest-Growing Segment During the Forecast Period
Figure 12 Road Construction and Pavement Repair is Expected to Be the Fastest-Growing Application Segment During the Forecast Period
Figure 13 Geotextile Market in Asia Pacific is Expected to Grow at the Highest CAGR During the Forecast Period
Figure 14 Key Characteristics of Geotextiles
Figure 15 Geotextile Market Dynamics
Figure 16 Geotextile Market: Porter�s Five Forces Analysis
Figure 17 Regional Infrastructure Investment Needs: 2016 � 2040 (USD Billion)
Figure 18 Comparison of Infrastructure Investment Forecast By Sector, 2016 � 2040 (USD Billion)
Figure 19 Geotextile Market Overview, By Material Type
Figure 20 Synthetic Geotextile Market, 2017-2022 (Million Square Meter)
Figure 21 Synthetic Geotextile Market, By Material Type Overview 2017-2022 (Million Square Meter)
Figure 22 Polypropylene Geotextile Market, 2017-2022 (Million Square Meter)
Figure 23 Polyester (Pet) Geotextile Market, 2017-2022 (Million Square Meter)
Figure 24 Polyethylene Geotextile Market, 2017-2022 (Million Square Meter)
Figure 25 Other Material Types Geotextile Market, 2017-2022 (Million Square Meter)
Figure 26 Natural Geotextile Market, 2017-2022 (Million Square Meter)
Figure 27 Natural Geotextile Market, By Material Type Overview 2017-2022 (Million Square Meter)
Figure 28 Jute Geotextile Market, 2017-2022 (Million Square Meter)
Figure 29 Other Natural Geotextile Market, 2017-2022 (USD Million)
Figure 30 Geotextile Market Overview, By Product Type
Figure 31 Nonwoven Geotextile Manufacturing Process Overview
Figure 32 Nonwoven Geotextile Market, 2017-2022 (USD Million)
Figure 33 Woven Geotextile Manufacturing Process Overview
Figure 34 Woven Geotextile Market, 2017-2022 (USD Million)
Figure 35 Knitted Geotextile Manufacturing Process Overview
Figure 36 Knitted Geotextile Market, 2017-2022 (USD Million)
Figure 37 Geotextile Market, By Application
Figure 38 Geotextile Market in Road Construction and Pavement Repair, 2017-2022 (USD Million)
Figure 39 Geotextile Market in Erosion Control, 2017-2022 (USD Million)
Figure 40 Geotextile Market in Drainage, 2017-2022 (USD Million)
Figure 41 Geotextile Market in Railway Work, 2017-2022 (USD Million)
Figure 42 Geotextile Market in Agriculture, 2017-2022 (USD Million)
Figure 43 Geotextile Market in Others, 2017-2022 (USD Million)
Figure 44 China and India are Expected to Be the Fastest-Growing Markets for Geotextile
Figure 45 Asia Pacific Geotextile Market Snapshot
Figure 46 Europe Geotextile Market Snapshot
Figure 47 North America Geotextile Market Snapshot
Figure 48 Middle East & Africa Geotextile Market Snapshot
Figure 49 South America Geotextile Market Snapshot
Figure 50 Tencate Accounted for the Leading Position in the Geotextile Market
Figure 51 Low & Bonar: Company Snapshot
Figure 52 Koninklijke Ten Cate: Company Snapshot
Figure 53 Thrace Group: Company Snapshot
Figure 54 Leggett & Platt: Company Snapshot
Figure 55 Berry Global: Company Snapshot
Figure 56 Dupont: Company Snapshot


Growth opportunities and latent adjacency in Geotextile Market
Information on importers garments, bedding, curtains, table-cloths etc in India
Geotextiles Market
Interested in understanding Geoxtextile Market report
Market information on global geotextile market by application
General information on cellulose materials and its applications
General information on circular economy and global trends in non-woven fabric market
Market trends of Global PP/PE woven Geo-textile fabric
Information on Indian Woven and Nonwoven Geosynthetics market, market estimation and forecast
Application of geosynthetics in south America an Africa
Information on Geo textile fabric in Indian and Global market.
General information on geotextiles
Information and analysis on Geotextile market scenario in India, share of market by product, projected demand, global policies stimulating growth.
Looking for insights and market size of Non-Woven fabric at global level
General information on geotextiles
Spun Lace market, its relevant portfolio we can manufacture, market sizes, trends for a few years, key companies, technology etc
Need general info about the Geoxtextile market.
Polyester geotextile market by region
Geotextiles market and green technologies
Specific information on fabric waste disposal
Past and present market for Knitwear fabric, with state wise demand in India to identify to launch knitting fabric production units