Glycerin Market by Process (Transesterification, Saponification, Fat Splitting), Source (Vegetable Oils, Biodiesel, Soaps, Synthetic), Application (Industrial, Chemical intermediates), Grade, Region - Global Forecast to 2021


To get the latest information, inquire now!
[151 Pages Report] The Global Glycerin Market was valued at USD 2.19 Billion in 2015 and is projected to reach USD 3.12 Billion by 2021, at a CAGR of 6.8% from 2016 and 2021. In this study, 2014 has been considered the historical year, 2015 the base year, and 2016–2021 the forecast period to estimate the market size of glycerin.
Objectives of the study:
- To define, describe, and forecast the global glycerin market on the basis of process, source, grade, application, and region
- To evaluate the glycerin market in terms of value (USD) and volume (Kiloton)
- To provide detailed information regarding the major factors influencing the growth of the market (drivers, restraints, opportunities, industry-specific challenges, and opportunities) and also market outlook which includes short-term, mid-term, and long-term scenarios in the glycerin market
- To strategically analyze micromarkets with respect to individual growth trends, future prospects, and contribution to the total market
- To analyze the opportunities in the market for the key players and details of the competitive landscape for the market leaders
- To forecast the value of market segments with respect to five main regions (along with countries), namely, North America, Europe, Asia-Pacific, the Middle East & Africa, and South America
- To strategically profile the key players and comprehensively analyze their market shares and core competencies
- To analyze competitive developments such as joint ventures, mergers & acquisitions, new product developments, and R&D in the glycerin market
Research Methodology:
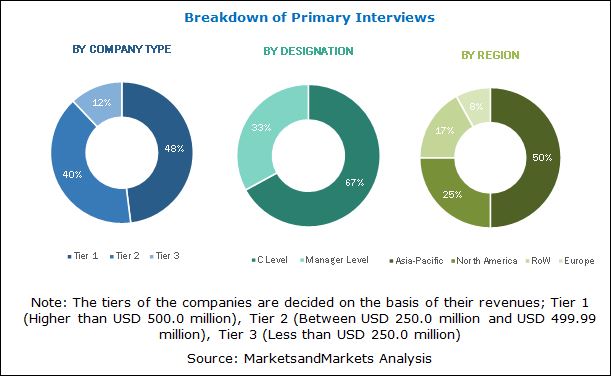
This research study has involved the use of extensive secondary sources such as encyclopedia, directories, and databases to identify and collect information useful for this technical, market-oriented, and commercial study of the glycerin market. Primary sources that include selected experts from related industries and selected suppliers have been interviewed to obtain and verify important information as well as to assess growth prospects.
To know about the assumptions considered for the study, download the pdf brochure
Market Ecosystem:
Global glycerin manufacturers include Emery Oleochemicals (Malaysia), IOI Oleochemicals (Malaysia), Wilmar International (Singapore), KLK Berhad (Malaysia), Godrej Industries (India), Croda International Plc (U.K.), Cargill Incorporated (U.S.), P&G Chemicals (U.S.), Kao Corporation (Japan), and Avril Group (France), among others. These manufacturers focus on expanding their regional presence by undertaking the expansions, mergers & acquisitions, and new product developments strategies.
Key Target Audience:
- Manufacturers of glycerin and its raw materials
- Manufacturers in application industries
- Traders, distributors, and suppliers of glycerin
- Regional manufacturer associations and general glycerin associations
- Government and regional agencies and research organizations
Scope of the Report:
The glycerin market is segmented as follows:
On the basis of Process:
-
Transesterification
- Acid catalyzed transesterification
- Base catalyzed transesterification
- Enzyme catalyzed transesterification
- Saponification
- Fat Splitting
On the basis of Source:
- Vegetable oils
- Biodiesel
- Soaps
- Synthetic
On the basis of Grade:
- Technical grade
- Pharmaceutical grade
On the basis of Application:
-
Industrial
- Pharmaceuticals & healthcare
- Food & beverages
- Personal care
- Automotive
- Polyether polyols
- Alkyd resins
- Tobacco
- Others
-
Chemical Intermediates
- Propylene glycol
- Epichlorohydrin
- 1,3 propanediol
- Acrolein
- Glycerol carbonate
- Glycol substitute
- Others
On the basis of Region:
- North America
- Europe
- Asia-Pacific
- Middle East & Africa
- South America
Available Customizations:
With the given market data, MarketsandMarkets offers customizations according to the company’s specific needs. The following customization options are available for the report:
- Product Analysis
Product Matrix that gives a detailed comparison of the product portfolio of each company
- Regional Analysis
Further breakdown of a region with respect to a particular country
- Company Information
Detailed analysis and profiles of additional market players (up to five)
The global market for glycerin is projected to reach USD 3.12 Billion by 2021, at a CAGR of 6.8% during the forecast period. The global glycerin industry is witnessing growth on account of increasing applications, and increasing demand in the Asia-Pacific region, mainly from China, Japan, and India. Also, the growing demand for glycerin in chemical intermediate production is expected to drive market growth.
The glycerin market is segmented on the basis of process, source, grade, application, and region. In terms of process, transesterification accounted for the largest share of the market globally in 2015. Transesterification is the most common glycerin producing process currently across the globe, and in this process, triglycerides react with alcohols in the presence of catalysts. Fat splitting is expected to witness fastest growth during the forecast period.
In 2015, biodiesel-based glycerin accounted for the largest share in the overall market. Glycerin is produced as a by-product during the production of biodiesel. Crude glycerin manufactured during this process accounts for around 10% of the total biodiesel production. The growing demand for natural ingredients across end-use industries such as cosmetics, food & beverages, and personal care industry is expected to benefit the growth of glycerin derived from vegetable oils.
Technical grade is the most widely used glycerin across the globe. Growing popularity of glycerin as a platform chemical is expected to widen the scope of applications in this segment. Pharmaceutical grade glycerin is used in the food & beverages, pharmaceuticals & healthcare, and personal care industries. Growing applications in these industries are expected to drive the pharmaceutical grade glycerin market.
The industrial application led the glycerin market in 2015, in terms of value. The wide range of this application includes personal care, pharmaceutical, food, alkyd resins, and automotive, among others (wood conditioning, paper manufacturing, and rubber production), which is expected to lead to the demand for glycerin. The growing use of glycerin as a platform chemical in manufacturing various other chemicals such as epichlorohydrin, 1,3 propanediol, propylene glycol, and glycol substitutes is expected to benefit the growth of glycerin used in producing chemical intermediates. South East Asia and China are focusing on the development of the chemical intermediate manufacturing facilities.
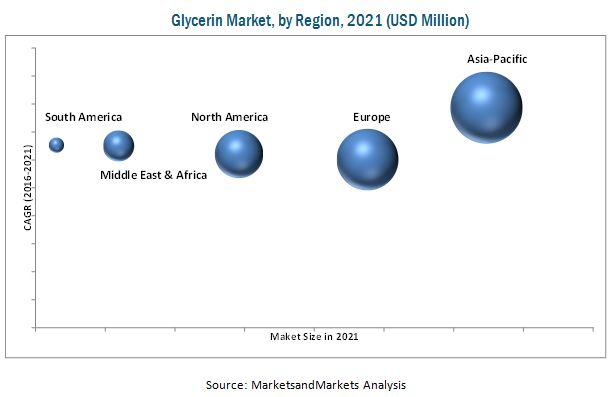
The Asia-Pacific region (comprising China, India, Japan, South Korea, and others) accounted for the largest share of the global glycerin market in 2015. Asia-Pacific was the largest glycerin consumer in 2015. The growth can be attributed to the rapidly increasing consumption of glycerin in countries such as China, India, and South Korea for personal care products. A steady demand since the past few years for hair care and oral care products along with rising consumer interest in color cosmetics boosted the growth of the glycerin market in the Asia-Pacific region.
The glycerin market is highly competitive, with a large number of small players, especially in South East Asia. The glycerin market is led by various players, depending upon their core competencies. Expansions and mergers & acquisitions are the major strategies that were adopted over the past three years.
Emery Oleochemicals (Malaysia) has a strong global presence. In order to gain a market share, the company has invested heavily in R&D and is focused on diversifying its business across new industries and targets new markets. New products that fulfil the targeted requirements of customers are expected to benefit company growth.
To speak to our analyst for a discussion on the above findings, click Speak to Analyst
 Exclusive indicates content/data unique to MarketsandMarkets and not available with any competitors.
Table of Contents
1 Introduction (Page No. - 15)
1.1 Objectives of the Study
1.2 Market Definition
1.3 Scope of the Study
1.3.1 Years Considered for the Study
1.4 Currency
1.5 Limitations
1.6 Stakeholders
2 Research Methodology (Page No. - 19)
2.1 Research Data
2.1.1 Secondary Data
2.1.1.1 Key Data From Secondary Sources
2.1.2 Primary Data
2.1.2.1 Key Data From Primary Sources
2.1.2.2 Key Industry Insights
2.1.2.3 Breakdown of Primary Interviews
2.2 Market Size Estimation
2.2.1 Bottom-Up Approach
2.2.2 Top-Down Approach
2.3 Data Triangulation
2.4 Research Assumptions
2.4.1 Assumptions
3 Executive Summary (Page No. - 27)
4 Premium Insights (Page No. - 31)
4.1 Attractive Opportunities in the Glycerin Market
4.2 Glycerin Market Growth, By Region
4.3 Glycerin Market, 2015
4.4 Glycerin Market Attractiveness
4.5 Glycerin Market, By Source
5 Market Overview (Page No. - 35)
5.1 Introduction
5.2 Market Segmentation
5.2.1 By Process
5.2.2 By Source
5.2.3 By Grade
5.2.4 By Application
5.3 Market Dynamics
5.3.1 Drivers
5.3.1.1 Increased Demand for Glycerin Across Various End-Use Industries
5.3.1.2 Increased Demand for Biodiesel
5.3.1.3 Substitution Potential for Propylene Glycol and Sorbitol in Their Respective Applications
5.3.2 Restraints
5.3.2.1 Oversupply of Glycerin and Low Profitability
5.3.3 Opportunities
5.3.3.1 Emergence of Newer Applications
5.3.4 Challenges
5.3.4.1 Costly Refining Process
5.4 Impact Analysis
5.4.1 Short-Term Outlook
5.4.2 Mid-Term Outlook
5.4.3 Long-Term Outlook
6 Industry Trends (Page No. - 42)
6.1 Introduction
6.2 Supply Chain Analysis
6.3 Porter’s Five Forces Analysis
6.3.1 Threat of New Entrants
6.3.2 Threat of Substitutes
6.3.3 Bargaining Power of Suppliers
6.3.4 Bargaining Power of Buyers
6.3.5 Intensity of Competitive Rivalry
6.4 Macroeconomic Overview and Key Drivers
6.4.1 Introduction
6.4.2 Automotive
6.4.3 Food Industry
6.4.4 Healthcare Industry
7 Crude Glycerin Market (Page No. - 49)
7.1 Introduction
8 Glycerin Market, By Process (Page No. - 51)
8.1 Introduction
8.2 Transesterification
8.2.1 Acid Catalyzed Transesterification
8.2.2 Base Catalyzed Transesterification
8.2.3 Enzymatic Catalyzed Transesterification
8.3 Saponification
8.4 Fat Splitting
9 Glycerin Market, By Source (Page No. - 55)
9.1 Introduction
9.2 Vegetable Oils
9.3 Biodiesel
9.4 Soaps
9.5 Synthetic
10 Glycerin Market, By Grade (Page No. - 58)
10.1 Introduction
10.2 Technical Grade
10.3 Pharmaceutical Grade
11 Glycerin Market, By Application (Page No. - 61)
11.1 Introduction
11.2 Industrial Application
11.2.1 Pharmaceuticals & Healthcare
11.2.2 Food & Beverages
11.2.3 Personal Care
11.2.4 Automotive
11.2.5 Polyether Polyols
11.2.6 Alkyd Resins
11.2.7 Tobacco
11.2.8 Other Applications
11.3 Chemical Intermediate
11.3.1 Propylene Glycol
11.3.2 Epichlorohydrin
11.3.3 1,3 Propanediol
11.3.4 Acrolein
11.3.5 Glycerol Carbonate
11.3.6 Glycol Substitute
11.3.7 Others
12 Glycerin Market, By Region (Page No. - 71)
12.1 Introduction
12.2 North America
12.2.1 U.S.
12.2.2 Mexico
12.2.3 Canada
12.3 Europe
12.3.1 Germany
12.3.2 France
12.3.3 U.K.
12.3.4 Spain
12.3.5 Netherlands
12.3.6 Belgium
12.3.7 Hungary
12.3.8 Poland
12.3.9 Rest of Europe
12.4 Asia-Pacific
12.4.1 China
12.4.2 India
12.4.3 Japan
12.4.4 Thailand
12.4.5 Malaysia
12.4.6 South Korea
12.4.7 Rest of Asia-Pacific
12.5 Middle East & Africa
12.5.1 Saudi Arabia
12.5.2 South Africa
12.5.3 Rest of Middle East & Africa
12.6 South America
12.6.1 Brazil
12.6.2 Argentina
12.6.3 Chile
12.6.4 Colombia
12.6.5 Rest of South America
13 Competitive Landscape (Page No. - 118)
13.1 Overview
13.2 Competitive Situation and Trends
13.3 Market Share Analysis of the Global Glycerin Market in 2015
13.4 Competitive Landscape
13.4.1 New Product Launches
13.4.2 Mergers and Acquisitions
13.4.3 Expansions
13.4.4 Partnerships, Collaborations, and Agreements
14 Company Profiles (Page No. - 124)
(Overview, Financial*, Products & Services, Strategy, and Developments)
14.1 Emery Oleochemicals
14.2 IOI Oleochemicals
14.3 Wilmar International Ltd.
14.4 Kuala Lumpur Kepong Berhad
14.5 Godrej Industries
14.6 Croda International PLC
14.7 Cargill Incorporated
14.8 P&G Chemicals
14.9 KAO Corporation
14.10 Avril Group
14.11 The DOW Chemical Company (Olin Corporation)
14.12 Cremer Oleo GmbH & Co. Kg
14.13 PT Smart TBK
14.14 Vitusa Products Inc.
14.15 PT. Bakrie Sumatera Plantations TBK
14.16 Twin Rivers Technologies Inc.
14.17 Pacific Oleochemicals Sdn Bhd
14.18 PT Sumi Asih Oleochemicals Industry
14.19 Vegetable Vitamin Foods Company (VVF)
14.20 Sakamoto Yakuhin Kogyo Co., Ltd.
14.21 PT Cisadane Raya Chemicals
14.22 Timur Oleochemicals
*Details Might Not Be Captured in Case of Unlisted Companies.
15 Appendix (Page No. - 143)
15.1 Insights of Industry Experts
15.2 Discussion Guide
15.3 Knowledge Store: Marketsandmarkets Subscription Portal
15.4 Introducing RT: Real-Time Market Intelligence
15.5 Available RT Snapshot
15.6 Related Reports
15.7 Author Details
List of Tables (106 Tables)
Table 1 Glycerin Market Size, By Type, 2014–2021 (Kiloton)
Table 2 Crude Glycerin Market Size, By Application, 2014–2021 (Kiloton)
Table 3 Glycerin Market Size, By Process, 2014–2021 (Kiloton)
Table 4 Glycerin Market Size, By Process, 2014–2021 (USD Million)
Table 5 Glycerin Market Size, By Transesterification Process, 2014–2021 (Kiloton)
Table 6 Glycerin Market Size, By Transesterification Process, 2014–2021 (USD Million)
Table 7 Glycerin Market Size, By Source, 2014–2021 (Kiloton)
Table 8 Glycerin Market Size, By Source, 2014–2021 (USD Million)
Table 9 Glycerin Market Size, By Grade, 2014–2021 (Kiloton)
Table 10 By Market Size, By Grade, 2014–2021 (USD Million)
Table 11 By Market Size, By Application, 2014–2021 (Kiloton)
Table 12 By Market Size, By Application, 2014–2021 (USD Million)
Table 13 By Market Size in Industrial Application, 2014–2021 (Kiloton)
Table 14 By Market Size in Industrial Application, 2014–2021 (USD Million)
Table 15 By Market Size in Pharmaceutical & Healthcare Application, 2014–2021 (Kiloton)
Table 16 By Market Size in Pharmaceutical & Healthcare Application, 2014–2021 (USD Million)
Table 17 By Market Size in Food & Beverages Application, 2014–2021 (Kiloton)
Table 18 By Market Size in Food & Beverages Application, 2014–2021 (USD Million)
Table 19 By Market Size in Personal Care Application, 2014–2021 (Kiloton)
Table 20 By Market Size in Personal Care Application, 2014–2021 (USD Million)
Table 21 By Market Size in Automotive Application, 2014–2021 (Kiloton)
Table 22 By Market Size in Automotive Application, 2014–2021 (USD Million)
Table 23 By Market Size in Other Applications, 2014–2021 (Kiloton)
Table 24 By Market Size in Other Applications, 2014–2021 (USD Million)
Table 25 By Market Size in Chemical Intermediates, 2014–2021 (Kiloton)
Table 26 By Market Size in Chemical Intermediates, 2014–2021 (USD Million)
Table 27 By Market Size, By Region, 2014–2021 (Kiloton)
Table 28 By Market Size, By Region, 2014–2021 (USD Million)
Table 29 North America: By Market Size, By Country, 2014–2021 (Kiloton)
Table 30 North America: By Market Size, By Country, 2014–2021 (USD Million)
Table 31 North America: By Market Size, By Industrial Application, 2014–2021 (Kiloton)
Table 32 North America: By Market Size, By Industrial Application, 2014–2021 (USD Million)
Table 33 U.S.: By Market Size, By Industrial Application, 2014–2021 (Kiloton)
Table 34 U.S.: By Market Size, By Industrial Application, 2014–2021 (USD Million)
Table 35 Mexico: By Market Size, By Industrial Application, 2014–2021 (Kiloton)
Table 36 Mexico: By Market Size, By Industrial Application, 2014–2021 (USD Million)
Table 37 Canada: By Market Size, By Industrial Application, 2014–2021 (Ton)
Table 38 Canada: By Market Size, By Industrial Application, 2014–2021 (USD Thousand)
Table 39 Europe: By Market Size, By Country, 2014–2021 (Kiloton)
Table 40 Europe: By Market Size, By Country, 2014–2021 (USD Million)
Table 41 Europe: By Market Size, By Industrial Application, 2014–2021 (Kiloton)
Table 42 Europe: By Market Size, By Industrial Application, 2014–2021 (USD Million)
Table 43 Germany: By Market Size, By Industrial Application, 2014–2021 (Kiloton)
Table 44 Germany: By Market Size, By Industrial Application, 2014–2021 (USD Million)
Table 45 France: By Market Size, By Industrial Application, 2014–2021 (Kiloton)
Table 46 France: By Market Size, By Industrial Application, 2014–2021 (USD Million)
Table 47 U.K.: By Market Size, By Industrial Application, 2014–2021 (Kiloton)
Table 48 U.K.: By Market Size, By Industrial Application, 2014–2021 (USD Million)
Table 49 Spain: By Market Size, By Industrial Application, 2014–2021 (Kiloton)
Table 50 Spain: By Market Size, By Industrial Application, 2014–2021 (USD Million)
Table 51 Netherlands: By Market Size, By Industrial Application, 2014–2021 (Ton)
Table 52 Netherlands: By Market Size, By Industrial Application, 2014–2021 (USD Thousand)
Table 53 Belgium: By Market Size, By Industrial Application, 2014–2021 (Ton)
Table 54 Belgium: By Market Size, By Industrial Application, 2014–2021 (USD Thousand)
Table 55 Hungary: By Market Size, By Industrial Application, 2014–2021 (Ton)
Table 56 Hungary: By Market Size, By Industrial Application, 2014–2021 (USD Thousand)
Table 57 Poland: By Market Size, By Industrial Application, 2014–2021 (Ton)
Table 58 Poland: By Market Size, By Industrial Application, 2014–2021 (USD Thousand)
Table 59 Rest of Europe: By Market Size, By Industrial Application, 2014–2021 (Kiloton)
Table 60 Rest of Europe: By Market Size, By Industrial Application, 2014–2021 (USD Million)
Table 61 Asia-Pacific: By Market Size, By Country, 2014–2021 (Kiloton)
Table 62 Asia-Pacific: By Market Size, By Country, 2014–2021 (USD Million)
Table 63 Asia-Pacific: By Market Size, By Industrial Application, 2014–2021 (Kiloton)
Table 64 Asia-Pacific: By Market Size, By Industrial Application, 2014–2021 (USD Million)
Table 65 China: By Market Size, By Industrial Application, 2014–2021 (Kiloton)
Table 66 China: By Market Size, By Industrial Application, 2014–2021 (USD Million)
Table 67 India: By Market Size, By Industrial Application, 2014–2021 (Kiloton)
Table 68 India: By Market Size, By Industrial Application, 2014–2021 (USD Million)
Table 69 Japan: By Market Size, By Industrial Application, 2014–2021 (Kiloton)
Table 70 Japan: By Market Size, By Industrial Application, 2014–2021 (USD Million)
Table 71 Thailand: By Market Size, By Industrial Application, 2014–2021 (Kiloton)
Table 72 Thailand: By Market Size, By Industrial Application, 2014–2021 (USD Million)
Table 73 Malaysia: By Market Size, By Industrial Application, 2014–2021 (Kiloton)
Table 74 Malaysia: By Market Size, By Industrial Application, 2014–2021 (USD Million)
Table 75 South Korea: By Market Size, By Industrial Application, 2014–2021 (Ton)
Table 76 South Korea: By Market Size, By Industrial Application, 2014–2021 (USD Thousand)
Table 77 Rest of Asia-Pacific: Glycerin Market Size, By Industrial Application, 2014–2021 (Kiloton)
Table 78 Rest of Asia-Pacific: By Market Size, By Industrial Application, 2014–2021 (USD Million)
Table 79 Middle East & Africa: By Market Size, By Country, 2014–2021 (Kiloton)
Table 80 Middle East & Africa: By Market Size, By Country, 2014–2021 (USD Million)
Table 81 Rest of Middle East & Africa: Glycerin Market Size, By Industrial Application, 2014–2021 (Kiloton)
Table 82 Rest of Middle East & Africa: By Market Size, By Industrial Application, 2014–2021 (USD Million)
Table 83 Saudi Arabia: By Market Size, By Industrial Application, 2014–2021 (Ton)
Table 84 Saudi Arabia: By Market Size, By Industrial Application, 2014–2021 (USD Thousand)
Table 85 South Africa: By Market Size, By Industrial Application, 2014–2021 (Ton)
Table 86 South Africa: By Market Size, By Industrial Application, 2014–2021 (USD Thousand)
Table 87 Rest of Middle East & Africa: By Market Size, By Industrial Application, 2014–2021 (Kiloton)
Table 88 Rest of Middle East & Africa: By Market Size, By Industrial Application, 2014–2021 (USD Million)
Table 89 South America: Glycerin Market Size, By Country, 2014–2021 (Kiloton)
Table 90 South America: Glycerin Market Size, By Country, 2014–2021 (USD Million)
Table 91 South America: Glycerin Market Size, By Industrial Application, 2014–2021 (Kiloton)
Table 92 South America: Glycerin Market Size, By Industrial Application, 2014–2021 (USD Million)
Table 93 Brazil: Glycerin Market Size, By Industrial Application, 2014–2021 (Ton)
Table 94 Brazil: Glycerin Market Size, By Industrial Application, 2014–2021 (USD Thousand)
Table 95 Argentina: Glycerin Market Size, By Industrial Application, 2014–2021 (Ton)
Table 96 Argentina: Glycerin Market Size, By Industrial Application, 2014–2021 (USD Thousand)
Table 97 Chile: Glycerin Market Size, By Industrial Application, 2014–2021 (Ton)
Table 98 Chile: Glycerin Market Size, By Industrial Application, 2014–2021 (USD Thousand)
Table 99 Colombia: Glycerin Market Size, By Industrial Application, 2014–2021 (Ton)
Table 100 Colombia: Glycerin Market Size, By Industrial Application, 2014–2021 (USD Thousand)
Table 101 Rest of South America: Glycerin Market Size, By Industrial Application, 2014–2021 (Ton)
Table 102 Rest of South America: Glycerin Market Size, By Industrial Application, 2014–2021 (USD Thousand)
Table 103 New Product Launches, 2014–2017
Table 104 Mergers and Acquisitions, 2014–2017
Table 105 Expansions, 2014–2017
Table 106 Partnerships, Collaborations, and Agreements, 2014–2017
List of Figures (45 Figures)
Figure 1 Glycerin Market Segmentation
Figure 2 Glycerin Market: Research Design
Figure 3 Market Size Estimation: Bottom-Up Approach
Figure 4 Market Size Estimation: Top-Down Approach
Figure 5 Glycerin Glycerin Market: Data Triangulation
Figure 6 Transesterification to Lead Glycerin Market, During Forecast Period
Figure 7 Biodiesel to Lead Glycerin Market, During the Forecast Period
Figure 8 Technical Grade to Register Higher CAGR, During the Forecast Period
Figure 9 Industrial Application to Lead Glycerin Market, During Forecast Period
Figure 10 Asia-Pacific Led Glycerin Market in 2015
Figure 11 Glycerin Market to Witness Rapid Growth From 2016 to 2021
Figure 12 Asia-Pacific to Lead the Glycerin Market, 2016–2021
Figure 13 China Accounted for Largest Share, in Terms of Value, of the Glycerin Market, 2015
Figure 14 Asia-Pacific to Be the Fastest-Growing Glycerin Market From 2016 to 2021
Figure 15 Biodiesel to Account for the Largest Share in the Glycerin Market, 2016–2021
Figure 16 Factors Governing Glycerin Market
Figure 17 Factors Influencing the Glycerin Market
Figure 18 Glycerin: Supply Chain Analysis
Figure 19 China Was the Largest Producer of Cars and Commercial Vehicles in 2016
Figure 20 China Had the Largest Food Production in 2015
Figure 21 Healthcare Expenditure Contribution to Total GDP, 2014
Figure 22 Transesterification Expected to Lead the Glycerin Market, During the Forecast Period
Figure 23 Biodiesel Expected to Lead the Glycerin Market, Between 2016 and 2021
Figure 24 Technical Grade is Expected to Lead the Glycerin Market Between 2016 and 2021
Figure 25 Industrial Application to Lead the Glycerin Market Between 2016 and 2021
Figure 26 Regional Snapshot (2016–2021): Emerging Markets are the New Hotspots
Figure 27 Europe Market Snapshot: Personal Care to Be the Largest Industrial Application of Glycerin
Figure 28 Asia-Pacific Market Snapshot: China to Be the Largest Consumer of Glycerin
Figure 29 Mergers & Acquisitions Was the Most Preffered Growth Strategy Adopted By Major Players From 2014 to 2017
Figure 30 2015 Was Observed to Be the Most Active in Terms of Strategic Developments in the Glycerin Market
Figure 31 Battle for Market Share: Mergers & Acquisitions Was the Key Strategy (2014–2017)
Figure 32 Top 6 Market Players Account for Less Than Half of the Market Share in 2015
Figure 33 Emery Oleochemicals: SWOT Analysis
Figure 34 IOI Oleochemicals: Company Snapshot
Figure 35 IOI Oleochemicals: SWOT Analysis
Figure 36 Wilmar International Ltd.: Company Snapshot
Figure 37 Wilmar International: SWOT Analysis
Figure 38 Kuala Lumpur Kepong Berhad: Company Snapshot
Figure 39 Kuala Lumpur Kepong Berhad: SWOT Analysis
Figure 40 Godrej Industries: Company Snapshot
Figure 41 Godrej Industries: SWOT Analysis
Figure 42 Croda International PLC: Company Snapshot
Figure 43 Cargill Incorporated: Company Snapshot
Figure 44 P&G: Company Snapshot
Figure 45 KAO Corporation: Company Snapshot


Growth opportunities and latent adjacency in Glycerin Market