Industrial Communication Market

Industrial Communication Market by Components (Switches, Gateways, Power Supply Devices, Router & WAP, Communication Interface & Protocol Converters, Controllers), Software, Services, Communication Protocol, Vertical and Region - Global Forecast to 2028

Report Code: SE 4645 Jun, 2023, by marketsandmarkets.com

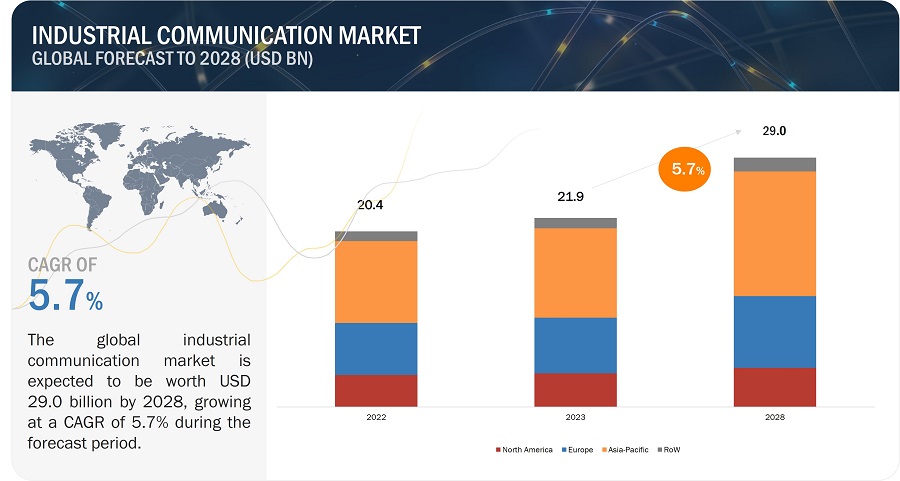
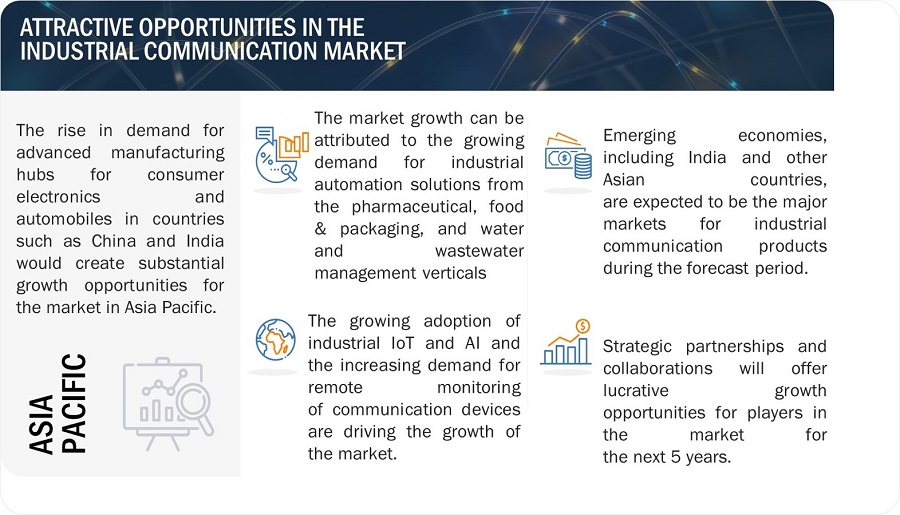
[241 Pages Report] The industrial communication market is projected to grow from USD 21.9 billion in 2023 to USD 29.0 billion by 2028; it is expected to grow at a CAGR of 5.7% from 2023 to 2028. Initiatives undertaken by governments of different countries to promote the adoption of industrial automation, the growing need for scalable, faster, reliable, and interoperable communication protocols, increasing use of machine-to-machine communication technology, and increasing use of digital twin to safely monitor smart manufacturing operations are among the factors driving the growth of industrial communication market.
Industrial Communication Market

Industrial Communication Market

Industrial Communication Market Forecast to 2028

To know about the assumptions considered for the study, Request for Free Sample Report

Industrial Communication Market Dynamics

Driver: Increasing use of machine-to-machine communication technology

Better connectivity for smooth communication and low power requirements are the key reasons for the increased adoption of new machine-to-machine (M2M) technologies. To achieve effective M2M communication, the existing capacity of mobile networks must be able to handle billions of nodes that are expected to be deployed in the next couple of years. Currently, the network capacity is not capable of handling M2M and human-based communications, as well as their different communication patterns, including latency time. For this reason, a next-level cellular network for mobile communication featuring hyper-connectivity and larger bandwidth (e.g., 5G) is required. The M2M communication technology will be widely used in the coming years in heavy manufacturing industries and process industries (e.g., food industry) to increase the efficiency of different processes and reduce human intervention for machines.

M2M technology has opened new avenues for the industrial communication market. It enables enterprises to improve their productivity and safety in work environments, thus allowing them to attain better efficiencies. Such benefits of M2M communication are expected to further drive the industrial communication market.

Restraint: Absence of standardization in industrial communication protocols and interfaces

Industrial equipment or devices communicate through various interfaces, technologies, and protocols. The lack of standardization in these communication interfaces and protocols may result in the misrepresentation of data. The lack of standardization complicates the integration of systems and hinders the use of plug-and-play features for unrelated systems. For instance, most equipment manufacturers use their proprietary interface protocols to communicate with their devices, which results in communication challenges for the devices developed by other manufacturers.

Opportunity: Upsurge in demand for wireless networks

The rapid growth in the demand for wireless technologies, such as Bluetooth Smart, WirelessHART, WLAN, and Zigbee, is opening new growth opportunities for the industrial communication market, mainly for the oil & gas, electronics, and energy & power generation industries. Zigbee helps drive the market for low-cost wireless network solutions. The Zigbee IEEE 802.15.4 technology has been adopted by many organizations worldwide. Similarly, WirelessHART-enabled communication is becoming one of the most widely used options for signal transmission in process industries using HART communication. WLAN (IEEE 802.11) is used for high-performance infrastructure networks that are also suitable for industrial applications. Advancements in wireless communication technologies, especially cellular technologies, are helping various industries to monitor their assets across the world. These technologies enable efficient and universal communication for all industrial applications. In process and infrastructure applications, industrial wireless systems simplify the process of recording data from remote stations and field devices, which would otherwise be inaccessible for accomplishing the process. The speed and simplicity of the installation of wireless networks have also made them popular among industries, as they can be deployed to facilitate M2M communication even under extreme environments. All these factors have contributed to the growth of the market for wireless technologies for industrial communication, especially in highly industrialized regions, and are expected to drive the overall market in the coming years.

Challenge: Harsh field site conditions such as high-voltage transients, severe shocks and vibrations, and extremely high temperatures

Industrial communication technology is increasingly being deployed at remote field locations. Remote field locations are more prone to the effects of unfavorable and harsh conditions, such as high-voltage transients, shocks and vibrations, and extremely high temperatures. High voltage transients result from electrostatic discharge (ESD), surge, burst, electrical fast transients (EFT), and lightning strikes. Industrial switches should be capable of preventing high-voltage transients by providing high electromagnetic protection. Shock and vibration in machinery can separate networking wires meant for long-term exposure to shock and vibration, eventually resulting in electrical shorts, broken solder joints, loose printed circuit board (PCB) components, PCB delamination, and cracked device housings. Moreover, remote onsite locations may not have air conditioning; this raises the demand for switches with high-temperature tolerance and optimal heat dissipation to keep the switch lifecycle intact. Therefore, there is a requirement for robust industrial communication equipment to withstand harsh conditions.

Services offerings to witness highest CAGR during the forecast period

There is a growing requirement for services pertaining to industrial communication. Various services are provided by industrial communication market players, which can meet the application-specific needs of end users. Service providers provide customized network design and other related services, such as long-term maintenance contracts of installations, to cater to clients with specific requirements. They also provide remote support services for networks and can solve or manage network problems remotely. Companies such as Siemens and General Electric provide a separate services portfolio for this market.

Pharmaceutical and medical devices to witness highest CAGR during the forecast period

The pharmaceutical industry is evolving with the adoption of automation and sensing technologies. A pharmaceutical company generally has different plants or units for various processes, such as manufacturing and packaging. Chemical plants process various medicines, and the manufacturing and packaging plants pack these medicines into capsules and bottles. However, there must be proper communication between these units to ensure efficient production. Companies such as Rockwell Automation provide communication solutions for gaining real-time access and extended enterprise visibility into vital manufacturing data. This can enable businesses to improve their processes and provide organizations with better access to real-time production information. It also helps improve supply chain integration across a pharma facility.

Asia Pacific to witness highest CAGR during forecast period

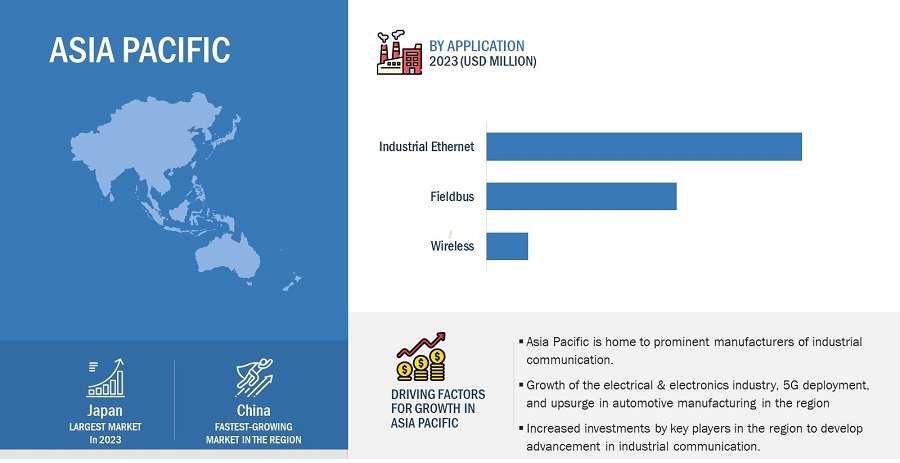
Asia Pacific is currently the largest manufacturing hub for automotive and electronics companies. The manufacturing companies in Asia Pacific extensively adopt the smart factory concept for implementing advanced manufacturing technologies on the factory floor. This innovative concept has transformed the manufacturing sector in Asia Pacific and has increased the implementation of smart automation in factories. The growing acceptance of Industrial Revolution 4.0 in Asia Pacific is among the factors driving the growth of the industrial communication market in this region. Furthermore, an increase in factory automation in various industries to integrate wireless networking technologies for reliable and fast machine-to-machine communications led to the growth of the industrial communication market in Asia Pacific.
Industrial Communication Market by Region

Industrial Communication Market by Region

To know about the assumptions considered for the study, download the pdf brochure

Key Market Players

The major players in the industrial communication companies include Cisco Systems, Inc. (US), Siemens (Germany), Rockwell Automation (US),  OMRON Corporation (Japan), Moxa Inc. (Taiwan),  Huawei Technologies Co., Ltd. (China), SICK AG (Germany), Schneider Electric (France), ABB (Switzerland), Belden Inc. (US), GE (France), Advantech Co., Ltd (Taiwan), FANUC CORPORATION  (Japan), Bosch Rexroth AG (Germany), AAEON Technology Inc. (Taiwan), HMS Networks (Sweden), Honeywell International Inc. (US), Mitsubishi Electric Corporation (Japan),  Ericsson (Sweden), Hans Turck GmbH & Co. KG (Germany), ACS Motion Control (Israel), Eaton (Ireland), Beckhoff Automation (Germany), Hitachi, Ltd. (Japan). These companies have used both organic and inorganic growth strategies such as product launches, acquisitions, and partnerships to strengthen their position in the market.

Get online access to the report on the World's First Market Intelligence Cloud

  • Easy to Download Historical Data & Forecast Numbers
  • Company Analysis Dashboard for high growth potential opportunities
  • Research Analyst Access for customization & queries
  • Competitor Analysis with Interactive dashboard
  • Latest News, Updates & Trend analysis
Request Sample

Scope of the Report

Report Metric

Details

Estimated Market Size USD 21.9 billion in 2023
Projected Market Size USD 29.0 billion by 2028
Growth Rate CAGR of 5.7%

Market Size Availability for Years

2019–2028

Base Year

2022

Forecast Period

2023–2028

Forecast Units

Value (USD)

Segments Covered

By Offering, By Communication Protocol, By Vertical, By Geography

Geographies Covered

South America, Europe, Asia Pacific, and RoW

Companies Covered

Cisco Systems, Inc. (US), Siemens (Germany), Rockwell Automation (US),  OMRON Corporation (Japan), Moxa Inc. (Taiwan),  Huawei Technologies Co., Ltd. (China), SICK AG (Germany), Schneider Electric (France), ABB (Switzerland), Belden Inc. (US), GE (France), Advantech Co., Ltd (Taiwan), FANUC CORPORATION  (Japan), Bosch Rexroth AG (Germany), AAEON Technology Inc. (Taiwan), HMS Networks (Sweden), Honeywell International Inc. (US), Mitsubishi Electric Corporation (Japan),  Ericsson (Sweden), Hans Turck GmbH & Co. KG (Germany), ACS Motion Control (Israel), Eaton (Ireland), Beckhoff Automation (Germany), and Hitachi, Ltd. (Japan)

Industrial Communication Market Highlights

This research report categorizes the industrial communication market based on by offering, by communication protocol,  by vertical, and by region.

Segment

Subsegment

By Offering

  • Introduction
  • Components
    • Switches
    • Gateways
    • Routers & WAP
    • Controllers & Connectors
    • Communication Interfaces & Converters
    • Power Supply Devices
    • Others
  • Software
  • Services

By Communication Protocol

  • Introduction
  • Fieldbus
  • Industrial Ethernet
  • Wireless

By Vertical

  • Introduction
  • Automotive
  • Electrical & Electronics
  • Aerospace & Defense
  • Oil & Gas
  • Chemicals & Fertilizers
  • Food & Beverages
  • Pharmaceuticals & Medical Devices
  • Energy & Power
  • Metals & Mining
  • Engineering / Fabrication
  • Water & Wastewater Management
  • Others

By Geography

  • Introduction
  • North America
    • US
    • Canada
    • Mexico
  • Europe
    • UK
    • Germany
    • France
    • Spain
    • Italy
    • Rest of Europe
  • Asia Pacific
    • China
    • Japan
    • India
    • South Korea
    • Rest of Asia Pacific
  • ROW
    • Latin America
    • Middle East & Africa

Recent Developments

  • In February 2023, Cisco Systems, Inc.has launched Meraki’s first 5G Cellular Gateways for fixed wireless access (FWA). The Cisco Meraki MG51 and MG51E cellular gateways provide a 5G powered, cloud first way of doing Wide Area Networking (WAN).
  • In April 2023, The Simatic S7-1500V is an expansion of Simatic Portfolio which meets special market requirements such as virtual hosting of PLC computing. 
  • In December 2022, Rockwell Automation launched FactoryTalk Logix Echo streamlines the emulator process by allowing users to download straight to FactoryTalk Logix Echo without any adjustments. It provides the quick system performance, large capacity, and optimized productivity that a control system needs. ControlLogix 5580 controllers are multi-discipline controllers that may control distinct, motion, process, and safety applications.
  • In October 2022, for the first time in the United States, OMRON Corporation showcased their IoT Gateways. These capture correct data, link to the cloud reliably, and develop solutions to extend automation in our daily life.The company has created several lineups and hardware/software platforms that allow clients to quickly and freely customize features, resulting in faster and easier creation of IoT solutions.
  • In October 2022, Moxa, Inc launched the EDR-G9010 Series which is a secure router that includes a firewall, NAT, VPN, and a switch. With the inclusion of IDS/IPS, the EDR-G9010 Series is transformed into an industrial next-generation firewall, complete with risk detection and prevention features to defend critical infrastructure from cybersecurity assaults.

Frequently Asked Questions (FAQ):

To speak to our analyst for a discussion on the above findings, click Speak to Analyst

TABLE OF CONTENTS
 
1 INTRODUCTION (Page No. - 30)
    1.1 STUDY OBJECTIVES 
    1.2 DEFINITION 
           1.2.1 INCLUSIONS AND EXCLUSIONS
    1.3 STUDY SCOPE 
           1.3.1 MARKETS COVERED
                    FIGURE 1 INDUSTRIAL COMMUNICATIONS MARKET SEGMENTATION
           1.3.2 REGIONAL SCOPE
           1.3.3 YEARS CONSIDERED
    1.4 CURRENCY CONSIDERED 
    1.5 LIMITATIONS 
    1.6 STAKEHOLDERS 
    1.7 SUMMARY OF CHANGES 
           1.7.1 RECESSION IMPACT
 
2 RESEARCH METHODOLOGY (Page No. - 36)
    2.1 RESEARCH DATA 
           FIGURE 2 INDUSTRIAL COMMUNICATIONS MARKET: RESEARCH DESIGN
           2.1.1 SECONDARY AND PRIMARY RESEARCH
                   FIGURE 3 INDUSTRIAL COMMUNICATIONS MARKET: RESEARCH APPROACH
           2.1.2 SECONDARY DATA
                    TABLE 1 MAJOR SECONDARY SOURCES
                    2.1.2.1 Key data from secondary sources
           2.1.3 PRIMARY DATA
                    2.1.3.1 Primary interviews with experts
                    2.1.3.2 Key industry insights
                    2.1.3.3 Breakdown of primaries
    2.2 MARKET SIZE ESTIMATION 
           2.2.1 BOTTOM-UP APPROACH
                    2.2.1.1 Approach to arrive at market size using bottom-up approach
                               FIGURE 4 MARKET SIZE ESTIMATION METHODOLOGY: BOTTOM-UP APPROACH
                               FIGURE 5 MARKET SIZE ESTIMATION METHODOLOGY (APPROACH 1): BOTTOM-UP (SUPPLY-SIDE)—ILLUSTRATION OF REVENUE ESTIMATION OF KEY PLAYERS FROM SALES OF INDUSTRIAL COMMUNICATIONS OFFERINGS
           2.2.2 TOP-DOWN APPROACH
                    2.2.2.1 Approach to arrive at market size using top-down approach (supply side)
                               FIGURE 6 MARKET SIZE ESTIMATION METHODOLOGY: TOP-DOWN APPROACH
                               FIGURE 7 SUPPLY-SIDE ANALYSIS: INDUSTRIAL COMMUNICATIONS MARKET (1/2)
                               FIGURE 8 MARKET SIZE ESTIMATION METHODOLOGY (APPROACH 2): TOP-DOWN (SUPPLY SIDE)—REVENUE GENERATED FROM INDUSTRIAL COMMUNICATIONS OFFERINGS
    2.3 MARKET BREAKDOWN AND DATA TRIANGULATION 
           FIGURE 9 DATA TRIANGULATION
    2.4 RESEARCH ASSUMPTIONS 
    2.5 RISK ASSESSMENTS 
           TABLE 2 RESEARCH LIMITATIONS AND ASSOCIATED RISKS
    2.6 PARAMETERS CONSIDERED TO ANALYZE IMPACT OF RECESSION ON INDUSTRIAL COMMUNICATIONS MARKET 
    2.7 RESEARCH LIMITATIONS 
 
3 EXECUTIVE SUMMARY (Page No. - 48)
    FIGURE 10 INDUSTRIAL COMMUNICATIONS MARKET SIZE, 2019–2028
    FIGURE 11 AUTOMOTIVE VERTICAL TO ACCOUNT FOR LARGEST SHARE OF INDUSTRIAL COMMUNICATIONS MARKET IN 2023
    FIGURE 12 INDUSTRIAL ETHERNET PROTOCOL TO DOMINATE INDUSTRIAL COMMUNICATIONS MARKET IN 2023
    FIGURE 13 COMPONENTS SEGMENT TO LEAD INDUSTRIAL COMMUNICATIONS MARKET IN 2023
    FIGURE 14 ASIA PACIFIC TO HOLD LARGEST SHARE OF INDUSTRIAL COMMUNICATIONS MARKET IN 2023
 
4 PREMIUM INSIGHTS (Page No. - 52)
    4.1 ATTRACTIVE OPPORTUNITIES FOR PLAYERS IN INDUSTRIAL COMMUNICATIONS MARKET 
           FIGURE 15 INCREASING DEMAND FOR INDUSTRIAL COMMUNICATIONS SOLUTIONS IN PHARMACEUTICALS & MEDICAL DEVICES TO DRIVE MARKET GROWTH DURING FORECAST PERIOD
    4.2 INDUSTRIAL COMMUNICATIONS MARKET, BY OFFERING 
           FIGURE 16 INDUSTRIAL COMMUNICATIONS SERVICES MARKET TO EXHIBIT HIGHEST CAGR DURING FORECAST PERIOD
    4.3 INDUSTRIAL COMMUNICATIONS MARKET, BY COMMUNICATION PROTOCOL AND VERTICAL 
           FIGURE 17 INDUSTRIAL ETHERNET PROTOCOL AND AUTOMOTIVE VERTICAL TO DOMINATE GLOBAL INDUSTRIAL COMMUNICATIONS MARKET IN 2023
    4.4 INDUSTRIAL COMMUNICATIONS MARKET, BY REGION 
           FIGURE 18 INDUSTRIAL COMMUNICATIONS MARKET IN ASIA PACIFIC TO RECORD HIGHEST CAGR DURING FORECAST PERIOD
 
5 MARKET OVERVIEW (Page No. - 54)
    5.1 INTRODUCTION 
    5.2 MARKET DYNAMICS 
           FIGURE 19 INDUSTRIAL COMMUNICATIONS MARKET: DRIVERS, RESTRAINTS, OPPORTUNITIES, AND CHALLENGES
           5.2.1 DRIVERS
                    FIGURE 20 INDUSTRIAL COMMUNICATIONS MARKET DRIVERS AND THEIR IMPACT
                    5.2.1.1 Growing need for scalable, faster, reliable, and interoperable communication protocols
                               5.2.1.1.1 Recent developments
                    5.2.1.2 Increasing use of digital twin technology to safely monitor smart manufacturing operations
                               5.2.1.2.1 Recent developments
                    5.2.1.3 Increasing deployment of machine-to-machine communications technology
                               5.2.1.3.1 Recent developments
                    5.2.1.4 Rising adoption of industrial automation supported by government initiatives
                               5.2.1.4.1 Recent developments
                                            FIGURE 21 ANNUAL INSTALLATION COUNT OF INDUSTRIAL ROBOTS, BY COUNTRY, 2020 (THOUSAND UNITS)
                    5.2.1.5 Growing implementation of 5G technology in automotive, construction, and manufacturing
           5.2.2 RESTRAINTS
                    FIGURE 22 INDUSTRIAL COMMUNICATIONS MARKET RESTRAINT AND ITS IMPACT
                    5.2.2.1 Lack of standardization in industrial communication protocols and interfaces
           5.2.3 OPPORTUNITIES
                    FIGURE 23 INDUSTRIAL COMMUNICATIONS MARKET OPPORTUNITIES AND THEIR IMPACT
                    5.2.3.1 Lucrative opportunities offered by 5G for Industrial IoT development
                               5.2.3.1.1 Recent developments
                    5.2.3.2 Growing demand for wireless networks
           5.2.4 CHALLENGES
                    FIGURE 24 INDUSTRIAL COMMUNICATIONS MARKET CHALLENGES AND THEIR IMPACT
                    5.2.4.1 Threats related to cybersecurity
                    5.2.4.2 Harsh field site conditions such as high-voltage transients, severe shocks and vibrations, and extremely high temperatures
    5.3 VALUE CHAIN ANALYSIS 
           FIGURE 25 INDUSTRIAL COMMUNICATIONS MARKET: VALUE CHAIN ANALYSIS
           5.3.1 RESEARCH AND DEVELOPMENT
           5.3.2 COMPONENT MANUFACTURERS/ODMS
           5.3.3 SYSTEM INTEGRATORS/SOLUTIONS PROVIDERS
           5.3.4 MARKETING AND SALES
           5.3.5 POST-SALES SERVICES
           5.3.6 END USER INDUSTRIES
    5.4 PORTER’S FIVE FORCES ANALYSIS 
           FIGURE 26 PORTER’S FIVE FORCES ANALYSIS
           TABLE 3 PORTER’S FIVE FORCES ANALYSIS: INDUSTRIAL COMMUNICATIONS MARKET
           5.4.1 THREAT OF NEW ENTRANTS
           5.4.2 THREAT OF SUBSTITUTES
           5.4.3 BARGAINING POWER OF BUYERS
           5.4.4 BARGAINING POWER OF SUPPLIERS
           5.4.5 INTENSITY OF COMPETITIVE RIVALRY
    5.5 KEY STAKEHOLDERS AND BUYING CRITERIA 
           5.5.1 KEY STAKEHOLDERS IN BUYING PROCESS
                    FIGURE 27 INFLUENCE OF STAKEHOLDERS ON BUYING PROCESS FOR TOP THREE VERTICALS
                    TABLE 4 INFLUENCE OF STAKEHOLDERS ON BUYING PROCESS FOR TOP THREE VERTICALS (%)
           5.5.2 BUYING CRITERIA
                    FIGURE 28 KEY BUYING CRITERIA FOR TOP THREE VERTICALS
                    TABLE 5 KEY BUYING CRITERIA FOR TOP THREE VERTICALS
    5.6 PATENT ANALYSIS 
           TABLE 6 NUMBER OF PATENTS REGISTERED IN INDUSTRIAL COMMUNICATIONS MARKET IN LAST 10 YEARS
           FIGURE 29 TOP 10 COMPANIES WITH HIGHEST NO. OF PATENT APPLICATIONS IN LAST 10 YEARS
           FIGURE 30 NO. OF PATENTS GRANTED PER YEAR, 2013–2022
           TABLE 7 PATENTS PERTAINING TO INDUSTRIAL COMMUNICATIONS, 2020–2022
    5.7 TRADE ANALYSIS 
           5.7.1 IMPORT SCENARIO
                    TABLE 8 IMPORT DATA, BY COUNTRY, 2018–2022 (USD MILLION)
           5.7.2 EXPORT SCENARIO
                    TABLE 9 EXPORT DATA, BY COUNTRY, 2018–2022 (USD MILLION)
    5.8 TECHNOLOGY ANALYSIS 
           5.8.1 NEAR-FIELD COMMUNICATION (NFC)
           5.8.2 TIME-SENSITIVE NETWORKING (TSN)
           5.8.3 OPEN PLATFORM COMMUNICATION UNIFIED ARCHITECTURE (OPC UA)
           5.8.4 VIRTUALIZATION
           5.8.5 ETHERNET
    5.9 TRENDS AND DISRUPTIONS IMPACTING CUSTOMER BUSINESS 
           FIGURE 31 REVENUE SHIFT AND NEW REVENUE POCKETS FOR INDUSTRIAL COMMUNICATIONS MARKET PLAYERS
    5.10 INDUSTRIAL COMMUNICATIONS MARKET ECOSYSTEM 
           FIGURE 32 INDUSTRIAL COMMUNICATIONS MARKET ECOSYSTEM
    5.11 CASE STUDY 
           5.11.1 ADVANTECH’S EDGE SOLUTIONS ENABLE REAL-TIME OIL TANKER MONITORING
           5.11.2 PULP MOLDING EQUIPMENT MANUFACTURER IMPLEMENTS ROCKWELL AUTOMATION’S SOLUTIONS
           5.11.3 OSSID IMPROVES RELIABILITY AND PERFORMANCE OF MACHINERY USING MITSUBISHI ELECTRIC’S AUTOMATION PORTFOLIO
           5.11.4 AUTOMOTIVE INSPECTION CENTER IMPLEMENTS ADVANTECH’S WISE-PAAS END-TO-CLOUD IOT TOTAL SOLUTION FOR REMOTE VIDEO SURVEILLANCE AND DEVICE STATUS MONITORING AND CONTROL
           5.11.5 OPTIMA CONTROL SOLUTIONS AND ROCKWELL AUTOMATION PROVIDE AUTOMATED MONITORING SOLUTIONS TO BISCUIT MANUFACTURER
           5.11.6 WIND POWER PLANT DEPLOYS ADVANTECH’S PLANT MONITORING SOLUTION
    5.12 KEY CONFERENCES AND EVENTS, 2023–2024 
           TABLE 10 INDUSTRIAL COMMUNICATIONS MARKET: CONFERENCES AND EVENTS, 2023–2024
    5.13 TARIFF AND REGULATORY LANDSCAPE 
           5.13.1 REGULATORY BODIES, GOVERNMENT AGENCIES, AND OTHER ORGANIZATIONS
                    TABLE 11 INDUSTRIAL COMMUNICATIONS MARKET: REGULATORY BODIES, GOVERNMENT AGENCIES, AND OTHER ORGANIZATIONS
           5.13.2 TARIFFS
           5.13.3 STANDARDS
           5.13.4 REGULATIONS
    5.14 PRICING ANALYSIS 
           5.14.1 AVERAGE SELLING PRICE (ASP) TRENDS
                    FIGURE 33 INDICATIVE AVERAGE SELLING PRICE (ASP), BY COMPONENT TYPE
                    TABLE 12 PRICING ANALYSIS
 
6 INDUSTRIAL COMMUNICATIONS MARKET, BY OFFERING (Page No. - 80)
    6.1 INTRODUCTION 
           FIGURE 34 INDUSTRIAL COMMUNICATIONS MARKET, BY OFFERING
           FIGURE 35 COMPONENTS TO ACCOUNT FOR LARGEST SIZE OF INDUSTRIAL COMMUNICATIONS MARKET IN 2028
           TABLE 13 INDUSTRIAL COMMUNICATIONS MARKET, BY OFFERING, 2019–2022 (USD BILLION)
           TABLE 14 INDUSTRIAL COMMUNICATIONS MARKET, BY OFFERING, 2023–2028 (USD BILLION)
    6.2 COMPONENTS 
           TABLE 15 INDUSTRIAL COMMUNICATIONS MARKET, BY COMPONENT, 2019–2022 (USD MILLION)
           TABLE 16 INDUSTRIAL COMMUNICATIONS MARKET, BY COMPONENT, 2023–2028 (USD MILLION)
           6.2.1 SWITCHES
                    6.2.1.1 High security and durability allow switches to build reliable network connections between interconnected computers
           6.2.2 GATEWAYS
                    6.2.2.1 Secure and efficient communications through gateways back Industry 4.0 and smart factory applications
           6.2.3 ROUTERS & WAP
                    6.2.3.1 Compatibility with 5G technology in routers supports seamless industrial communications
           6.2.4 CONTROLLERS & CONNECTORS
                    6.2.4.1 Determining priorities of tasks and interruptions make controllers vital for industrial communications systems
           6.2.5 COMMUNICATION INTERFACES & CONVERTERS
                    6.2.5.1 Various protocols assist communication interfaces in communicating with different network devices
           6.2.6 POWER SUPPLY DEVICES
                    6.2.6.1 High-performance integrated PMICS useful in communications power management
           6.2.7 OTHERS
    6.3 SOFTWARE 
           6.3.1 NETWORKING MANAGEMENT SOFTWARE OPTIMIZE NETWORK EFFICIENCY AND MINIMIZE TOTAL COST OF OWNERSHIP
    6.4 SERVICES 
           6.4.1 INDUSTRIAL COMMUNICATIONS SERVICES SUPPORT INTEGRATION OF DEVICES, MACHINES, AND SYSTEMS WITHIN IIOT ECOSYSTEM
 
7 INDUSTRIAL COMMUNICATIONS MARKET, BY COMMUNICATION PROTOCOL (Page No. - 88)
    7.1 INTRODUCTION 
           FIGURE 36 INDUSTRIAL COMMUNICATIONS MARKET, BY COMMUNICATION PROTOCOL
           FIGURE 37 INDUSTRIAL COMMUNICATIONS MARKET FOR WIRELESS COMMUNICATIONS PROTOCOL TO EXHIBIT HIGHEST CAGR DURING FORECAST PERIOD
           TABLE 17 INDUSTRIAL COMMUNICATIONS MARKET, BY COMMUNICATION PROTOCOL, 2019–2022 (USD MILLION)
           TABLE 18 INDUSTRIAL COMMUNICATIONS MARKET, BY COMMUNICATION PROTOCOL, 2023–2028 (USD MILLION)
    7.2 FIELDBUS 
           TABLE 19 FIELDBUS: INDUSTRIAL COMMUNICATIONS MARKET, BY REGION, 2019–2022 (USD MILLION)
           TABLE 20 FIELDBUS: INDUSTRIAL COMMUNICATIONS MARKET, BY REGION, 2023–2028 (USD MILLION)
           TABLE 21 FIELDBUS: INDUSTRIAL COMMUNICATIONS MARKET IN NORTH AMERICA, BY COUNTRY, 2019–2022 (USD MILLION)
           TABLE 22 FIELDBUS: INDUSTRIAL COMMUNICATIONS MARKET IN NORTH AMERICA, BY COUNTRY, 2023–2028 (USD MILLION)
           TABLE 23 FIELDBUS: INDUSTRIAL COMMUNICATIONS MARKET IN EUROPE, BY COUNTRY, 2019–2022 (USD MILLION)
           TABLE 24 FIELDBUS: INDUSTRIAL COMMUNICATIONS MARKET IN EUROPE, BY COUNTRY, 2023–2028 (USD MILLION)
           TABLE 25 FIELDBUS: INDUSTRIAL COMMUNICATIONS MARKET IN ASIA PACIFIC, BY COUNTRY, 2019–2022 (USD MILLION)
           TABLE 26 FIELDBUS: INDUSTRIAL COMMUNICATIONS MARKET IN ASIA PACIFIC, BY COUNTRY, 2023–2028 (USD MILLION)
           TABLE 27 FIELDBUS: INDUSTRIAL COMMUNICATIONS MARKET IN ROW, BY REGION, 2019–2022 (USD MILLION)
           TABLE 28 FIELDBUS: INDUSTRIAL COMMUNICATIONS MARKET IN ROW, BY REGION, 2023–2028 (USD MILLION)
           7.2.1 PROFIBUS
                    7.2.1.1 PROFIBUS links automation systems and controllers with decentralized field devices
           7.2.2 MODBUS
                    7.2.2.1 Modbus runs over different communication media, including wired and wireless media and optical networks
           7.2.3 CC-LINK
                    7.2.3.1 CC-Link integrates system control and communications
           7.2.4 DEVICENET
                    7.2.4.1 DeviceNet facilitates communication between field-level and high-level devices
           7.2.5 CANOPEN
                    7.2.5.1 CANopen implemented in embedded networking applications
           7.2.6 OTHERS
    7.3 INDUSTRIAL ETHERNET 
           TABLE 29 INDUSTRIAL ETHERNET: INDUSTRIAL COMMUNICATIONS MARKET, BY REGION, 2019–2022 (USD MILLION)
           TABLE 30 INDUSTRIAL ETHERNET: INDUSTRIAL COMMUNICATIONS MARKET, BY REGION, 2023–2028 (USD MILLION)
           TABLE 31 INDUSTRIAL ETHERNET: INDUSTRIAL COMMUNICATIONS MARKET IN NORTH AMERICA, BY COUNTRY, 2019–2022 (USD MILLION)
           TABLE 32 INDUSTRIAL ETHERNET: INDUSTRIAL COMMUNICATIONS MARKET IN NORTH AMERICA, BY COUNTRY, 2023–2028 (USD MILLION)
           TABLE 33 INDUSTRIAL ETHERNET: INDUSTRIAL COMMUNICATIONS MARKET IN EUROPE, BY COUNTRY, 2019–2022 (USD MILLION)
           TABLE 34 INDUSTRIAL ETHERNET: INDUSTRIAL COMMUNICATIONS MARKET IN EUROPE, BY COUNTRY, 2023–2028 (USD MILLION)
           TABLE 35 INDUSTRIAL ETHERNET: INDUSTRIAL COMMUNICATIONS MARKET IN ASIA PACIFIC, BY COUNTRY, 2019–2022 (USD MILLION)
           TABLE 36 INDUSTRIAL ETHERNET: INDUSTRIAL COMMUNICATIONS MARKET IN ASIA PACIFIC, BY COUNTRY, 2023–2028 (USD MILLION)
           TABLE 37 INDUSTRIAL ETHERNET: INDUSTRIAL COMMUNICATIONS MARKET IN ROW, BY REGION, 2019–2022 (USD MILLION)
           TABLE 38 INDUSTRIAL ETHERNET: INDUSTRIAL COMMUNICATIONS MARKET IN ROW, BY REGION, 2023–2028 (USD MILLION)
           7.3.1 PROFINET
                    7.3.1.1 PROFINET supplements existing PROFIBUS technologies by providing faster data communications
           7.3.2 ETHERNET/IP
                    7.3.2.1 Ethernet/IP widely used in hybrid and process industries
           7.3.3 ETHERCAT
                    7.3.3.1 EtherCAT specifically designed for fast control demand applications
           7.3.4 MODBUS-TCP
                    7.3.4.1 MODBUS-TCP offers high level of interoperability for industrial communications network devices
           7.3.5 POWERLINK
                    7.3.5.1 Ethernet Powerlink enables transfer of time-critical data in short duration
           7.3.6 SERCOS III
                    7.3.6.1 SERCOS III provides low-latency data transfer
           7.3.7 CC-LINK IE
                    7.3.7.1 CC-Link IE supports flexible wiring topologies, such as star, ring, and line configuration
    7.4 WIRELESS 
           TABLE 39 WIRELESS: INDUSTRIAL COMMUNICATIONS MARKET, BY REGION, 2019–2022 (USD MILLION)
           TABLE 40 WIRELESS: INDUSTRIAL COMMUNICATIONS MARKET, BY REGION, 2023–2028 (USD MILLION)
           TABLE 41 WIRELESS: INDUSTRIAL COMMUNICATIONS MARKET IN NORTH AMERICA, BY COUNTRY, 2019–2022 (USD MILLION)
           TABLE 42 WIRELESS: INDUSTRIAL COMMUNICATIONS MARKET IN NORTH AMERICA, BY COUNTRY, 2023–2028 (USD MILLION)
           TABLE 43 WIRELESS: INDUSTRIAL COMMUNICATIONS MARKET IN EUROPE, BY COUNTRY, 2019–2022 (USD MILLION)
           TABLE 44 WIRELESS: INDUSTRIAL COMMUNICATIONS MARKET IN EUROPE, BY COUNTRY, 2023–2028 (USD MILLION)
           TABLE 45 WIRELESS: INDUSTRIAL COMMUNICATIONS MARKET IN ASIA PACIFIC, BY COUNTRY, 2019–2022 (USD MILLION)
           TABLE 46 WIRELESS: INDUSTRIAL COMMUNICATIONS MARKET IN ASIA PACIFIC, BY COUNTRY, 2023–2028 (USD MILLION)
           TABLE 47 WIRELESS: INDUSTRIAL COMMUNICATIONS MARKET IN ROW, BY REGION, 2019–2022 (USD MILLION)
           TABLE 48 WIRELESS: INDUSTRIAL COMMUNICATIONS MARKET IN ROW, BY REGION, 2023–2028 (USD MILLION)
           7.4.1 WLAN
                    7.4.1.1 WLAN provides wide area coverage and faster communications
           7.4.2 ISA100.11A
                    7.4.2.1 ISA 100 operates in 2.4 MHz frequency range and supports up to 15 channels
           7.4.3 CELLULAR
                    7.4.3.1 Cellular networks ideal for Iiot applications that require operations over long distances
           7.4.4 ZIGBEE
                    7.4.4.1 Zigbee offers reliable, cost-effective, low-power network structure
           7.4.5 WHART
                    7.4.5.1 WHART designed for field-level wireless communication requirements in process industries
           7.4.6 OTHERS
 
8 INDUSTRIAL COMMUNICATIONS MARKET, BY VERTICAL (Page No. - 108)
    8.1 INTRODUCTION 
           FIGURE 38 INDUSTRIAL COMMUNICATIONS MARKET, BY VERTICAL
           FIGURE 39 AUTOMOTIVE VERTICAL TO DOMINATE INDUSTRIAL COMMUNICATIONS MARKET IN 2023
           TABLE 49 INDUSTRIAL COMMUNICATIONS MARKET, BY VERTICAL, 2019–2022 (USD MILLION)
           TABLE 50 INDUSTRIAL COMMUNICATIONS MARKET, BY VERTICAL, 2023–2028 (USD MILLION)
    8.2 AUTOMOTIVE 
           8.2.1 INCREASED PENETRATION OF INDUSTRIAL COMMUNICATIONS SOLUTIONS IN AUTOMOTIVE MANUFACTURING TO DRIVE MARKET
                    TABLE 51 AUTOMOTIVE: INDUSTRIAL COMMUNICATIONS MARKET, BY REGION, 2019–2022 (USD MILLION)
                    TABLE 52 AUTOMOTIVE: INDUSTRIAL COMMUNICATIONS MARKET, BY REGION, 2023–2028 (USD MILLION)
    8.3 ELECTRICAL & ELECTRONICS 
           8.3.1 NEED TO REDUCE DOWNTIME IN ELECTRONICS MANUFACTURING TO FUEL MARKET GROWTH
                    TABLE 53 ELECTRICAL & ELECTRONICS: INDUSTRIAL COMMUNICATIONS MARKET, BY REGION, 2019–2022 (USD MILLION)
                    TABLE 54 ELECTRICAL & ELECTRONICS: INDUSTRIAL COMMUNICATIONS MARKET, BY REGION, 2023–2028 (USD MILLION)
    8.4 AEROSPACE & DEFENSE 
           8.4.1 IMPLEMENTATION OF INDUSTRIAL COMMUNICATIONS TO ENSURE EFFECTIVE MANUFACTURING PROCESSES TO DRIVE MARKET
                    TABLE 55 AEROSPACE & DEFENSE: INDUSTRIAL COMMUNICATIONS MARKET, BY REGION, 2019–2022 (USD MILLION)
                    TABLE 56 AEROSPACE & DEFENSE: INDUSTRIAL COMMUNICATIONS MARKET, BY REGION, 2023–2028 (USD MILLION)
    8.5 OIL & GAS 
           8.5.1 INCREASING OFFSHORE OIL & GAS ACTIVITIES TO LEAD TO RISING ADOPTION OF AUTOMATION SOLUTIONS
                    TABLE 57 OIL & GAS: INDUSTRIAL COMMUNICATIONS MARKET, BY REGION, 2019–2022 (USD MILLION)
                    TABLE 58 OIL & GAS: INDUSTRIAL COMMUNICATIONS MARKET, BY REGION, 2023–2028 (USD MILLION)
    8.6 CHEMICALS & FERTILIZERS 
           8.6.1 HIGH SAFETY LEVELS REQUIRED IN CHEMICAL INDUSTRY TO PROPEL MARKET GROWTH FOR INDUSTRIAL COMMUNICATIONS
                    TABLE 59 CHEMICALS & FERTILIZERS: INDUSTRIAL COMMUNICATIONS MARKET, BY REGION, 2019–2022 (USD MILLION)
                    TABLE 60 CHEMICALS & FERTILIZERS: INDUSTRIAL COMMUNICATIONS MARKET, BY REGION, 2023–2028 (USD MILLION)
    8.7 FOOD & BEVERAGES 
           8.7.1 RAPID PENETRATION OF AUTOMATION IN FOOD & BEVERAGES INDUSTRY TO DRIVE DEMAND FOR INDUSTRIAL COMMUNICATIONS SOLUTIONS
                    TABLE 61 FOOD & BEVERAGES: INDUSTRIAL COMMUNICATIONS MARKET, BY REGION, 2019–2022 (USD MILLION)
                    TABLE 62 FOOD & BEVERAGES: INDUSTRIAL COMMUNICATIONS MARKET, BY REGION, 2023–2028 (USD MILLION)
    8.8 PHARMACEUTICALS & MEDICAL DEVICES 
           8.8.1 ADOPTION OF AUTOMATION AND SENSING TECHNOLOGIES IN PHARMACEUTICAL INDUSTRY TO BOOST MARKET GROWTH
                    TABLE 63 PHARMACEUTICALS & MEDICAL DEVICES: INDUSTRIAL COMMUNICATIONS MARKET, BY REGION, 2019–2022 (USD MILLION)
                    TABLE 64 PHARMACEUTICALS & MEDICAL DEVICES: INDUSTRIAL COMMUNICATIONS MARKET, BY REGION, 2023–2028 (USD MILLION)
    8.9 ENERGY & POWER 
           8.9.1 DEMAND FOR COMMUNICATIONS NETWORKS FOR DATA RETRIEVAL IN ENERGY & POWER PLANTS TO DRIVE MARKET
                    TABLE 65 ENERGY & POWER: INDUSTRIAL COMMUNICATIONS MARKET, BY REGION, 2019–2022 (USD MILLION)
                    TABLE 66 ENERGY & POWER: INDUSTRIAL COMMUNICATIONS MARKET, BY REGION, 2023–2028 (USD MILLION)
    8.10 METALS & MINING 
           8.10.1 ENSURING WORKER SAFETY IN MINING INDUSTRY TO LEAD TO MARKET GROWTH
                    TABLE 67 METALS & MINING: INDUSTRIAL COMMUNICATIONS MARKET, BY REGION, 2019–2022 (USD MILLION)
                    TABLE 68 METALS & MINING: INDUSTRIAL COMMUNICATIONS MARKET, BY REGION, 2023–2028 (USD MILLION)
    8.11 ENGINEERING/FABRICATION 
           8.11.1 NETWORKING TECHNOLOGIES ENSURE CONSISTENT AND UNINTERRUPTED CONNECTIVITY FOR WORKERS IN FABRICATION PLANTS
                    TABLE 69 ENGINEERING/FABRICATION: INDUSTRIAL COMMUNICATIONS MARKET, BY REGION, 2019–2022 (USD MILLION)
                    TABLE 70 ENGINEERING/FABRICATION: INDUSTRIAL COMMUNICATIONS MARKET, BY REGION, 2023–2028 (USD MILLION)
    8.12 WATER & WASTEWATER MANAGEMENT 
           8.12.1 LOW-COST, LOW-POWER SENSORS AND EDGE-COMPUTING DEVICES TO INCREASE EFFICIENCY TO FUEL MARKET GROWTH
                    TABLE 71 WATER & WASTEWATER MANAGEMENT: INDUSTRIAL COMMUNICATIONS MARKET, BY REGION, 2019–2022 (USD MILLION)
                    TABLE 72 WATER & WASTEWATER MANAGEMENT: INDUSTRIAL COMMUNICATIONS MARKET, BY REGION, 2023–2028 (USD MILLION)
    8.13 OTHERS 
           TABLE 73 OTHERS: INDUSTRIAL COMMUNICATIONS MARKET, BY REGION, 2019–2022 (USD MILLION)
           TABLE 74 OTHERS: INDUSTRIAL COMMUNICATIONS MARKET, BY REGION, 2023–2028 (USD MILLION)
 
9 INDUSTRIAL COMMUNICATIONS MARKET, BY REGION (Page No. - 129)
    9.1 INTRODUCTION 
           FIGURE 40 INDUSTRIAL COMMUNICATIONS MARKET IN ASIA PACIFIC TO RECORD HIGHEST CAGR DURING 2023–2028
           TABLE 75 INDUSTRIAL COMMUNICATIONS MARKET, BY REGION, 2019–2022 (USD BILLION)
           TABLE 76 INDUSTRIAL COMMUNICATIONS MARKET, BY REGION, 2023–2028 (USD BILLION)
    9.2 NORTH AMERICA 
           9.2.1 IMPACT OF RECESSION ON INDUSTRIAL COMMUNICATIONS MARKET IN NORTH AMERICA
                    TABLE 77 NORTH AMERICA: INDUSTRIAL COMMUNICATIONS MARKET, BY COMMUNICATION PROTOCOL, 2019–2022 (USD MILLION)
                    TABLE 78 NORTH AMERICA: INDUSTRIAL COMMUNICATIONS MARKET, BY COMMUNICATION PROTOCOL, 2023–2028 (USD MILLION)
                    TABLE 79 NORTH AMERICA: INDUSTRIAL COMMUNICATIONS MARKET, BY COUNTRY, 2019–2022 (USD MILLION)
                    TABLE 80 NORTH AMERICA: INDUSTRIAL COMMUNICATIONS MARKET, BY COUNTRY, 2023–2028 (USD MILLION)
                    TABLE 81 NORTH AMERICA: INDUSTRIAL COMMUNICATIONS MARKET, BY VERTICAL, 2019–2022 (USD MILLION)
                    TABLE 82 NORTH AMERICA: INDUSTRIAL COMMUNICATIONS MARKET, BY VERTICAL, 2023–2028 (USD MILLION)
                    FIGURE 41 NORTH AMERICA: INDUSTRIAL COMMUNICATIONS MARKET SNAPSHOT
           9.2.2 US
                    9.2.2.1 Ideal environment for innovation to facilitate massive advancements in industrial communications
           9.2.3 CANADA
                    9.2.3.1 Growing investments in automated manufacturing technologies for process and discrete industries to contribute to market growth
           9.2.4 MEXICO
                    9.2.4.1 Deployment of 5G for industrial communications to support market growth
    9.3 EUROPE 
           9.3.1 IMPACT OF RECESSION ON INDUSTRIAL COMMUNICATIONS MARKET IN EUROPE
                    FIGURE 42 EUROPE: INDUSTRIAL COMMUNICATIONS MARKET SNAPSHOT
                    TABLE 83 EUROPE: INDUSTRIAL COMMUNICATIONS MARKET, BY COMMUNICATION PROTOCOL, 2019–2022 (USD MILLION)
                    TABLE 84 EUROPE: INDUSTRIAL COMMUNICATIONS MARKET, BY COMMUNICATION PROTOCOL, 2023–2028 (USD MILLION)
                    TABLE 85 EUROPE: INDUSTRIAL COMMUNICATIONS MARKET, BY COUNTRY, 2019–2022 (USD MILLION)
                    TABLE 86 EUROPE: INDUSTRIAL COMMUNICATIONS MARKET, BY COUNTRY, 2023–2028 (USD MILLION)
                    TABLE 87 EUROPE: INDUSTRIAL COMMUNICATIONS MARKET, BY VERTICAL, 2019–2022 (USD MILLION)
                    TABLE 88 EUROPE: INDUSTRIAL COMMUNICATIONS MARKET, BY VERTICAL 2023–2028 (USD MILLION)
           9.3.2 UK
                    9.3.2.1 Increasing adoption of automation in manufacturing to fuel market growth
           9.3.3 GERMANY
                    9.3.3.1 Growing demand for industrial communications solutions in automotive industry to propel market growth
           9.3.4 FRANCE
                    9.3.4.1 Government initiatives promoting adoption of advanced technologies to drive market
           9.3.5 SPAIN
                    9.3.5.1 Demand for industrial communications offerings from automobile industry to boost market growth
           9.3.6 ITALY
                    9.3.6.1 Automobile manufacturing to fuel growth of industrial communications market
           9.3.7 REST OF EUROPE
    9.4 ASIA PACIFIC 
           9.4.1 IMPACT OF RECESSION ON INDUSTRIAL COMMUNICATIONS MARKET IN ASIA PACIFIC
                    FIGURE 43 ASIA PACIFIC: INDUSTRIAL COMMUNICATIONS MARKET SNAPSHOT
                    TABLE 89 ASIA PACIFIC: INDUSTRIAL COMMUNICATIONS MARKET, BY COMMUNICATION PROTOCOL, 2019–2022 (USD MILLION)
                    TABLE 90 ASIA PACIFIC: INDUSTRIAL COMMUNICATIONS MARKET, BY COMMUNICATION PROTOCOL, 2023–2028 (USD MILLION)
                    TABLE 91 ASIA PACIFIC: INDUSTRIAL COMMUNICATIONS MARKET, BY COUNTRY, 2019–2022 (USD MILLION)
                    TABLE 92 ASIA PACIFIC: INDUSTRIAL COMMUNICATIONS MARKET, BY COUNTRY, 2023–2028 (USD MILLION)
                    TABLE 93 ASIA PACIFIC: INDUSTRIAL COMMUNICATIONS MARKET, BY VERTICAL, 2019–2022 (USD MILLION)
                    TABLE 94 ASIA PACIFIC: INDUSTRIAL COMMUNICATIONS MARKET, BY VERTICAL, 2023–2028 (USD MILLION)
           9.4.2 CHINA
                    9.4.2.1 Surging use of industrial communications solutions in automotive sector to propel market growth
           9.4.3 JAPAN
                    9.4.3.1 Ongoing technological developments in different industries to lead to deployment of advanced automation solutions
           9.4.4 INDIA
                    9.4.4.1 Increasing government investments in industrial automation to drive market
           9.4.5 SOUTH KOREA
                    9.4.5.1 Robust manufacturing sector to boost adoption of industrial communications solutions
           9.4.6 REST OF ASIA PACIFIC
    9.5 REST OF THE WORLD (ROW) 
           9.5.1 IMPACT OF RECESSION ON INDUSTRIAL COMMUNICATIONS MARKET IN ROW
                    TABLE 95 ROW: INDUSTRIAL COMMUNICATIONS MARKET, BY COMMUNICATION PROTOCOL, 2019–2022 (USD MILLION)
                    TABLE 96 ROW: INDUSTRIAL COMMUNICATIONS MARKET, BY COMMUNICATION PROTOCOL, 2023–2028 (USD MILLION)
                    TABLE 97 ROW: INDUSTRIAL COMMUNICATIONS MARKET, BY REGION, 2019–2022 (USD MILLION)
                    TABLE 98 ROW: INDUSTRIAL COMMUNICATIONS MARKET, BY REGION, 2023–2028 (USD MILLION)
                    TABLE 99 ROW: INDUSTRIAL COMMUNICATIONS MARKET, BY VERTICAL, 2019–2022 (USD MILLION)
                    TABLE 100 ROW: INDUSTRIAL COMMUNICATIONS MARKET, BY VERTICAL, 2023–2028 (USD MILLION)
           9.5.2 LATIN AMERICA
                    9.5.2.1 Rising deployment of factory automation solutions in different industries to boost market growth
           9.5.3 MIDDLE EAST
                    9.5.3.1 Increasing adoption of automation solutions in oil & gas industry to drive market
           9.5.4 AFRICA
                    9.5.4.1 Growing industrialization to increase demand for industrial communications
 
10 COMPETITIVE LANDSCAPE (Page No. - 155)
     10.1 OVERVIEW 
     10.2 MARKET EVALUATION FRAMEWORK 
             TABLE 101 OVERVIEW OF STRATEGIES ADOPTED BY TOP FIVE MANUFACTURERS IN INDUSTRIAL COMMUNICATIONS MARKET FROM 2020 TO 2023
             10.2.1 PRODUCT PORTFOLIO
             10.2.2 REGIONAL FOCUS
             10.2.3 MANUFACTURING FOOTPRINT
             10.2.4 ORGANIC/INORGANIC GROWTH STRATEGIES
     10.3 INDUSTRIAL COMMUNICATIONS MARKET: MARKET SHARE ANALYSIS, 2022 
             TABLE 102 INDUSTRIAL COMMUNICATIONS MARKET: MARKET SHARE ANALYSIS (2022)
     10.4 FIVE-YEAR COMPANY REVENUE ANALYSIS 
             FIGURE 44 FIVE-YEAR REVENUE ANALYSIS OF TOP FIVE PLAYERS
     10.5 KEY COMPANY EVALUATION MATRIX, 2022 
             10.5.1 STARS
             10.5.2 EMERGING LEADERS
             10.5.3 PERVASIVE PLAYERS
             10.5.4 PARTICIPANTS
                        FIGURE 45 INDUSTRIAL COMMUNICATIONS MARKET: KEY COMPANY EVALUATION MATRIX, 2022
     10.6 COMPANY FOOTPRINT 
             TABLE 103 OVERALL COMPANY FOOTPRINT (25 PLAYERS)
             TABLE 104 COMPANY FOOTPRINT, BY OFFERING (25 PLAYERS)
             TABLE 105 COMPANY FOOTPRINT, BY VERTICAL (25 PLAYERS)
             TABLE 106 COMPANY FOOTPRINT, BY REGION (25 PLAYERS)
     10.7 START-UPS/SMES EVALUATION MATRIX, 2022 
             10.7.1 PROGRESSIVE COMPANIES
             10.7.2 RESPONSIVE COMPANIES
             10.7.3 DYNAMIC COMPANIES
             10.7.4 STARTING BLOCKS
                        FIGURE 46 INDUSTRIAL COMMUNICATIONS MARKET: START-UPS/SMES EVALUATION MATRIX, 2022
             10.7.5 COMPETITIVE BENCHMARKING
                        TABLE 107 INDUSTRIAL COMMUNICATIONS MARKET: DETAILED LIST OF KEY START-UPS/SMES
                        TABLE 108 INDUSTRIAL COMMUNICATIONS MARKET: COMPETITIVE BENCHMARKING OF START-UPS/SMES
     10.8 COMPETITIVE SCENARIOS AND TRENDS 
             10.8.1 PRODUCT LAUNCHES
                        TABLE 109 PRODUCT LAUNCHES, 2020–2023
             10.8.2 DEALS
                        TABLE 110 DEALS, 2020–2023
             10.8.3 OTHERS
                        TABLE 111 OTHERS, 2020–2023
 
11 COMPANY PROFILES (Page No. - 176)
     11.1 KEY PLAYERS 
(Business overview, Products/Services/Solutions offered, Recent developments, MnM view, Key strengths/Right to win, Strategic choices, and Weaknesses/Competitive threats)*  
             11.1.1 CISCO SYSTEMS, INC.
                        TABLE 112 CISCO SYSTEMS, INC.: COMPANY OVERVIEW
                        FIGURE 47 CISCO SYSTEMS, INC.: COMPANY SNAPSHOT
                        TABLE 113 CISCO SYSTEMS, INC.: PRODUCT/SERVICE/SOLUTION OFFERED
                        TABLE 114 CISCO SYSTEMS, INC.: PRODUCT LAUNCHES
                        TABLE 115 CISCO SYSTEMS, INC.: DEALS
             11.1.2 SIEMENS
                        TABLE 116 SIEMENS: COMPANY OVERVIEW
                        FIGURE 48 SIEMENS: COMPANY SNAPSHOT
                        TABLE 117 SIEMENS: PRODUCT/SERVICE/SOLUTION OFFERED
                        TABLE 118 SIEMENS: PRODUCT LAUNCHES
                        TABLE 119 SIEMENS: DEALS
             11.1.3 ROCKWELL AUTOMATION
                        TABLE 120 ROCKWELL AUTOMATION: COMPANY OVERVIEW
                        FIGURE 49 ROCKWELL AUTOMATION: COMPANY SNAPSHOT
                        TABLE 121 ROCKWELL AUTOMATION: PRODUCT/SERVICE/SOLUTION OFFERED
                        TABLE 122 ROCKWELL AUTOMATION: PRODUCT LAUNCHES
                        TABLE 123 ROCKWELL AUTOMATION: DEALS
             11.1.4 OMRON CORPORATION
                        TABLE 124 OMRON CORPORATION: COMPANY OVERVIEW
                        FIGURE 50 OMRON CORPORATION: COMPANY SNAPSHOT
                        TABLE 125 OMRON CORPORATION: PRODUCT/SERVICE/SOLUTION OFFERED
                        TABLE 126 OMRON CORPORATION: PRODUCT LAUNCHES
                        TABLE 127 OMRON CORPORATION: DEALS
             11.1.5 MOXA INC.
                        TABLE 128 MOXA INC.: COMPANY OVERVIEW
                        TABLE 129 MOXA INC.: PRODUCT/SERVICE/SOLUTION OFFERED
                        TABLE 130 MOXA INC.: PRODUCT LAUNCHES
                        TABLE 131 MOXA INC.: DEALS
             11.1.6 HUAWEI TECHNOLOGIES CO., LTD.
                        TABLE 132 HUAWEI TECHNOLOGIES CO., LTD.: COMPANY OVERVIEW
                        FIGURE 51 HUAWEI TECHNOLOGIES CO., LTD.: COMPANY SNAPSHOT
                        TABLE 133 HUAWEI TECHNOLOGIES CO., LTD.: PRODUCT/SERVICE/SOLUTION OFFERED
                        TABLE 134 HUAWEI TECHNOLOGIES CO., LTD.: PRODUCT LAUNCHES
                        TABLE 135 HUAWEI TECHNOLOGIES CO., LTD.: DEALS
                        TABLE 136 HUAWEI TECHNOLOGIES CO., LTD.: OTHERS
             11.1.7 SICK AG
                        TABLE 137 SICK AG: COMPANY OVERVIEW
                        FIGURE 52 SICK AG: COMPANY SNAPSHOT
                        TABLE 138 SICK AG: PRODUCT/SERVICE/SOLUTION OFFERED
                        TABLE 139 SICK AG: PRODUCT LAUNCHES
                        TABLE 140 SICK AG: DEALS
                        TABLE 141 SICK AG: OTHERS
             11.1.8 SCHNEIDER ELECTRIC
                        TABLE 142 SCHNEIDER ELECTRIC: COMPANY OVERVIEW
                        FIGURE 53 SCHNEIDER ELECTRIC: COMPANY SNAPSHOT
                        TABLE 143 SCHNEIDER ELECTRIC: PRODUCT/SERVICE/SOLUTION OFFERED
                        TABLE 144 SCHNEIDER ELECTRIC: DEALS
                        TABLE 145 SCHNEIDER ELECTRIC: OTHERS
             11.1.9 ABB
                        TABLE 146 ABB: COMPANY OVERVIEW
                        FIGURE 54 ABB: COMPANY SNAPSHOT
                        TABLE 147 ABB: PRODUCT/SERVICE/SOLUTION OFFERED
                        TABLE 148 ABB: DEALS
                        TABLE 149 ABB: OTHERS
             11.1.10 BELDEN INC.
                        TABLE 150 BELDEN INC.: COMPANY OVERVIEW
                        FIGURE 55 BELDEN INC.: COMPANY SNAPSHOT
                        TABLE 151 BELDEN INC.: PRODUCT/SERVICE/SOLUTION OFFERED
                        TABLE 152 BELDEN INC.: PRODUCT LAUNCHES
                        TABLE 153 BELDEN INC.: DEALS
     11.2 OTHER PLAYERS 
             11.2.1 GE
             11.2.2 ADVANTECH CO., LTD.
             11.2.3 IFM ELECTRONIC GMBH
             11.2.4 FANUC CORPORATION
             11.2.5 BOSCH REXROTH AG
             11.2.6 AAEON TECHNOLOGY INC.
             11.2.7 HMS NETWORKS
             11.2.8 HONEYWELL INTERNATIONAL INC.
             11.2.9 MITSUBISHI ELECTRIC CORPORATION
             11.2.10 TELEFONAKTIEBOLAGET LM ERICSSON
             11.2.11 HANS TURCK GMBH & CO. KG
             11.2.12 ACS MOTION CONTROL
             11.2.13 EATON
             11.2.14 BECKHOFF AUTOMATION
             11.2.15 HITACHI, LTD.
*Details on Business overview, Products/Services/Solutions offered, Recent developments, MnM view, Key strengths/Right to win, Strategic choices, and Weaknesses/Competitive threats might not be captured in case of unlisted companies.  
 
12 APPENDIX (Page No. - 235)
     12.1 DISCUSSION GUIDE 
     12.2 KNOWLEDGESTORE: MARKETSANDMARKETS’ SUBSCRIPTION PORTAL 
     12.3 CUSTOMIZATION OPTIONS 
     12.4 RELATED REPORTS 
     12.5 AUTHOR DETAILS 


The study involved four major activities in estimating the size of the industrial communication market. Exhaustive secondary research has been carried out to collect information on the market, the peer markets, and the parent market. Both top-down and bottom-up approaches have been employed to estimate the total market size. Market breakdown and data triangulation methods have also been used to estimate the market for segments and subsegments.

Secondary Research

Revenues of companies offering industrial communication components, software, and services have been obtained from the secondary data available through paid and unpaid sources. The revenues have also been derived by analyzing the product portfolio of key companies, and these companies have been rated according to the performance and quality of their products.

In the secondary research process, various secondary sources have been referred to for identifying and collecting information important for this study. Secondary sources include corporate filings (such as annual reports, investor presentations, and financial statements); trade, business, and professional associations; white papers; IoT technologies journals and certified publications; articles by recognized authors; gold-standard and silver-standard websites; directories; and databases.

Secondary research has been mainly conducted to obtain critical information about the value chain of the market, the total pool of key players, market classification and segmentation according to the industry trends to the bottom-most level, geographic markets, and key developments from both market- and technology-oriented perspectives. Secondary data has been collected and analyzed to arrive at the overall market size, which has been further validated by primary research.

Primary Research

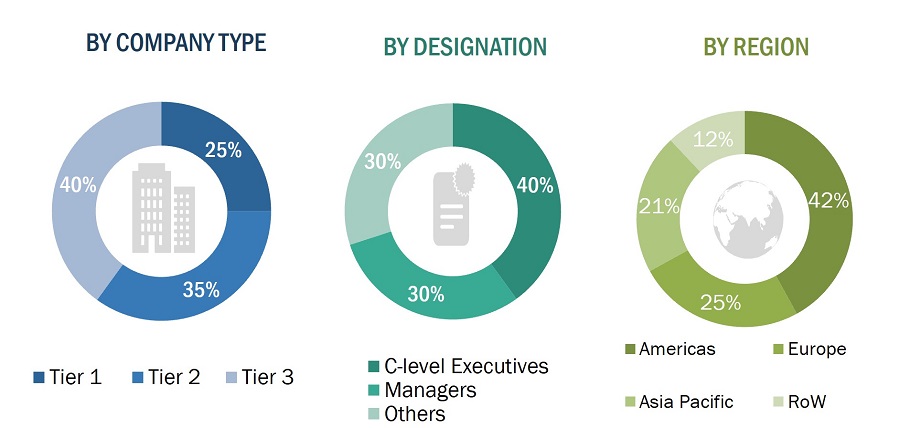
Extensive primary research has been conducted after understanding and analyzing the current scenario of the industrial communication market through secondary research. Several primary interviews have been conducted with key opinion leaders from both demand and supply sides across 4 major regions: North America, Europe, Asia Pacific, and RoW. Approximately 25% of the primary interviews have been conducted with the demand side, while 75% have been conducted with the supply side. Primary data has been collected mainly through telephonic interviews, which consist of 80% of the total primary interviews. Questionnaires and e-mails have also been used to collect data.

After interacting with industry experts, brief sessions were conducted with highly experienced independent consultants to reinforce the findings from our primary. This, along with the in-house subject matter experts’ opinions, has led us to the findings as described in the remainder of this report. The breakdown of primary respondents is as follows:
Industrial Communication Market Size, and Share

To know about the assumptions considered for the study, download the pdf brochure

Market Size Estimation

The bottom-up procedure has been employed to arrive at the overall size of the industrial communication market.

  • Identifying end users that are either using or are expected to use industrial communications
  • Tracking leading companies and other key manufacturers operating across various sectors
  • Deriving the size of the industrial communication market through the data sanity method; analyzing revenues of more than 25 key providers through their annual reports and press releases; and summing them up to estimate the overall market size
  • Understanding and analyzing Y-o-Y projections to derive the projected market values of each type, media, and industry; initially, the Y-o-Y projections showed a moderate growth till 2019. However, with the unfolding of the impact of the COVID-19, the industrial communication market witnessed a slight downfall in 2020 but made a significant recovery in FY 2021/2022. The market is expected to witness a steady increase in its growth thereafter, considering the surging demand for industrial communication from different end users
  • Carrying out the market trend analysis to obtain the CAGR of the industrial communication market by understanding the industry penetration rate and analyzing the demand and supply of industrial communication in different industries
  • Assigning a percentage to the overall revenue or, in a few cases, to segmental revenues of each company to derive their revenues from the sales of industrial communications. This percentage for each company was assigned based on their product portfolios and the range of their industrial communication offerings
  • Verifying and crosschecking estimates at every level through discussions with the key opinion leaders, including CXOs, directors, and operation managers, and with domain experts at MarketsandMarkets
  • Studying various paid and unpaid information sources such as annual reports, press releases, white papers, and databases
  • Tracking the ongoing projects and identifying the upcoming industrial communication implementation projects by companies, and forecasting the market size based on these developments and other critical parameters

Industrial Communication Market Size, and Bottom-Up Approach

Data Triangulation

After arriving at the overall size of the industrial communication market from the estimation process explained earlier, the global market was split into several segments and subsegments. Where applicable, data triangulation and market breakdown procedures have been employed to complete the overall market engineering process and arrive at the exact statistics for all segments and subsegments. The data was triangulated by studying various factors and trends from the demand and supply sides. Additionally, the market size has been validated using top-down and bottom-up approaches.

Market Definition

Industrial communication combines components, software, and standard protocols, allowing man-to-machine and machine-to-machine communications across various industries. Efficient, reliable, and secure industrial communications help improve operational efficiency and reduce the overall operating costs of industries. Industrial communication plays a significant role in oil & gas, electronics, automotive, power generation, and several other sectors.

Key Stakeholders

  • Raw materials, testing and processing equipment vendors, services providers, distributors, and suppliers of industrial communication devices
  • Research organizations
  • Original equipment manufacturers (OEMs)
  • Technology standards organizations, forums, alliances, and associations
  • Analysts and strategic business planners
  • Government bodies, venture capitalists, and private equity firms
  • Industries willing to know more about the industrial communication market and the latest trends

Report Objectives

  • To define, describe, and forecast the industrial communication market, by offering, communication protocol, and vertical, in terms of value
  • To describe and forecast the market size, by region, for North America, Europe, Asia Pacific (Asia Pacific), and the Rest of the World (RoW), in terms of value
  • To provide detailed information regarding the drivers, restraints, opportunities, and challenges influencing the growth of the market
  • To strategically analyze micromarkets with respect to individual growth trends, prospects, and contributions to the total market
  • To describe the industrial communication value chain
  • To analyze opportunities in the market for stakeholders and describe the competitive landscape of the market
  • To strategically profile key players and comprehensively analyze their market ranking and core competencies
  • To analyze competitive developments such as product developments/launches, expansions, and acquisitions in the market

Available customizations:

With the given market data, MarketsandMarkets offers customizations according to the specific requirements of companies. The following customization options are available for the report:

  • Detailed analysis and profiling of additional market players based on various blocks of the supply chain
Custom Market Research Services

We will customize the research for you, in case the report listed above does not meet with your exact requirements. Our custom research will comprehensively cover the business information you require to help you arrive at strategic and profitable business decisions.

Request Customization

Instant Answers with GPT - Ask Now!

Ask real questions. Get complete answers !
Report Code
SE 4645
Published ON
Jun, 2023
Choose License Type
BUY NOW
  • SHARE
X
Request Customization
Speak to Analyst
Speak to Analyst
OR FACE-TO-FACE MEETING
PERSONALIZE THIS RESEARCH
  • Triangulate with your Own Data
  • Get Data as per your Format and Definition
  • Gain a Deeper Dive on a Specific Application, Geography, Customer or Competitor
  • Any level of Personalization
REQUEST A FREE CUSTOMIZATION
LET US HELP YOU!
  • What are the Known and Unknown Adjacencies Impacting the Industrial Communication Market
  • What will your New Revenue Sources be?
  • Who will be your Top Customer; what will make them switch?
  • Defend your Market Share or Win Competitors
  • Get a Scorecard for Target Partners
CUSTOMIZED WORKSHOP REQUEST
+1-888-600-6441
  • Call Us
  • +1-888-600-6441 (Corporate office hours)
  • +1-888-600-6441 (US/Can toll free)
  • +44-800-368-9399 (UK office hours)
CONNECT WITH US
ABOUT TRUST ONLINE
©2024 MarketsandMarkets Research Private Ltd. All rights reserved
DMCA.com Protection Status Website Feedback