Interconnects and Passive Components Market by Passive Components (Resistor, Capacitor, Inductor, Transformer, and Diode), Interconnect Type (PCB, Connector, Switch, Relay, Adapter, Terminal, Splice, and Socket), Application, and Region - Global Forecast to 2022


Interconnects and Passive Components Market is expected to grow at a CAGR of 4.41% from 2016 and reach USD 187.55 billion by 2022. The base year used for study is 2016 and the forecast period is between 2017 and 2022. This report provides a detailed analysis of the passive and interconnects market based on product type, passive component type, interconnect type, application and geography. It has been estimated that interconnects would hold a larger share of the passive and interconnects market during the forecast period and is expected to grow at a higher CAGR between 2016 and 2022.
To estimate the size of the passive and interconnects market, we have considered top players in the Interconnects and Passive Components Market and their market share in the said market. This research study involves extensive use of secondary sources such as study of annual and financial reports of top players, presentations, press releases, journals, paid databases, and interviews with industry experts.
The research methodology is explained below:
- Analyzing the overall size of the individual markets through the percentage split with the help of primary and secondary research
- Analyzing the several market segments and subsegments
- Analyzing the supply and demand sides of the passive and interconnects ecosystem
- Analyzing the market trends in various regions and countries, supported by the ongoing research and development (R&D) in these regions
- Finalizing the overall market sizes by triangulation with supply side data, which includes the product developments, supply chain, and estimated sales of passive and interconnects market
After arriving at the overall market size, the total market has been split into several segments and subsegments, and confirmed with the key industry experts. The following figure depicts the breakdown of primaries conducted during the research study on the basis of company, designation, and region.
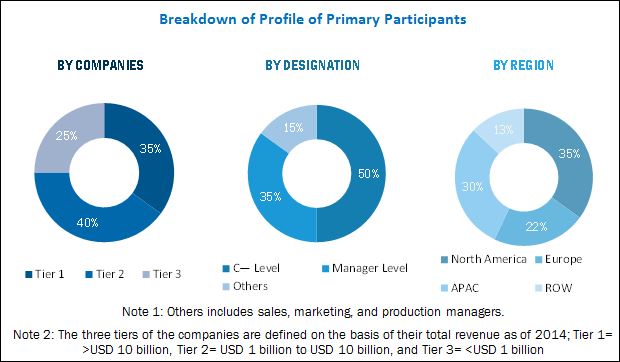
To know about the assumptions considered for the study, download the pdf brochure
High Demand Of Passive Components and Interconnects in 3C Applications to Drive the Global Passive and Interconnect Market
The growing number of computing, communications, and consumer electronics (3C) applications drive the passive and interconnect market. Passive components are the building blocks in all kinds of electronic devices and appliances. These components are the part of electronic circuitry and have been the major backbone of industries such as computing, communications, and consumer electronics. Passive components can resist, interrupt, or influence a current flow and enhance or supplement the performance of integrated circuits (ICs). Interconnects are used to connect a variety of active and passive components in an electronic assembly that controls a system. Connectors are one of the most widely used interconnect types across telecommunication and consumer electronics applications. According to the Electronics Web, personal computers have been a driving factor for the growth of the connector industry in the US. Currently, there is a huge demand for high-speed and high-bandwidth networks; hence, compatible connectors are introduced. Connectors provide a detachable link to electronics devices, various circuit boards, peripherals, and among others.
In the telecommunications industry, advancements in the technologies such as transition from 3G to Voice over Long-Term Evolution (LTE/4G) and 5G are expected to boost the adoption of passive components and interconnects in the coming years. Applications of telecommunication include mobile phones, landline phones, set-top boxes, remote controls, base stations, and network equipment. Globally, passive components and interconnects are increasingly used in the telecommunications sector, owing to significant growth in the mobile handset market because of innovations in the smartphones. Thus, the increasing demand for passive components and interconnects from computing, communication, and consumer electronics applications is driving the global Interconnects and Passive Components Market.
Declining Profit Margins of Manufacturers is one of the Main Restraints of the Market
Advances in device technology are lowering hardware costs, the increase in cost is due to the constant demand for more sophisticated and diversified types of products. The counterfeiting of products is directly impacting the prices of passive components and interconnects. Furthermore, the aggressive competition among players from various regions results in the decline in prices of passive components and interconnects. This adversely affects the cost of new product development or advanced technology-driven products.
Following are the key reasons for the falling profit margins:
- Aggressive competition
- Severe price erosion
- Changing end-use markets
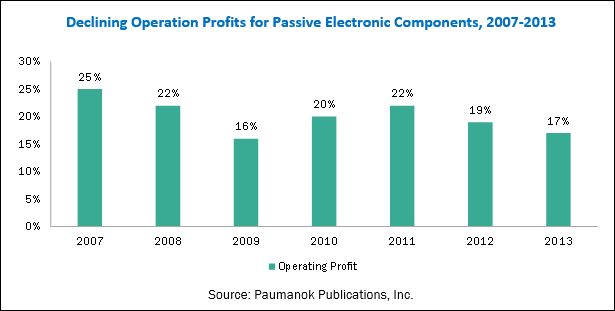
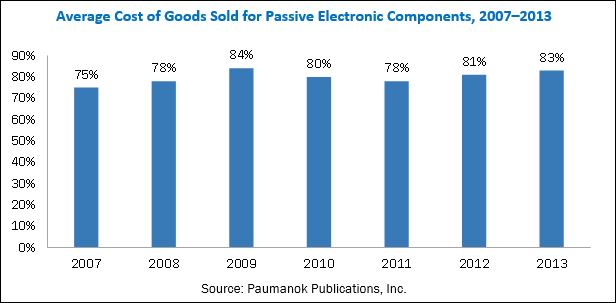
The above figures depict that the cost of goods sold (COGS) as a percentage of the overall industry revenue is increasing at the expense of corresponding profit margins. The production cost of passive electronic components is increasing because of aggressive competition, accelerated price erosion, and changing end-use market segments.
Market Ecosystem
The Interconnects and Passive Components Market ecosystem includes component suppliers such as TE Connectivity Ltd. (Switzerland), Amphenol Corporation (US), Molex Incorporated (US), Hirose Electric Co., Ltd. (Japan) and Delphi Automotive LLP (UK), TT Electronics Plc. (UK), Cisco Systems, Inc. (US), AVX Corporation (US), Japan Aviation Electronics Industry, Ltd. (Japan), JST Mfg. Co., Ltd. (Japan), Hon Hai Precision Industry Co., Ltd., (Foxconn) (Taiwan), Burndy LLC (US), AMETEK, Inc. (US), Yazaki Corporation (Japan), and Panasonic Corporation (Japan).
Get online access to the report on the World's First Market Intelligence Cloud
- Easy to Download Historical Data & Forecast Numbers
- Company Analysis Dashboard for high growth potential opportunities
- Research Analyst Access for customization & queries
- Competitor Analysis with Interactive dashboard
- Latest News, Updates & Trend analysis
Request Sample Scope of the Report
:
Get online access to the report on the World's First Market Intelligence Cloud
- Easy to Download Historical Data & Forecast Numbers
- Company Analysis Dashboard for high growth potential opportunities
- Research Analyst Access for customization & queries
- Competitor Analysis with Interactive dashboard
- Latest News, Updates & Trend analysis

|
Report Metric |
Details |
|
Report Name |
Interconnects and Passive Components Market |
|
Base year |
2016 |
|
Forecast period |
2017�2022 |
|
Units |
Value (USD) |
|
Segments covered |
Type, End User, Offerings, and Region |
|
Geographic regions covered |
North America, APAC, Europe, and RoW |
|
Companies covered |
TE Connectivity Ltd. (Switzerland), Amphenol Corporation (US), Molex Incorporated (US), Hirose Electric Co., Ltd. (Japan) and Delphi Automotive LLP (UK), TT Electronics Plc. (UK), Cisco Systems, Inc. (US), AVX Corporation (US), Japan Aviation Electronics Industry, Ltd. (Japan), JST Mfg. Co., Ltd. (Japan), Hon Hai Precision Industry Co., Ltd., (Foxconn) (Taiwan), Burndy LLC (US), AMETEK, Inc. (US), Yazaki Corporation (Japan), and Panasonic Corporation (Japan) |
Target Audience:
- Technology providers
- Research organizations
- Government organizations
- Technology investors
- Technology standards organizations
- Forums, alliances, and associations, and government bodies
- Venture capitalists
- Private equity firms, analysts and strategic business planners, and others.
Market covered under this report:
This research report categorizes the overall passive and interconnects market on the basis of product type, passive component type, interconnect type, application, and region.
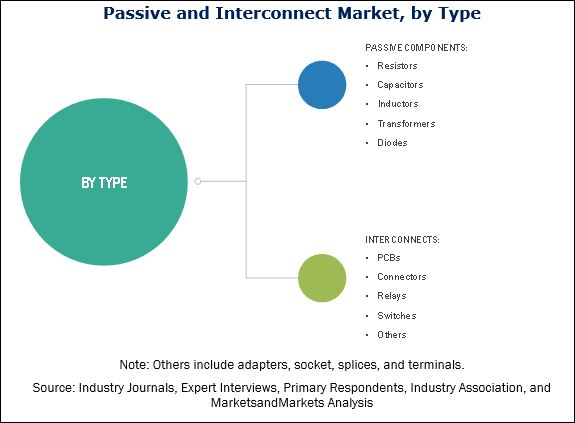
Passive and Interconnect Market, By Product Type
- Passive Components
- Resistors
- Inductors
- Capacitors
- Transformers
- Diodes
- Interconnects
- Printed Circuit Boards
- Connectors
- Switches
- Relays
- Others (Sockets, Terminals, Splices and Adapters)
Passive and Interconnect Market, By Application
- Consumer Electronics
- Data Processing
- Telecommunication
- Military & Aerospace
- Automotive
- Industrial
- Healthcare
Passive and Interconnect Market, By Region
- Americas
- North America
- US
- Canada
- Latin America
- Brazil
- Rest of Latin America
- North America
- Europe
- Germany
- France
- Italy
- UK
- Rest of Europe
- APAC
- China
- Japan
- India
- Taiwan
- South Korea
- Rest of APAC
- RoW
- Middle East
- Africa
Available Customizations:
With the given market data, MarketsandMarkets offers customizations according to the clients� specific needs. The following customization options are available for the report:
Regional Analysis
Further breakdown of region-/country-specific analysis
Company Information
Detailed analysis and profiling of additional market players (up to five)
According to the MarketsandMarkets forecast, the passive and interconnects market is expected to be valued at USD 187.55 billion by 2022, growing at a CAGR of 4.41% between 2017 and 2022. The growth of passive and interconnects market is attributed to advancements in industrial M2M communication technology and rising industrial automations, increasing demand for miniaturized and high-performance electronic devices, proliferation of automotive infotainment and consumer electronics, and high demand for passive component and interconnects in computing, communication and consumer electronics (3C) applications.. However, declining profit margins of the manufacturers and overall drop in the commodity prices are restraining factors for the market growth.
Of all the major applications, the automotive sector is expected to exhibit highest growth in the overall passive and interconnect market during the forecast period. The growth of the automotive segment is mainly propelled by the introduction of infotainment and internet of things technology in automobiles which helps to add an extra comfort and convert traditional automobiles to smart automobiles.
The passive and interconnects market by product type comprises passive components and interconnects. Interconnects is expected to show higher growth between 2016 and 2022, due to increasing adoption of automation, robotics and infotainment in different industry sectors. Interconnects comprises of products which are used in almost every electronic and electrical device either to establish a connection or to transfer the data.
Passive Components
Passive components can interrupt, resist, or affect a current flow but cannot control it. Few examples of passive components are resistors, inductors, capacitors, and transformers. These components are responsible for the flow of current in the electric circuit to help the circuit to operate efficiently.
Resistors (R) are one of the most frequently used passive components, which carry a certain value of resistance that helps in the obstruction of electric current passing through the circuit. These components are used to limit current, divide voltages, and adjust signal levels. Inductors (L) are two terminal devices that store energy in the form of magnetic field when electrical current is flowing through them. The third passive component is the capacitor (C) that stores energy in the form of electric charge producing a static potential difference across the plates. Transformer is a static device that transforms electric energy from one circuit to another without any electrical connection and with the help of mutual induction between the two windings. Diode is a two terminal device named as anode and cathode, which helps the current to flow in one direction and limits the flow of current in the opposite direction.
Interconnects
Interconnect is an electrical or optical connection that connects two or more devices together. Few examples of interconnects are printed circuit boards (PCBs), connectors, switches, and relays. These components are responsible for the flow of current between two electric circuits and conductors. PCB electrically connects the electronic components using conductive tracks, pads and other features etched from the copper sheets onto a non-conductive substrate. The connector connects two conductors so that electric energy can flow between the two conductors. Switch is used to make or break an electric connection. Relay is another classification of interconnect which is also called as electrically operated switch. Connectors are the fastest growing product segment due to their use in various applications to establish a mechanical as well as electrical connectivity. The major share of connectors is captured by data processing application due to the fact that large amount of connectors and adapters are being utilized in personal computers and for networking purposes.
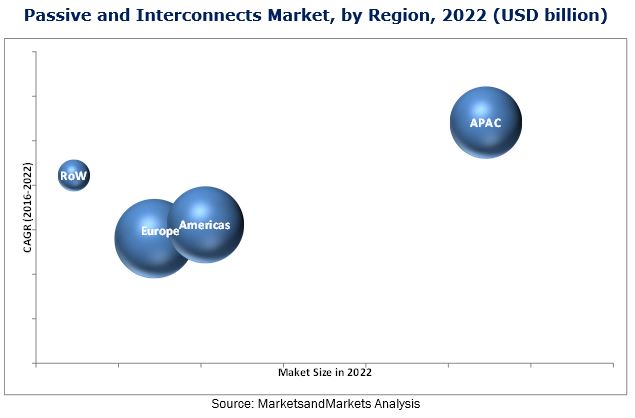
Of all the regions, APAC held the largest market share in 2016 and expected to grow at the highest CAGR between 2017 and 2022. The growth in APAC is primarily due to the easy availability of raw material, cheap labor and low production-cost in this region. Adoption of robotics across industries and advances in capacitors will be significant in creating demand in the coming years.
The major players in the passive and interconnects market are TE Connectivity Ltd. (Switzerland), Amphenol Corporation (US), Molex Incorporated (US), Hirose Electric Co., Ltd. (Japan) and Delphi Automotive LLP (UK). These players have adopted various strategies such as new product developments, partnerships and contracts, and business expansions to cater to the needs of the passive and interconnects market.
To speak to our analyst for a discussion on the above findings, click Speak to Analyst
Table of Contents
1 Introduction (Page No. - 16)
1.1 Objectives of the Study
1.2 Market Definition
1.3 Scope of the Study
1.3.1 Markets Covered
1.3.2 Years Considered for the Study
1.4 Currency
1.5 Package Size
1.6 Limitations
1.7 Stakeholders
2 Research Methodology (Page No. - 19)
2.1 Research Data
2.1.1 Secondary Data
2.1.1.1 Key Data From Secondary Sources
2.1.2 Primary Data
2.1.2.1 Key Data From Primary Sources
2.1.2.2 Key Industry Insights
2.1.2.3 Breakdown of Primaries
2.2 Market Size Estimation
2.3 Market Breakdown & Data Triangulation
2.4 Research Assumptions
3 Executive Summary (Page No. - 27)
4 Premium Insights (Page No. - 31)
4.1 Attractive Opportunities for the Passive and Interconnect Market
4.2 Interconnects and Passive Components Market , By Product Type
4.3 Market , By Passive Component
4.4 Interconnects and Passive Components Market, By Interconnects
4.5 Market, By Application
5 Market Overview (Page No. - 35)
5.1 Market Segmentation
5.2 Market Dynamics
5.2.1 Drivers
5.2.1.1 High Demand for Passive Components and Interconnects in 3c Applications
5.2.1.2 Proliferation of Automotive Infotainment and Consumer Electronics
5.2.1.3 Government Support for HCIT Solutions
5.2.1.4 Increasing Demand for Miniaturized and High-Performance Electronic Devices
5.2.1.5 Advancements in Industrial M2m Communication Technology and Rising Industrial Automation
5.2.2 Restraints
5.2.2.1 Overall Drop in Global Commodity Prices
5.2.2.2 Declining Profit Margins of Manufacturers
5.2.3 Opportunities
5.2.3.1 Rising Adoption of Robots Across Industries
5.2.3.2 Opportunities for High-Temperature Capacitors and Chip-Level Optical Interconnects
5.2.4 Challenges
5.2.4.1 Standardization of Products
5.2.4.2 Maintaining the Temperature and Resistance of Components
6 Industry Trends (Page No. - 45)
6.1 Introduction
6.2 Value Chain Analysis
6.2.1 Research and Development
6.2.2 Manufacturing
6.2.3 Assembly
6.2.4 Marketing and Sales
6.2.5 End Users
6.3 Porter�s Five Forces
6.3.1 Bargaining Power of Suppliers
6.3.2 Bargaining Power of Buyers
6.3.3 Threat of Substitutes
6.3.4 Threat of New Entrants
6.3.5 Intensity of Competitive Rivalry
6.4 Key Trends
7 Passive and Interconnect Market, By Type (Page No. - 52)
7.1 Introduction
7.2 Passive Components
7.3 Interconnects
7.4 Types of Passive Components
7.4.1 Resistors
7.4.2 Inductors
7.4.3 Capacitors
7.4.4 Transformers
7.4.5 Diodes
7.5 Types of Interconnects
7.5.1 Printed Circuit Boards
7.5.2 Connectors
7.5.3 Switches
7.5.4 Relays
7.5.5 Others
8 Passive and Interconnect Market, By Application (Page No. - 71)
8.1 Introduction
8.2 Consumer Electronics
8.3 Data Processing
8.4 Telecommunication
8.5 Military and Aerospace
8.6 Automotive
8.7 Industrial
8.8 Healthcare
9 Passive and Interconnect Market, By Region (Page No. - 80)
9.1 Introduction
9.2 Americas
9.2.1 North America
9.2.1.1 U.S.
9.2.1.2 Canada
9.2.2 Latin America
9.2.2.1 Brazil
9.2.2.2 Rest of Latin America
9.3 Europe
9.3.1 Germany
9.3.2 France
9.3.3 Italy
9.3.4 U.K.
9.3.5 Rest of Europe
9.4 APAC
9.4.1 China
9.4.2 Japan
9.4.3 India
9.4.4 Taiwan
9.4.5 South Korea
9.4.6 Rest of APAC
9.5 RoW
9.5.1 Middle East
9.5.2 Africa
10 Competitive Landscape (Page No. - 108)
10.1 Introduction
10.2 Ranking of Market Players, 2016
10.3 Competitive Scenario and Trends
10.3.1 New Product Launches
10.3.2 Agreements, Partnerships, and Business Expansions
10.3.3 Mergers & Acquisitions
11 Company Profiles (Page No. - 115)
11.1 Introduction
(Business Overview, Products & Services, Key Insights, Recent Developments, SWOT Analysis, Ratio Analysis, MnM View)*
11.2 TE Connectivity Ltd.
11.3 Amphenol Corporation
11.4 Molex Incorporated
11.5 Hirose Electric Co., Ltd
11.6 Delphi Automotive LLP
11.7 TT Electronics PLC
11.8 Japan Aviation Electronics Industry, Ltd.
11.9 AVX Corporation
11.10 Cisco Systems, Inc.
11.11 Yazaki Corporation
11.12 Panasonic Corporation
11.13 Ametek, Inc.
11.14 Hubbell Incorporated (Burndy LLC)
11.15 Hon Hai Precision Industry Co., Ltd.
11.16 JST MFG. Co., Ltd.
11.17 Key Innovators
11.17.1 Chogori Technology Co., Ltd
11.17.2 Suzhou Zeeteq Electronics Co., Ltd
11.17.3 Toyo Connectors
11.17.4 Ipdia
11.17.5 HVP Global, LLC
*Details on Business Overview, Products & Services, Key Insights, Recent Developments, SWOT Analysis, MnM View Might Not Be Captured in Case of Unlisted Companies.
12 Appendix (Page No. - 152)
12.1 Insights of Industry Experts
12.2 Discussion Guide
12.3 Knowledge Store: Marketsandmarkets� Subscription Portal
12.4 Introducing RT: Real-Time Market Intelligence
12.5 Available Customizations
12.6 Related Reports
12.7 Author Details
List of Tables (74 Tables)
Table 1 Passive and Interconnects Market, By Type
Table 2 Market for Passive Components, By Type
Table 3 Market for Interconnects, By Type
Table 4 Passive and Interconnects Market, By Application
Table 5 Porter�s Five Force Analysis: Threat of New Entrant Expected to Have A Medium Impact on the Passive and Interconnect Market
Table 6 Key Trends in Passive and Interconnect Market
Table 7 Passive and Interconnect Market, By Type, 2014�2022 (USD Billion)
Table 8 Interconnects and Passive Components Market, By Type, 2014-2022 (Billion Units)
Table 9 Passive and Interconnect Market, By Passive Components, 2014�2022 (USD Billion)
Table 10 Passive Components Market, By Region, 2014�2022 (USD Billion)
Table 11 Passive and Interconnect Market, By Interconnects, 2014�2022 (USD Billion)
Table 12 Interconnects Market, By Region, 2014�2022 (USD Billion)
Table 13 Interconnects and Passive Components Market for Resistors, By Region, 2014�2022 (USD Billion)
Table 14 Passive and Interconnect Market for Inductors, By Region, 2014�2022 (USD Billion)
Table 15 Passive and Interconnect Market for Capacitors, By Region, 2014�2022 (USD Billion)
Table 16 Interconnects and Passive Components Market for Transformers, By Region, 2014�2022 (USD Billion)
Table 17 Interconnects and Passive Components Market for Diodes, By Region, 2014�2022 (USD Billion)
Table 18 Passive and Interconnect Market for Pcbs, By Region, 2014�2022 (USD Billion)
Table 19 Passive and Interconnect Market for Connectors, By Region, 2014�2022 (USD Billion)
Table 20 Interconnects and Passive Components Market for Switches, By Region, 2014�2022 (USD Billion)
Table 21 Passive and Interconnect Market for Relays, By Region, 2014�2022 (USD Billion)
Table 22 Interconnects and Passive Components Market for Others, By Region, 2014�2022 (USD Billion)
Table 23 Interconnects and Passive Components Market, By Application, 2014�2022 (USD Billion)
Table 24 Passive and Interconnect Market for Consumer Electronics, By Region, 2014�2022 (USD Billion)
Table 25 Passive and Interconnect Market for Data Processing, By Region, 2014�2022 (USD Billion)
Table 26 Passive and Interconnect Market for Telecommunications, By Region, 2014�2022 (USD Billion)
Table 27 Passive and Interconnect Market for Military and Aerospace Application, By Region, 2014�2022 (USD Billion)
Table 28 Interconnects and Passive Components Market for Automotive Application, By Region, 2014�2022 (USD Billion)
Table 29 Passive and Interconnect Market for Industrial Applications, By Region, 2014�2022 (USD Billion)
Table 30 Interconnects and Passive Components Market for Healthcare Application, By Region, 2014�2022 (USD Billion)
Table 31 Passive and Interconnect Market, By Region, 2014�2022 (USD Billion)
Table 32 Passive and Interconnect Market in Americas, By Type, 2014�2022 (USD Billion)
Table 33 Interconnects and Passive Components Market in Americas, By Passive Component, 2014�2022 (USD Billion)
Table 34 Passive and Interconnect Market in Americas, By Interconnect, 2014�2022 (USD Billion)
Table 35 Passive and Interconnect Market in Americas, By Application, 2014�2022 (USD Billion)
Table 36 Interconnects and Passive Components Market in Americas, By Region, 2014�2022 (USD Billion)
Table 37 Passive and Interconnect Market in North America, By Country, 2014�2022 (USD Billion)
Table 38 Passive and Interconnect Market in Latin America, By Country, 2014�2022 (USD Billion)
Table 39 Interconnects and Passive Components Market in U.S., By Type, 2014�2022 (USD Billion)
Table 40 Passive and Interconnect Market in Canada, By Type, 2014�2022 (USD Billion)
Table 41 Passive and Interconnect Market in Brazil, By Type, 2014�2022 (USD Billion)
Table 42 Passive and Interconnect Market in Latin America, By Type, 2014�2022 (USD Billion)
Table 43 Interconnects and Passive Components Market in Europe, By Type, 2014�2022 (USD Billion)
Table 44 Passive and Interconnect Market in Europe, By Passive Component, 2014�2022 (USD Billion)
Table 45 Passive and Interconnect Market in Europe, By Interconnect, 2014�2022 (USD Billion)
Table 46 Passive and Interconnect Market in Europe, By Application, 2014�2022 (USD Billion)
Table 47 Interconnects and Passive Components Market in Europe, By Country, 2014�2022 (USD Billion)
Table 48 Market in Germany, By Type, 2014�2022 (USD Billion)
Table 49 Market in France, By Type, 2014�2022 (USD Billion)
Table 50 Market in Italy, By Type, 2014�2022 (USD Billion)
Table 51 Interconnects and Passive Components Market in U.K., By Type, 2014�2022 (USD Billion)
Table 52 Interconnects and Passive Components Market in Rest of Europe, By Type, 2014�2022 (USD Billion)
Table 53 Market in APAC, By Type, 2014�2022 (USD Billion)
Table 54 Passive and Interconnect Market in APAC, By Passive Component, 2014�2022 (USD Billion)
Table 55 Passive and Interconnect Market in APAC, By Interconnect, 2014�2022 (USD Billion)
Table 56 Passive and Interconnect Market in APAC, By Application, 2014�2022 (USD Billion)
Table 57 Passive and Interconnect Market in APAC, By Region, 2014�2022 (USD Billion)
Table 58 Passive and Interconnect Market in China, By Type, 2014�2022 (USD Billion)
Table 59 Passive and Interconnect Market in Japan, By Type, 2014�2022 (USD Billion)
Table 60 Passive and Interconnect Market in Taiwan, By Type, 2014�2022 (USD Billion)
Table 61 Passive and Interconnect Market in India, By Type, 2014�2022 (USD Billion)
Table 62 Passive and Interconnect Market in South Korea, By Type, 2014�2022 (USD Billion)
Table 63 Passive and Interconnect Market in Rest of APAC, By Type, 2014�2022 (USD Billion)
Table 64 Passive and Interconnect Market in RoW, By Type, 2014�2022 (USD Billion)
Table 65 Passive and Interconnect Market in RoW, By Passive Component, 2014�2022 (USD Billion)
Table 66 Interconnects and Passive Components Market in RoW, By Interconnect, 2014�2022 (USD Billion)
Table 67 Interconnects and Passive Components Market in RoW, By Application, 2014�2022 (USD Billion)
Table 68 Interconnects and Passive Components Market in RoW, By Region, 2014�2022 (USD Billion)
Table 69 Market in Middle East, By Type, 2014�2022 (USD Billion)
Table 70 Passive and Interconnect Market in Africa, By Type, 2014�2022 (USD Billion)
Table 71 Ranking in the Passive and Interconnect Market, 2016
Table 72 New Product Launches in Passive and Interconnect Market, 2016�2017
Table 73 Alliances and Business Expansions in the Passive and Interconnect Market, 2015�2016
Table 74 Mergers & Acquisitions in the Passive and Interconnect Market, 2016
List of Figures (73 Figures)
Figure 1 Interconnects and Passive Components Market Segmentation
Figure 2 Market : Research Design
Figure 3 Market Size Estimation Methodology: Bottom-Up Approach
Figure 4 Market Size Estimation Methodology: Top-Down Approach
Figure 5 Data Triangulation Methodology
Figure 6 Interconnects Holds the Largest Share of the Passive and Interconnect Market in 2017
Figure 7 Capacitors Expected to Grow at the Highest Rate During the Forecast Period
Figure 8 Connectors Expected to Hold the Largest Share of the Market During the Forecast Period
Figure 9 Automotive Application Expected to Be the Fastest-Growing Segment in the Passive and Interconnect Market During the Forecast Period
Figure 10 APAC Held the Largest Share of the Passive and Interconnect Market in 2017
Figure 11 Increasing Demand for Passive Components and Interconnects in Infotainment Application to Drive the Growth of the Interconnects and Passive Components Market During the Forecast Period
Figure 12 Market for Interconnects Expected to Grow at the Highest Rate During 2017�2022
Figure 13 Capacitors Expected to Dominate the Interconnects and Passive Components Market During 2017�2022
Figure 14 Market for Connectors to Grow at the Highest Rate During 2017�2022
Figure 15 Data Processing Expected to Lead the Passive and Interconnect Market During the Forecast Period
Figure 16 China Held the Largest Share of the Passive and Interconnect Market in Asia Pacific in 2016
Figure 17 Market Dynamics: Passive and Interconnect Market
Figure 18 Global Connected Car Revenue Forecast From 2015 to 2022
Figure 19 Shipment Forecast of Tablets, Laptops, and Desktop Pcs Worldwide From 2010 to 2015 (In Million Units)
Figure 20 Operating Profits for Passive Electronic Components, 2007�2013
Figure 21 Average Cost of Goods Sold for Passive Electronic Components, 2007�2013
Figure 22 Market: Value Chain Analysis
Figure 23 Market: Porter�s Five Forces Analysis
Figure 24 Porter�s Five Forces: Impact Analysis
Figure 25 Bargaining Power of Suppliers in Market, 2016
Figure 26 Bargaining Power of Buyers in the Market, 2016
Figure 27 Threat of Substitutes in the Market, 2016
Figure 28 Threat of New Entrants in the Passive and Interconnect Market, 2016
Figure 29 Intensity of Competitive Rivalry in the Passive and Interconnect Market, 2016
Figure 30 Passive and Interconnect Market, By Type
Figure 31 Types of Passive Components
Figure 32 Types of Resistors
Figure 33 Types of Inductors
Figure 34 Types of Capacitors
Figure 35 Types of Transformers
Figure 36 Types of Diodes
Figure 37 APAC to Have the Highest Growth Rate for Interconnects During the Forecast Period
Figure 38 Types of Interconnects
Figure 39 Types of Printed Circuit Boards
Figure 40 Types of Connectors
Figure 41 Type of Switches
Figure 42 Interconnects and Passive Components Market , By Application
Figure 43 Market for Automotive Application Estimated to Grow at the Highest Rate During Forecast Period
Figure 44 Interconnects and Passive Components Market, By Region
Figure 45 Geographic Snapshot: APAC to Grow at the Highest CAGR in the Passive and Interconnect Market During the Forecast Period
Figure 46 Americas: Passive and Interconnect Market Snapshot
Figure 47 Interconnects Expected to Hold the Largest Share of the IntMarket in Americas During the Forecast Period
Figure 48 Europe: Interconnects and Passive Components Market Snapshot
Figure 49 Capacitors Expected to Hold the Largest Size of the Market in Europe During the Forecast Period
Figure 50 APAC: Interconnects and Passive Components Market Snapshot
Figure 51 Passive and Interconnect Market in APAC for Data Processing Application Expected to Grow at the Highest Rate During the Forecast Period
Figure 52 Companies Adopted New Product Launches, and Mergers and Acquisitions as the Key Growth Strategies, 2014-2016
Figure 53 Market Evaluation Framework
Figure 54 Battle for Market Share: New Product Launches, Agreements and Partnerships Were the Key Strategies Adopted Between 2015 and 2017
Figure 55 Geographic Revenue Mix of the Major Players in the Passive and Interconnect Market, 2016
Figure 56 TE Connectivity Ltd.: Company Snapshot
Figure 57 TE Connectivity Ltd.: SWOT Analysis
Figure 58 Amphenol Corporation: Company Snapshot
Figure 59 Amphenol Corporation: SWOT Analysis
Figure 60 Molex Incorporated: SWOT Analysis
Figure 61 Hirose Electric Co., Ltd.: Company Snapshot
Figure 62 Hirose Electric Co. Ltd.: SWOT Analysis
Figure 63 Delphi Automotive LLP: Company Snapshot
Figure 64 Delphi Automotive LLP.: SWOT Analysis
Figure 65 TT Electronics PLC: Company Snapshot
Figure 66 Japan Aviation Electronics Industry, Ltd.: Company Snapshot
Figure 67 AVX Corporation: Company Snapshot
Figure 68 Cisco Systems, Inc.: Company Snapshot
Figure 69 Yazaki Corporation: Company Snapshot
Figure 70 Panasonic Corporation: Company Snapshot
Figure 71 Ametek, Inc.: Company Snapshot
Figure 72 Hubbell Incorporated: Company Snapshot
Figure 73 Hon HAI Precision Industry Co., Ltd.: Company Snapshot


Growth opportunities and latent adjacency in Interconnects and Passive Components Market
Looking for market research information for Passive Components (Capacitors, Resistors, and Inductors). Primary focus/information needed is current and future component trends, existing and future manufacturing capacity plans, existing and future lead time trends.