Internet of Things (IoT) in Energy Market by Solution (Asset Management, Data Management and Analytics, SCADA, Energy Management), Service, Platform, Application (Oil and Gas, Smart Grid, Coal Mining), and Region - Global Forecast to 2025


Internet of Things in Energy Market Size
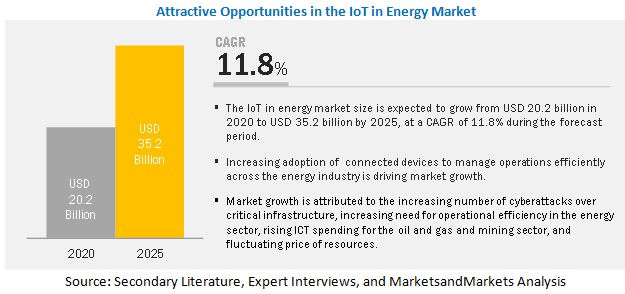
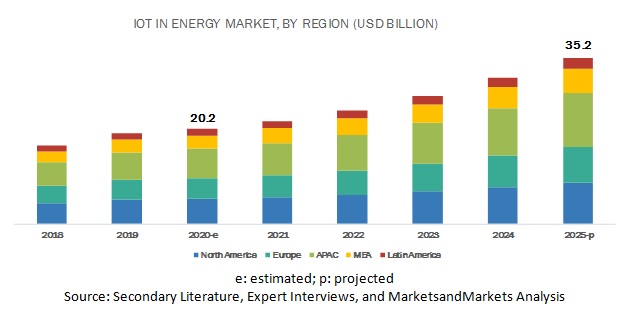
The global Internet of Things in Energy Market size in terms of revenue was estimated to be worth around USD 20.2 billion in 2020 and is anticipated to rise to USD 35.2 billion in 2025,exhibits a CAGR of 11.8% from 2020 to 2025.
Major factors expected to drive the growth of the IoT in energy market include IoT in energy boost business productivity, advantage of IoT-based agile systems, and rising instances of cyberattacks. The advent of IoT in energy is expected to reduce challenges faced by the energy sector and help evolve it. The application of IoT in energy will improve efficiency, generate revenue, and conserve enterprise resources.
MarketsandMarkets helped one of the leaders in the energy industry to identify ~USD 10 million revenue potential by tapping into the Internet of Things (IoT) in energy market across North America and Asia Pacific (APAC).
Client’s Problem Statement
The client, a leading vendor in the IoT in energy ecosystem, was keen to understand the competitive landscape as well as IoT adoption rate in the energy industry across North America and APAC. The client also wanted to increase its market share and reach the geographies mentioned above. Additionally, the client was interested to understand the impact of the COVID-19 pandemic on the energy industry. 
MnM Approach
MarketsandMarkets identified key disruptive technology trends that were changing the revenue mix of the client’s clients in end-use industries such as oil and gas, mining, and smart grid across North America and APAC. MarketsandMarkets also interviewed a host of potential customers in these end-use industries to understand their unmet needs, possible use cases, and benefits from IoT technology and what they looked for in a technology partner.
This helped the client assess the market potential and high impact use cases of IoT technology across these end-use industries. Further, MarketsandMarkets also helped the client build an understanding of the competitive landscape, varying business models, and strategies of different players in the IoT in energy market. This helped the client devise a differentiated product offering and forge suitable alliances to win in this market.
In addition to this, MarketsandMarkets helped the client understand the impact of the COVID-19 pandemic on the market.
Revenue Impact (RI)
MarketsandMarkets’ work resulted in the client tapping into a ~USD 20.2 billion market, with projected revenue of ~USD 10 million in three years.
Based on component, the solutions segment to hold the largest market size during the forecast period
The IoT in energy refers to the deployment of IoT solutions in the power generation industry. These solutions are primarily aimed at achieving the convergence of machines and intelligent data to achieve the operational efficiency targets set by energy companies. IoT solutions in energy sector also improvise analytics-based decision-making by diminishing the threats and vulnerabilities of the market through the use of efficient tools and techniques. Moreover, IoT applications have enabled energy companies to control assets from anywhere to monitor their asset performance. The IoT technology is implemented across the entire energy value, such as energy generation, transmission, distribution, asset management, workforce management, security, energy management, consumer side analysis, infrastructure management, and remote monitoring. This helps to reduce the downtime in providing energy services, provide consumer seamless experience, and increase overall operational efficiency of the energy organization.
Based on service, the integration and deployment segment to hold the largest market size during the forecast period
Integration and deployment services allow experts to integrate IoT devices with IoT solutions and also deploy it into the existing/desired IT infrastructure. These services enhance business agility and process efficiency by closely aligning enterprise IT solutions with business imperatives. The primary reason for organizations to adopt system integration services is their need to improve overall productivity and the quality of their operations. The goal of using these services is to make various IT systems of an organization to communicate with each other through integration to speed up information flow and reduce the operational costs of the organization.
Based on application, the oil and gas segment to hold the largest market size in 2020
The oil and gas application segment is leading the IoT in energy market in 2020; the segment is the most capital-intensive industry. Companies operating in the areas of oil and gas exploration and refining require large capital to meet their day-to-day operational costs. Energy companies are continuously carrying out technological developments and process improvements to sustain in the market. The adoption of IoT solutions is expected to improve the operational efficiency of the oil and gas segment, thus helping companies operating in this industry to sustain the drop in oil prices. IoT solutions can be deployed for remote monitoring of oil rigs and maintaining pipeline integrity. Thus, the IoT solutions help detect potential accidents, thus averting them. IoT-enabled sensors and devices allow remote monitoring of operations and improved end-to-end processes in oil and gas facilities.
Among regions, APAC to hold the largest market size during the forecast period
The increasing adoption of smart grid architecture, technology upgrades, energy management, and regulatory mandates are major contributing factors for the growth of the IoT in energy market in this region. China, the region’s largest economy, is also its biggest importer. China is the region’s largest producer, accounting for half of its oil. Its output of 3.8 million barrels per day was 6% lower than average for nearly a decade. APAC consumes 36% of the world’s oil, a total of 36 million barrels per day. Increasing adoption of smart meter in countries, such as China, Japan, Australia, and South Korea has bolstered the growth of the IoT in energy market in the APAC region.
Key Market Players
Major vendors in the IoT in energy market include IBM (US), Actility (France), ABB (Switzerland), SAP (Germany), Cisco Systems (US), Siemens (Germany), Intel (US), AGT International (Switzerland), Altair Engineering (US), Flutura (US), Davra Networks (US), Wind River (US), Schneider Electric (France), HCL Technologies (India), Aclara (US), Rockwell Automation (US), Bosch (Germany), smartGAS (Germany), Trimble (US), and Infosys (India).
Get online access to the report on the World's First Market Intelligence Cloud
- Easy to Download Historical Data & Forecast Numbers
- Company Analysis Dashboard for high growth potential opportunities
- Research Analyst Access for customization & queries
- Competitor Analysis with Interactive dashboard
- Latest News, Updates & Trend analysis
Request Sample Scope of the Report
:
Get online access to the report on the World's First Market Intelligence Cloud
- Easy to Download Historical Data & Forecast Numbers
- Company Analysis Dashboard for high growth potential opportunities
- Research Analyst Access for customization & queries
- Competitor Analysis with Interactive dashboard
- Latest News, Updates & Trend analysis

|
Report Metrics |
Details |
|
Market size value in 2020 |
USD 20.2 billion |
|
Revenue forecast for 2025 |
USD 35.2 billion |
|
Growth Rate |
11.8% CAGR |
|
Market size available for years |
2018–2025 |
|
Base year considered |
2019 |
|
Forecast period |
2020–2025 |
|
Forecast units |
USD Billion |
|
Segments covered |
Component (solutions, platform, and services), network technology (cellular network, satellite network, radio network, and others), application (oil and gas, coal mining, and smart grid), and region |
|
Geographies covered |
North America, APAC, Europe, MEA, and Latin America |
|
Key Market Drivers |
|
|
Key Market Opportunities |
|
|
Companies covered |
IBM (US), Actility (France), ABB (Switzerland), SAP (Germany), Cisco Systems (US), Siemens (Germany), Intel (US), AGT International (Switzerland), Altair Engineering (US), Flutura (US), Davra Networks (US), Wind River (US), Schneider Electric (France), HCL Technologies (India), Aclara (US), Rockwell Automation (US), Bosch (Germany), smartGAS (Germany), Trimble (US), and Infosys (India) |
The research report categorizes the IoT In energy market based on component (solutions, platform, services), application, network technology, and region.
By Component:
- Platform
- Solutions
- Services
By Solution:
-
Asset Management
- Predictive Maintenance
- Asset Condition Monitoring
-
Safety
- Physical Security
- Cybersecurity
-
Connected Logistics
- Fleet Management
- Freight Management
- Port Management
-
Compliance and Risk Management
- Sustainability Monitoring
- Emission Monitoring and Control
- Data Management and Analytics
- SCADA
- Mobile Workforce Management
- Network Management
- Energy Management
By Service:
- Consulting
- Integration and Deployment
- Support and Maintenance
By Network Technology
- Cellular Network
- Satellite Network
- Radio Network
- Others
By Application:
-
Oil and Gas
- Upstream
- Midstream
- Downstream
-
Coal Mining
- Open-pit Mining
- Underground Mining
-
Smart Grid
- Generation
- Power Transmission and Distribution
- Substation Automation
By region:
-
North America
- US
- Canada
-
Europe
- UK
- Russia
- Norway
- Rest of Europe
-
APAC
- China
- South Korea
- India
- Australia
- Rest of APAC
-
MEA
- KSA
- UAE
- Iran
- Rest of MEA
-
Latin America
- Brazil
- Mexico
- Rest of Latin America
Recent Developments:
- In March 2020, ABB launched an open software platform to accelerate smart energy strategy development.
- In February 2020, Actility and Abeeway partnered with Favendo to address German, Austrian, and Swiss tracking needs.
- In November 2019, IBM launched Maximo Asset Monitor, a new AI-powered monitoring solution.
- In November 2019, Altair Engineering acquired DEM Solutions, makers of EDEM for bulk material simulation, and for expanding solver portfolio into DEM Analysis.
- In May 2019, Actility expanded its presence in Ukraine and in the Kyrgyz Republic.
Key questions addressed by the report:
- Where will all these developments take the industry in the mid to long term?
- What are the upcoming industry solutions in the IoT in energy market?
- Which are the major factors expected to drive the market?
- Which region would offer high growth for vendors in the market?
Frequently Asked Questions (FAQ):
How big is the IoT in Energy Market?
What is the IoT in Energy Market growth?
What is IoT in energy?
Which application of the global IoT in energy market expected to witness the highest growth?
Who are the key players operative in the global market?
To speak to our analyst for a discussion on the above findings, click Speak to Analyst
TABLE OF CONTENTS
1 INTRODUCTION (Page No. - 21)
1.1 OBJECTIVES OF THE STUDY
1.2 MARKET DEFINITION
1.2.1 INCLUSIONS AND EXCLUSIONS
1.3 MARKET SCOPE
1.3.1 MARKET SEGMENTATION
1.3.2 YEARS CONSIDERED FOR THE STUDY
1.4 CURRENCY CONSIDERED
1.5 STAKEHOLDERS
2 RESEARCH METHODOLOGY (Page No. - 25)
2.1 RESEARCH DATA
2.1.1 SECONDARY DATA
2.1.2 PRIMARY DATA
2.1.2.1 Breakup of primary profiles
2.2 MARKET BREAKUP AND DATA TRIANGULATION
2.3 MARKET SIZE ESTIMATION
2.4 MARKET FORECAST
2.5 COMPETITIVE LEADERSHIP MAPPING METHODOLOGY
2.6 ASSUMPTIONS FOR THE STUDY
2.7 LIMITATIONS OF THE STUDY
3 EXECUTIVE SUMMARY (Page No. - 33)
4 PREMIUM INSIGHTS (Page No. - 38)
4.1 ATTRACTIVE MARKET OPPORTUNITIES IN THE MARKET
4.2 GLOBAL IOT IN ENERGY MARKET, BY COMPONENT AND REGION
4.3 IOT IN ENERGY MARKET, BY REGION
4.4 INVESTMENT SCENARIO
5 MARKET OVERVIEW AND INDUSTRY TRENDS (Page No. - 40)
5.1 INTRODUCTION
5.2 MARKET DYNAMICS
5.2.1 DRIVERS
5.2.1.1 IoT in energy boost business productivity
5.2.1.2 Advantage of IoT-based agile systems
5.2.1.3 Increasing the health and safety of employees
5.2.1.4 Rising instances of cyberattacks
5.2.2 RESTRAINTS
5.2.2.1 Lack of data and user privacy
5.2.2.2 Lack of skilled workforce
5.2.3 OPPORTUNITIES
5.2.3.1 Use of IoT and AI in the energy industry
5.2.3.2 Opportunities for system integrators
5.2.4 CHALLENGES
5.2.4.1 IMO 2020 regulation
5.2.4.2 Lack of interoperability standards
5.2.4.3 Impact of the COVID-19 pandemic
5.3 VALUE CHAIN ANALYSIS
5.4 USE CASES
5.4.1 USE CASE 1
5.4.2 USE CASE 2
5.4.3 USE CASE 3
5.5 TECHNOLOGY ANALYSIS
5.5.1 ARTIFICIAL INTELLIGENCE
5.5.2 ROBOTICS AND AUTOMATION
5.5.3 BIG DATA
5.5.4 CLOUD COMPUTING/SOFTWARE AS A SERVICE
6 IMPACT OF COVID-19 ON IOT IN ENERGY MARKET (Page No. - 48)
6.1 INDUSTRY-WISE USE CASES DURING THE COVID-19
6.2 COVID-19 IMPACT ON COMPONENTS
6.2.1 COVID-19 IMPACT ON ADOPTION OF SOLUTIONS
6.2.2 COVID-19 IMPACT ON THE ADOPTION OF PLATFORM
6.2.3 COVID-19 IMPACT ON THE ADOPTION OF SERVICES
6.3 COVID-19 IMPACT ON REGIONS
6.3.1 COVID-19 IMPACT ON NORTH AMERICA
6.3.2 COVID-19 IMPACT ON EUROPE
6.3.3 COVID-19 IMPACT ON ASIA PACIFIC
6.3.4 COVID-19 IMPACT ON MIDDLE EAST AND AFRICA
6.3.5 COVID 19 IMPACT ON LATIN AMERICA
7 IOT IN ENERGY MARKET, BY NETWORK TECHNOLOGY (Page No. - 53)
7.1 INTRODUCTION
7.2 CELLULAR NETWORK
7.3 SATELLITE NETWORK
7.4 RADIO NETWORK
7.5 OTHERS
8 IOT IN ENERGY MARKET, BY COMPONENT (Page No. - 55)
8.1 INTRODUCTION
8.2 SOLUTIONS
8.2.1 SOLUTIONS: MARKET DRIVERS
8.3 PLATFORM
8.3.1 PLATFORM: MARKET DRIVERS
8.4 SERVICES
8.4.1 SERVICES: MARKET DRIVERS
9 IOT IN ENERGY MARKET, BY SOLUTION (Page No. - 61)
9.1 INTRODUCTION
9.2 ASSET MANAGEMENT
9.2.1 ASSET MANAGEMENT: MARKET DRIVERS
9.2.2 PREDICTIVE MAINTENANCE
9.2.3 ASSET CONDITION MONITORING
9.3 SECURITY
9.3.1 SECURITY: MARKET DRIVERS
9.3.2 PHYSICAL SECURITY
9.3.3 CYBERSECURITY
9.4 CONNECTED LOGISTICS
9.4.1 CONNECTED LOGISTICS: MARKET DRIVERS
9.4.2 FLEET MANAGEMENT
9.4.3 FREIGHT MANAGEMENT
9.4.4 PORT MANAGEMENT
9.5 COMPLIANCE AND RISK MANAGEMENT
9.5.1 COMPLIANCE AND RISK MANAGEMENT: IOT IN ENERGY MARKET DRIVERS
9.5.2 SUSTAINABILITY MONITORING
9.5.3 EMISSION MONITORING AND CONTROL
9.6 DATA MANAGEMENT AND ANALYTICS
9.6.1 DATA MANAGEMENT ANALYTICS: MARKET DRIVERS
9.7 SUPERVISORY CONTROL AND DATA ACQUISITION
9.7.1 SUPERVISORY CONTROL AND DATA ACQUISITION: MARKET DRIVERS
9.8 MOBILE WORKFORCE MANAGEMENT
9.8.1 MOBILE WORKFORCE MANAGEMENT: MARKET DRIVERS
9.9 NETWORK MANAGEMENT
9.9.1 NETWORK MANAGEMENT: MARKET DRIVERS
9.10 ENERGY MANAGEMENT
9.10.1 ENERGY MANAGEMENT: MARKET DRIVERS
10 IOT IN ENERGY MARKET, BY SERVICE (Page No. - 81)
10.1 INTRODUCTION
10.2 CONSULTING
10.2.1 CONSULTING: MARKET DRIVERS
10.3 INTEGRATION AND DEPLOYMENT
10.3.1 INTEGRATION AND DEPLOYMENT: MARKET DRIVERS
10.4 SUPPORT AND MAINTENANCE
10.4.1 SUPPORT AND MAINTENANCE: MARKET DRIVERS
11 IOT IN ENERGY MARKET, BY APPLICATION (Page No. - 87)
11.1 INTRODUCTION
11.2 OIL AND GAS
11.2.1 OIL AND GAS: MARKET DRIVERS
11.2.2 UPSTREAM
11.2.3 MIDSTREAM
11.2.4 DOWNSTREAM
11.3 COAL MINING
11.3.1 COAL MINING: MARKET DRIVERS
11.3.2 OPEN-PIT
11.3.3 UNDERGROUND
11.4 SMART GRID
11.4.1 SMART GRID: MARKET DRIVERS
11.4.2 GENERATION
11.4.3 POWER TRANSMISSION AND DISTRIBUTION MONITORING
11.4.4 SUBSTATION AUTOMATION
12 IOT IN ENERGY MARKET, BY REGION (Page No. - 100)
12.1 INTRODUCTION
12.2 NORTH AMERICA
12.2.1 NORTH AMERICA: RULES AND REGULATIONS
12.2.2 NORTH AMERICA: MARKET DRIVERS
12.2.3 NORTH AMERICA: IOT IN ENERGY VENDOR INITIATIVES AND DEVELOPMENTS
12.2.4 UNITED STATES
12.2.5 CANADA
12.3 EUROPE
12.3.1 EUROPE: RULES AND REGULATIONS
12.3.2 EUROPE: IOT IN ENERGY MARKET DRIVERS
12.3.3 EUROPE: IOT IN ENERGY VENDOR INITIATIVES AND DEVELOPMENTS
12.3.4 RUSSIA
12.3.5 UNITED KINGDOM
12.3.6 NORWAY
12.3.7 REST OF EUROPE
12.4 ASIA PACIFIC
12.4.1 ASIA PACIFIC: RULES AND REGULATION
12.4.2 ASIA PACIFIC: IOT IN ENERGY MARKET DRIVERS
12.4.3 ASIA PACIFIC: IOT IN ENERGY VENDOR INITIATIVES AND DEVELOPMENTS
12.4.4 CHINA
12.4.5 AUSTRALIA
12.4.6 INDIA
12.4.7 REST OF ASIA PACIFIC
12.5 MIDDLE EAST AND AFRICA
12.5.1 MIDDLE EAST AND AFRICA: RULES AND REGULATIONS
12.5.2 MIDDLE EAST AND AFRICA: IOT IN ENERGY MARKET DRIVERS
12.5.3 MIDDLE EAST AND AFRICA: IOT IN ENERGY VENDOR INITIATIVES AND DEVELOPMENTS
12.5.4 KINGDOM OF SAUDI ARABIA
12.5.5 UNITED ARAB EMIRATES
12.5.6 IRAN
12.5.7 REST OF MIDDLE EAST AND AFRICA
12.6 LATIN AMERICA
12.6.1 LATIN AMERICA: RULES AND REGULATIONS
12.6.2 LATIN AMERICA: IOT IN ENERGY MARKET DRIVERS
12.6.3 LATIN AMERICA: IOT IN ENERGY VENDOR INITIATIVES AND DEVELOPMENTS
12.6.4 BRAZIL
12.6.5 MEXICO
12.6.6 REST OF LATIN AMERICA
13 COMPETITIVE LANDSCAPE (Page No. - 159)
13.1 INTRODUCTION
13.2 COMPETITIVE LEADERSHIP MAPPING
13.2.1 VISIONARY LEADERS
13.2.2 DYNAMIC DIFFERENTIATORS
13.2.3 INNOVATORS
13.2.4 EMERGING COMPANIES
13.3 STRENGTH OF PRODUCT PORTFOLIO
13.4 BUSINESS STRATEGY EXCELLENCE
13.5 RANKING OF KEY PLAYERS
14 COMPANY PROFILES (Page No. - 165)
14.1 INTRODUCTION
(Business Overview, Solutions & Services, Key Insights, Recent Developments, SWOT Analysis)*
14.2 IBM
14.3 ACTILITY
14.4 ABB
14.5 SAP
14.6 CISCO
14.7 SIEMENS
14.8 INTEL
14.9 AGT INTERNATIONAL
14.10 ALTAIR ENGINEERING
14.11 FLUTURA
14.12 DAVRA NETWORKS
14.13 WIND RIVER
14.14 SCHNEIDER ELECTRIC
14.15 HCL
14.16 ACLARA
14.17 ROCKWELL AUTOMATION
14.18 BOSCH
14.19 SMARTGAS
14.20 TRIMBLE
14.21 INFOSYS
*Details on Business Overview, Solutions & Services, Key Insights, Recent Developments, SWOT Analysis might not be captured in case of unlisted companies.
14.22 RIGHT-TO-WIN
15 APPENDIX (Page No. - 200)
15.1 DISCUSSION GUIDE
15.2 KNOWLEDGE STORE: MARKETSANDMARKETS’ SUBSCRIPTION PORTAL
15.3 AVAILABLE CUSTOMIZATIONS
15.4 RELATED REPORTS
15.5 AUTHOR DETAILS
LIST OF TABLES (166 Tables)
TABLE 1 UNITED STATES DOLLAR EXCHANGE RATE, 2017–2019
TABLE 2 FACTOR ANALYSIS
TABLE 3 USE CASES DURING THE COVID-19 PANDEMIC
TABLE 4 IOT IN ENERGY MARKET SIZE, BY COMPONENT, 2018–2025 (USD MILLION)
TABLE 5 SOLUTIONS: MARKET SIZE, BY REGION, 2018–2025 (USD MILLION)
TABLE 6 PLATFORM: MARKET SIZE, BY REGION, 2018–2025 (USD MILLION)
TABLE 7 SERVICES: MARKET SIZE, BY REGION, 2018–2025 (USD MILLION)
TABLE 8 IOT IN ENERGY MARKET SIZE, BY SOLUTION, 2018–2025 (USD MILLION)
TABLE 9 ASSET MANAGEMENT: MARKET SIZE, BY REGION, 2018–2025 (USD MILLION)
TABLE 10 ASSET MANAGEMENT: MARKET SIZE, BY TYPE, 2018–2025 (USD MILLION)
TABLE 11 PREDICTIVE MAINTENANCE: MARKET SIZE, BY REGION, 2018–2025 (USD MILLION)
TABLE 12 ASSET CONDITION MONITORING: MARKET SIZE, BY REGION, 2018–2025 (USD MILLION)
TABLE 13 SECURITY: MARKET SIZE, BY REGION, 2018–2025 (USD MILLION)
TABLE 14 SECURITY: MARKET SIZE, BY TYPE, 2018–2025 (USD MILLION)
TABLE 15 PHYSICAL SECURITY: MARKET SIZE, BY REGION, 2018–2025 (USD MILLION)
TABLE 16 CYBERSECURITY: MARKET SIZE, BY REGION, 2018–2025 (USD MILLION)
TABLE 17 CONNECTED LOGISTICS: MARKET SIZE, BY REGION, 2018–2025 (USD MILLION)
TABLE 18 CONNECTED LOGISTICS: IOT IN ENERGY MARKET SIZE, BY TYPE, 2018–2025 (USD MILLION)
TABLE 19 FLEET MANAGEMENT: MARKET SIZE, BY REGION, 2018–2025 (USD MILLION)
TABLE 20 FREIGHT MANAGEMENT: MARKET SIZE, BY REGION, 2018–2025 (USD MILLION)
TABLE 21 PORT MANAGEMENT: MARKET SIZE, BY REGION, 2018–2025 (USD MILLION)
TABLE 22 COMPLIANCE AND RISK MANAGEMENT: MARKET SIZE, BY REGION, 2018–2025 (USD MILLION)
TABLE 23 COMPLIANCE AND RISK MANAGEMENT: MARKET SIZE, BY TYPE, 2018–2025 (USD MILLION)
TABLE 24 SUSTAINABILITY MONITORING: MARKET SIZE, BY REGION, 2018–2025 (USD MILLION)
TABLE 25 EMISSION MONITORING AND CONTROL: MARKET SIZE, BY REGION, 2018–2025 (USD MILLION)
TABLE 26 DATA MANAGEMENT AND ANALYTICS: MARKET SIZE, BY REGION, 2018–2025 (USD MILLION)
TABLE 27 SUPERVISORY CONTROL AND DATA ACQUISITION: MARKET SIZE, BY REGION, 2018–2025 (USD MILLION)
TABLE 28 MOBILE WORKFORCE MANAGEMENT: MARKET SIZE, BY REGION, 2018–2025 (USD MILLION)
TABLE 29 NETWORK MANAGEMENT: MARKET SIZE, BY REGION, 2018–2025 (USD MILLION)
TABLE 30 ENERGY MANAGEMENT: MARKET SIZE, BY REGION, 2018–2025 (USD MILLION)
TABLE 31 COMPONENT: MARKET SIZE, BY SERVICE, 2018–2025 (USD MILLION)
TABLE 32 CONSULTING: MARKET SIZE, BY REGION, 2018–2025 (USD MILLION)
TABLE 33 INTEGRATION AND DEVELOPMENT: MARKET SIZE, BY REGION, 2018–2025 (USD MILLION)
TABLE 34 SUPPORT AND MAINTENANCE: MARKET SIZE, BY REGION, 2018–2025 (USD MILLION)
TABLE 35 IOT IN ENERGY MARKET SIZE, BY APPLICATION, 2018–2025 (USD MILLION)
TABLE 36 OIL AND GAS: MARKET SIZE, BY REGION, 2018–2025 (USD MILLION)
TABLE 37 OIL AND GAS: MARKET SIZE, BY TYPE, 2018–2025 (USD MILLION)
TABLE 38 UPSTREAM: MARKET SIZE, BY REGION, 2018–2025 (USD MILLION)
TABLE 39 MIDSTREAM: MARKET SIZE, BY REGION, 2018–2025 (USD MILLION)
TABLE 40 DOWNSTREAM: MARKET SIZE, BY REGION, 2018–2025 (USD MILLION)
TABLE 41 COAL MINING: MARKET SIZE, BY REGION, 2018–2025 (USD MILLION)
TABLE 42 COAL MINING: MARKET SIZE, BY TYPE, 2018–2025 (USD MILLION)
TABLE 43 OPEN-PIT: MARKET SIZE, BY REGION, 2018–2025 (USD MILLION)
TABLE 44 UNDERGROUND: IOT IN ENERGY MARKET SIZE, BY REGION, 2018–2025 (USD MILLION)
TABLE 45 SMART GRID: MARKET SIZE, BY REGION, 2018–2025 (USD MILLION)
TABLE 46 SMART GRID: MARKET SIZE, BY TYPE, 2018–2025 (USD MILLION)
TABLE 47 GENERATION: MARKET SIZE, BY REGION, 2018–2025 (USD MILLION)
TABLE 48 POWER TRANSMISSION AND DISTRIBUTION MONITORING: MARKET SIZE, BY REGION, 2018–2025 (USD MILLION)
TABLE 49 SUBSTATION AUTOMATION: MARKET SIZE, BY REGION, 2018–2025 (USD MILLION)
TABLE 50 IOT IN ENERGY MARKET SIZE, BY REGION, 2018–2025 (USD MILLION)
TABLE 51 NORTH AMERICA: MARKET SIZE, BY COMPONENT, 2018–2025 (USD MILLION)
TABLE 52 NORTH AMERICA: MARKET SIZE, BY SOLUTION, 2018–2025 (USD MILLION)
TABLE 53 NORTH AMERICA: ASSET MANAGEMENT MARKET SIZE, BY TYPE, 2018–2025 (USD MILLION)
TABLE 54 NORTH AMERICA: SECURITY MARKET SIZE, BY TYPE, 2018–2025 (USD MILLION)
TABLE 55 NORTH AMERICA: CONNECTED LOGISTICS MARKET SIZE, BY TYPE, 2018–2025 (USD MILLION)
TABLE 56 NORTH AMERICA: COMPLIANCE AND RISK MANAGEMENT MARKET SIZE, BY TYPE, 2018–2025 (USD MILLION)
TABLE 57 NORTH AMERICA: IOT IN ENERGY MARKET SIZE, BY SERVICE, 2018–2025 (USD MILLION)
TABLE 58 NORTH AMERICA: MARKET SIZE, BY APPLICATION, 2018–2025 (USD MILLION)
TABLE 59 NORTH AMERICA: OIL AND GAS MARKET SIZE, BY TYPE, 2018–2025 (USD MILLION)
TABLE 60 NORTH AMERICA: COAL MINING MARKET SIZE, BY TYPE, 2018–2025 (USD MILLION)
TABLE 61 NORTH AMERICA: SMART GRID MARKET SIZE, BY TYPE, 2018–2025 (USD MILLION)
TABLE 62 NORTH AMERICA: MARKET SIZE, BY COUNTRY, 2018–2025 (USD MILLION)
TABLE 63 UNITED STATES: MARKET SIZE, BY COMPONENT, 2018–2025 (USD MILLION)
TABLE 64 UNITED STATES: MARKET SIZE, BY SOLUTION, 2018–2025 (USD MILLION)
TABLE 65 UNITED STATES: ASSET MANAGEMENT MARKET SIZE, BY TYPE, 2018–2025 (USD MILLION)
TABLE 66 UNITED STATES: SECURITY MARKET SIZE, BY TYPE, 2018–2025 (USD MILLION)
TABLE 67 UNITED STATES: CONNECTED LOGISTICS MARKET SIZE, BY TYPE, 2018–2025 (USD MILLION)
TABLE 68 UNITED STATES: COMPLIANCE AND RISK MANAGEMENT MARKET SIZE, BY TYPE, 2018–2025 (USD MILLION)
TABLE 69 UNITED STATES: IOT IN ENERGY MARKET SIZE, BY SERVICE, 2018–2025 (USD MILLION)
TABLE 70 UNITED STATES: MARKET SIZE, BY APPLICATION, 2018–2025 (USD MILLION)
TABLE 71 UNITED STATES: OIL AND GAS MARKET SIZE, BY TYPE, 2018–2025 (USD MILLION)
TABLE 72 UNITED STATES: COAL MINING MARKET SIZE, BY TYPE, 2018–2025 (USD MILLION)
TABLE 73 UNITED STATES: SMART GRID MARKET SIZE, BY TYPE, 2018–2025 (USD MILLION)
TABLE 74 EUROPE: IOT IN ENERGY MARKET SIZE, BY COMPONENT, 2018–2025 (USD MILLION)
TABLE 75 EUROPE: MARKET SIZE, BY SOLUTION, 2018–2025 (USD MILLION)
TABLE 76 EUROPE: ASSET MANAGEMENT MARKET SIZE, BY TYPE, 2018–2025 (USD MILLION)
TABLE 77 EUROPE: SECURITY MARKET SIZE, BY TYPE, 2018–2025 (USD MILLION)
TABLE 78 EUROPE: CONNECTED LOGISTICS MARKET SIZE, BY TYPE, 2018–2025 (USD MILLION)
TABLE 79 EUROPE: COMPLIANCE AND RISK MANAGEMENT MARKET SIZE, BY TYPE, 2018–2025 (USD MILLION)
TABLE 80 EUROPE: MARKET SIZE, BY SERVICE, 2018–2025 (USD MILLION)
TABLE 81 EUROPE: MARKET SIZE, BY APPLICATION, 2018–2025 (USD MILLION)
TABLE 82 EUROPE: OIL AND GAS MARKET SIZE, BY TYPE, 2018–2025 (USD MILLION)
TABLE 83 EUROPE: COAL MINING MARKET SIZE, BY TYPE, 2018–2025 (USD MILLION)
TABLE 84 EUROPE: SMART GRID MARKET SIZE, BY TYPE, 2018–2025 (USD MILLION)
TABLE 85 EUROPE: MARKET SIZE, BY COUNTRY, 2018–2025 (USD MILLION)
TABLE 86 RUSSIA: IOT IN ENERGY MARKET SIZE, BY COMPONENT, 2018–2025 (USD MILLION)
TABLE 87 RUSSIA: MARKET SIZE, BY SOLUTION, 2018–2025 (USD MILLION)
TABLE 88 RUSSIA: ASSET MANAGEMENT MARKET SIZE, BY TYPE, 2018–2025 (USD MILLION)
TABLE 89 RUSSIA: SECURITY MARKET SIZE, BY TYPE, 2018–2025 (USD MILLION)
TABLE 90 RUSSIA: CONNECTED LOGISTICS MARKET SIZE, BY TYPE, 2018–2025 (USD MILLION)
TABLE 91 RUSSIA: COMPLIANCE AND RISK MANAGEMENT MARKET SIZE, BY TYPE, 2018–2025 (USD MILLION)
TABLE 92 RUSSIA: IOT IN ENERGY MARKET SIZE, BY SERVICE, 2018–2025 (USD MILLION)
TABLE 93 RUSSIA: MARKET SIZE, BY APPLICATION, 2018–2025 (USD MILLION)
TABLE 94 RUSSIA: OIL AND GAS MARKET SIZE, BY TYPE, 2018–2025 (USD MILLION)
TABLE 95 RUSSIA: COAL MINING MARKET SIZE, BY TYPE, 2018–2025 (USD MILLION)
TABLE 96 RUSSIA: SMART GRID MARKET SIZE, BY TYPE, 2018–2025 (USD MILLION)
TABLE 97 ASIA PACIFIC: MARKET SIZE, BY COMPONENT, 2018–2025 (USD MILLION)
TABLE 98 ASIA PACIFIC: MARKET SIZE, BY SOLUTION, 2018–2025 (USD MILLION)
TABLE 99 ASIA PACIFIC: ASSET MANAGEMENT MARKET SIZE, BY TYPE, 2018–2025 (USD MILLION)
TABLE 100 ASIA PACIFIC: SECURITY MARKET SIZE, BY TYPE, 2018–2025 (USD MILLION)
TABLE 101 ASIA PACIFIC: CONNECTED LOGISTICS MARKET SIZE, BY TYPE, 2018–2025 (USD MILLION)
TABLE 102 ASIA PACIFIC: COMPLIANCE AND RISK MANAGEMENT MARKET SIZE, BY TYPE, 2018–2025 (USD MILLION)
TABLE 103 ASIA PACIFIC: MARKET SIZE, BY SERVICE, 2018–2025 (USD MILLION)
TABLE 104 ASIA PACIFIC: MARKET SIZE, BY APPLICATION, 2018–2025 (USD MILLION)
TABLE 105 ASIA PACIFIC: OIL AND GAS MARKET SIZE, BY TYPE, 2018–2025 (USD MILLION)
TABLE 106 ASIA PACIFIC: COAL MINING MARKET SIZE, BY TYPE, 2018–2025 (USD MILLION)
TABLE 107 ASIA PACIFIC: SMART GRID MARKET SIZE, BY TYPE, 2018–2025 (USD MILLION)
TABLE 108 ASIA PACIFIC: IOT IN ENERGY MARKET SIZE, BY COUNTRY, 2018–2025 (USD MILLION)
TABLE 109 CHINA: MARKET SIZE, BY COMPONENT, 2018–2025 (USD MILLION)
TABLE 110 CHINA: MARKET SIZE, BY SOLUTION, 2018–2025 (USD MILLION)
TABLE 111 CHINA: ASSET MANAGEMENT MARKET SIZE, BY TYPE, 2018–2025 (USD MILLION)
TABLE 112 CHINA: SECURITY MARKET SIZE, BY TYPE, 2018–2025 (USD MILLION)
TABLE 113 CHINA: CONNECTED LOGISTICS MARKET SIZE, BY TYPE, 2018–2025 (USD MILLION)
TABLE 114 CHINA: COMPLIANCE AND RISK MANAGEMENT MARKET SIZE, BY TYPE, 2018–2025 (USD MILLION)
TABLE 115 CHINA: MARKET SIZE, BY SERVICE, 2018–2025 (USD MILLION)
TABLE 116 CHINA: MARKET SIZE, BY APPLICATION, 2018–2025 (USD MILLION)
TABLE 117 CHINA: OIL AND GAS MARKET SIZE, BY TYPE, 2018–2025 (USD MILLION)
TABLE 118 CHINA: COAL MINING MARKET SIZE, BY TYPE, 2018–2025 (USD MILLION)
TABLE 119 CHINA: SMART GRID MARKET SIZE, BY TYPE, 2018–2025 (USD MILLION)
TABLE 120 MIDDLE EAST AND AFRICA: IOT IN ENERGY MARKET SIZE, BY COMPONENT, 2018–2025 (USD MILLION)
TABLE 121 MIDDLE EAST AND AFRICA: MARKET SIZE, BY SOLUTION, 2018–2025 (USD MILLION)
TABLE 122 MIDDLE EAST AND AFRICA: ASSET MANAGEMENT MARKET SIZE, BY TYPE, 2018–2025 (USD MILLION)
TABLE 123 MIDDLE EAST AND AFRICA: SECURITY MARKET SIZE, BY TYPE, 2018–2025 (USD MILLION)
TABLE 124 MIDDLE EAST AND AFRICA: CONNECTED LOGISTICS MARKET SIZE, BY TYPE, 2018–2025 (USD MILLION)
TABLE 125 MIDDLE EAST AND AFRICA: COMPLIANCE AND RISK MANAGEMENT MARKET SIZE, BY TYPE, 2018–2025 (USD MILLION)
TABLE 126 MIDDLE EAST AND AFRICA: MARKET SIZE, BY SERVICE, 2018–2025 (USD MILLION)
TABLE 127 MIDDLE EAST AND AFRICA: MARKET SIZE, BY APPLICATION, 2018–2025 (USD MILLION)
TABLE 128 MIDDLE EAST AND AFRICA: OIL AND GAS MARKET SIZE, BY TYPE, 2018–2025 (USD MILLION)
TABLE 129 MIDDLE EAST AND AFRICA: MINING MARKET SIZE, BY TYPE, 2018–2025 (USD MILLION)
TABLE 130 MIDDLE EAST AND AFRICA: SMART GRID MARKET SIZE, BY TYPE, 2018–2025 (USD MILLION)
TABLE 131 MIDDLE EAST AND AFRICA: MARKET SIZE, BY COUNTRY, 2018–2025 (USD MILLION)
TABLE 132 KINGDOM OF SAUDI ARABIA: MARKET SIZE, BY COMPONENT, 2018–2025 (USD MILLION)
TABLE 133 KINGDOM OF SAUDI ARABIA: MARKET SIZE, BY SOLUTION, 2018–2025 (USD MILLION)
TABLE 134 KINGDOM OF SAUDI ARABIA: ASSET MANAGEMENT MARKET SIZE, BY TYPE, 2018–2025 (USD MILLION)
TABLE 135 KINGDOM OF SAUDI ARABIA: SECURITY MARKET SIZE, BY TYPE, 2018–2025 (USD MILLION)
TABLE 136 KINGDOM OF SAUDI ARABIA: CONNECTED LOGISTICS MARKET SIZE, BY TYPE, 2018–2025 (USD MILLION)
TABLE 137 KINGDOM OF SAUDI ARABIA: COMPLIANCE AND RISK MANAGEMENT MARKET SIZE, BY TYPE, 2018–2025 (USD MILLION)
TABLE 138 KINGDOM OF SAUDI ARABIA: IOT IN ENERGY MARKET SIZE, BY SERVICE, 2018–2025 (USD MILLION)
TABLE 139 KINGDOM OF SAUDI ARABIA: MARKET SIZE, BY APPLICATION, 2018–2025 (USD MILLION)
TABLE 140 KINGDOM OF SAUDI ARABIA: OIL AND GAS MARKET SIZE, BY TYPE, 2018–2025 (USD MILLION)
TABLE 141 KINGDOM OF SAUDI ARABIA: COAL MINING MARKET SIZE, BY TYPE, 2018–2025 (USD MILLION)
TABLE 142 KINGDOM OF SAUDI ARABIA: SMART GRID MARKET SIZE, BY TYPE, 2018–2025 (USD MILLION)
TABLE 143 LATIN AMERICA: MARKET SIZE, BY COMPONENT, 2018–2025 (USD MILLION)
TABLE 144 LATIN AMERICA: MARKET SIZE, BY SOLUTION, 2018–2025 (USD MILLION)
TABLE 145 LATIN AMERICA: ASSET MANAGEMENT MARKET SIZE, BY TYPE, 2018–2025 (USD MILLION)
TABLE 146 LATIN AMERICA: SECURITY MARKET SIZE, BY TYPE, 2018–2025 (USD MILLION)
TABLE 147 LATIN AMERICA: CONNECTED LOGISTICS MARKET SIZE, BY TYPE, 2018–2025 (USD MILLION)
TABLE 148 LATIN AMERICA: COMPLIANCE AND RISK MANAGEMENT MARKET SIZE, BY TYPE, 2018–2025 (USD MILLION)
TABLE 149 LATIN AMERICA: MARKET SIZE, BY SERVICE, 2018–2025 (USD MILLION)
TABLE 150 LATIN AMERICA: MARKET SIZE, BY APPLICATION, 2018–2025 (USD MILLION)
TABLE 151 LATIN AMERICA: OIL AND GAS MARKET SIZE, BY TYPE, 2018–2025 (USD MILLION)
TABLE 152 LATIN AMERICA: COAL MINING MARKET SIZE, BY TYPE, 2018–2025 (USD MILLION)
TABLE 153 LATIN AMERICA: SMART GRID MARKET SIZE, BY TYPE, 2018–2025 (USD MILLION)
TABLE 154 LATIN AMERICA: IOT IN ENERGY MARKET SIZE, BY COUNTRY, 2018–2025 (USD MILLION)
TABLE 155 BRAZIL: MARKET SIZE, BY COMPONENT, 2018–2025 (USD MILLION)
TABLE 156 BRAZIL: MARKET SIZE, BY SOLUTION, 2018–2025 (USD MILLION)
TABLE 157 BRAZIL: ASSET MANAGEMENT MARKET SIZE, BY TYPE, 2018–2025 (USD MILLION)
TABLE 158 BRAZIL: SECURITY MARKET SIZE, BY TYPE, 2018–2025 (USD MILLION)
TABLE 159 BRAZIL: CONNECTED LOGISTICS MARKET SIZE, BY TYPE, 2018–2025 (USD MILLION)
TABLE 160 BRAZIL: COMPLIANCE AND RISK MANAGEMENT MARKET SIZE, BY TYPE, 2018–2025 (USD MILLION)
TABLE 161 BRAZIL: MARKET SIZE, BY SERVICE, 2018–2025 (USD MILLION)
TABLE 162 BRAZIL: MARKET SIZE, BY APPLICATION, 2018–2025 (USD MILLION)
TABLE 163 BRAZIL: OIL AND GAS MARKET SIZE, BY TYPE, 2018–2025 (USD MILLION)
TABLE 164 BRAZIL: COAL MINING MARKET SIZE, BY TYPE, 2018–2025 (USD MILLION)
TABLE 165 BRAZIL: SMART GRID MARKET SIZE, BY TYPE, 2018–2025 (USD MILLION)
TABLE 166 EVALUATION CRITERIA
LIST OF FIGURES (38 Figures)
FIGURE 1 IOT IN ENERGY MARKET: RESEARCH DESIGN
FIGURE 2 MARKET SIZE ESTIMATION METHODOLOGY ? APPROACH 1 (SUPPLY SIDE): REVENUE OF COMPONENT OF THE IOT IN ENERGY MARKET
FIGURE 3 MARKET SIZE ESTIMATION METHODOLOGY ? APPROACH 1 BOTTOM-UP (SUPPLY SIDE): COLLECTIVE REVENUE OF ALL OFFERINGS OF THE IOT IN ENERGY
FIGURE 4 MARKET SIZE ESTIMATION METHODOLOGY ? APPROACH 2 TOP-DOWN (DEMAND SIDE): SHARE OF THE MARKET THROUGH VENDOR OFFERINGS
FIGURE 5 COMPETITIVE LEADERSHIP MAPPING: CRITERIA WEIGHTAGE
FIGURE 6 IOT IN ENERGY MARKET TO WITNESS A STEADY GROWTH DURING THE FORECAST PERIOD
FIGURE 7 TOP 3 LEADING SEGMENTS IN THE MARKET IN 2020
FIGURE 8 REGIONAL MARKET SCENARIO
FIGURE 9 TOP 3 SEGMENTS, 2020
FIGURE 10 SOLUTIONS SEGMENT TO HOLD THE HIGHEST MARKET SHARE IN 2020
FIGURE 11 EVOLUTION OF IOT TO DELIVER ENHANCED OPERATIONAL AND BUSINESS EFFICIENCY TO DRIVE THE GLOBAL MARKET
FIGURE 12 SOLUTIONS SEGMENT AND ASIA PACIFIC TO HOLD THE HIGHEST MARKET SHARES IN 2020
FIGURE 13 ASIA PACIFIC TO GROW AT THE HIGHEST CAGR DURING THE FORECAST PERIOD
FIGURE 14 NORTH AMERICA AND ASIA PACIFIC TO EMERGE AS THE BEST MARKETS FOR INVESTMENTS OVER THE NEXT FIVE YEARS
FIGURE 15 DRIVERS, RESTRAINTS, OPPORTUNITIES, AND CHALLENGES
FIGURE 16 VALUE CHAIN ANALYSIS
FIGURE 17 PLATFORM SEGMENT TO GROW AT THE HIGHEST CAGR DURING THE FORECAST PERIOD
FIGURE 18 ASSET MANAGEMENT SEGMENT TO SHARE THE LARGEST MARKET SIZE DURING THE FORECAST PERIOD
FIGURE 19 INTEGRATION AND DEPLOYMENT SEGMENT TO GROW AT THE HIGHEST CAGR DURING THE FORECAST PERIOD
FIGURE 20 SMART GRID SEGMENT TO GROW AT THE HIGHEST CAGR DURING THE FORECAST PERIOD
FIGURE 21 ASIA PACIFIC TO GROW AT THE HIGHEST CAGR DURING THE FORECAST PERIOD
FIGURE 22 NORTH AMERICA: MARKET SNAPSHOT
FIGURE 23 ASIA PACIFIC: IOT IN ENERGY MARKET SNAPSHOT
FIGURE 24 IOT IN ENERGY MARKET (GLOBAL), COMPETITIVE LEADERSHIP MAPPING, 2020
FIGURE 25 PRODUCT PORTFOLIO ANALYSIS OF TOP PLAYERS IN THE IOT IN ENERGY MARKET
FIGURE 26 BUSINESS STRATEGY EXCELLENCE OF TOP PLAYERS IN THE IOT IN ENERGY MARKET
FIGURE 27 RANKING OF KEY PLAYERS IN THE MARKET, 2020
FIGURE 28 IBM: COMPANY SNAPSHOT
FIGURE 29 IBM: SWOT ANALYSIS
FIGURE 30 ABB: COMPANY SNAPSHOT
FIGURE 31 ABB: SWOT ANALYSIS
FIGURE 32 SAP: COMPANY SNAPSHOT
FIGURE 33 SAP: SWOT ANALYSIS
FIGURE 34 CISCO: COMPANY SNAPSHOT
FIGURE 35 CISCO: SWOT ANALYSIS
FIGURE 36 SIEMENS: COMPANY SNAPSHOT
FIGURE 37 INTEL: COMPANY SNAPSHOT
FIGURE 38 ALTAIR: COMPANY SNAPSHOT
The study involved four major steps to estimate the current market size for the Internet of Things (IoT) in energy market. An exhaustive secondary research was done to collect information on the market, the peer market, and the parent market. The next step was to validate these findings, assumptions, and sizing with industry experts across the value chain through primary research. Both top-down and bottom-up approaches were employed to estimate the complete market size. Thereafter, the market breakup and data triangulation methods were used to estimate the market size of segments and subsegments.
Secondary Research
In the secondary research process, various secondary sources have been referred, to identify and collect information for the study. The secondary sources included annual reports, press releases, and investor presentations of companies; white papers, technology journals, and certified publications, such as World Economic Forum, International Association of Oil and Gas Producers (IOGP), Organization of the Petroleum Exporting Countries (OPEC), International Energy Agency (IEA), and World Health Organization (WHO) are referred along with articles from recognized authors, directories, and databases.
Primary Research
The IoT in energy market comprises several stakeholders, such as platform, solution, and service providers; support and maintenance service providers; IoT enterprises; technology consultants; system design and development vendors; and energy service providers. The extensive primary research was conducted to gather information, and verify and validate the critical numbers arrived at. Primary research was further conducted to identify the segmentation types; industry trends; key players; the competitive landscape of different market players; and key market dynamics, such as drivers, restraints, opportunities, challenges, industry trends, and key strategies. Following is the breakup of the primary respondents:
To know about the assumptions considered for the study, download the pdf brochure
Market Size Estimation
Both top-down and bottom-up approaches were used to estimate and validate the overall size of the IoT in energy market. These methods were used extensively to estimate the size of various subsegments in the market. The research methodology used to estimate the market size includes the following:
- Key players in the industry and markets have been identified through extensive secondary research.
- The IoT in energy market expenditure across regions, along with the geographic split in various segments, have been considered to arrive at the overall market size.
- All percentage shares, splits, and breakups have been determined using secondary sources and verified through primary sources.
Data Triangulation
After arriving at the overall market size, using the market size estimation processes as explained above, the market was split into several segments and subsegments. To complete the overall market engineering process and arrive at the exact statistics of each market segment and subsegment, data triangulation and market breakup procedures were employed, wherever applicable. The data was triangulated by studying various factors and trends from both the demand side and supply side in the IoT in energy market.
Report Objectives:
- To determine and forecast the global IoT in energy market by component (solutions, platform, and services), application, network technology, and region from 2020 to 2025 and to analyze the various macroeconomic and microeconomic factors that affect market growth
- To analyze opportunities in the market for stakeholders by identifying high-growth segments of the IoT in energy market
- To forecast the size of the market segments with respect to five major regions: North America, Europe, Asia Pacific (APAC), Middle East and Africa (MEA), and Latin America
- To analyze each submarket with respect to individual growth trends, prospects, and contributions in the overall IoT in energy market
- To provide detailed information about the major factors (drivers, restraints, opportunities, and challenges) influencing the growth of the IoT in energy market
- To profile key market players; generate a comparative analysis based on their business overviews, product offerings, regional presence, business strategies, and key financials; and provide companies in-house statistical tools required to understand the overall competitive landscape
- To track and analyze competitive developments, such as Mergers and Acquisitions (M&A), product developments, partnerships and collaborations, and Research and Development (R&D) activities, in the IoT in energy market
Available Customizations
With the given market data, MarketsandMarkets offers customizations as per the company’s specific needs. The following customization options are available for the report:
Geographic Analysis
- Further breakdown of the Canada market, by component
- Further breakdown of the UK market, by component
- Further breakdown of the India IoT in energy market, by component
- Further breakdown of the UAE market, by component
- Further breakdown of the Mexico market, by component
Company Information
- Detailed analysis and profiling of additional market players (up to 5)


Growth opportunities and latent adjacency in Internet of Things (IoT) in Energy Market