Laminated Labels Market by Composition (Facestock, adhesive, release liner), Printing ink (water-based, solvent-based, holt melt-based, UV curable), Printing technology (Digital, Flexographic, Lithography), Form (Reels, Sheets) - Forecast to 2020


The laminated labels market is projected to reach USD 94.49 Billion by 2020, at a CAGR of 4.57%. On the basis of compositon, facestock accounted for the largest market share among all compositions for laminated labels. Digital prinitng accounted for the largest share in terms of both volume and value. In terms of printing ink, the market is segmented into water-based, solvent-based, UV curable, and hot-melt-based. In 2014, the application segment was dominated by the food & beverage sector followed by consumer durables and pharmaceuticals. Laminated labels in the form of reels accounted for the largest share in terms of both volume and value. The final segment, that is, the region, consists of North America, Europe, Asia-Pacific, and the Rest of the World (RoW). Globally, competition in the laminated label market is growing considerably owing to the improvement in labeling technologies such as 3D printing and thermoforming. Laminated label convertors are keen on developing innovative labeling solutions that can withstand severe weather conditions such as extreme temperature and abrasion. The base year considered for the sudy is 2014 and the market size is forecasted from 2015 to 2020.
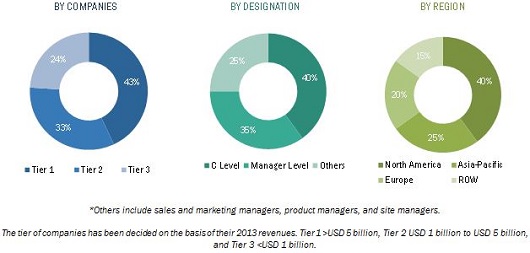
The research methodology used to estimate and forecast the market size included the top-down approach. The total market size of the laminated labels was calculated, and accordingly, the percentage was allotted to different sectors in each of the segments. This allotment and calculation were done on the basis of extensive primary interviews and secondary research. Primary research involved in this report includes extensive interviews with key people such as CEOs, VPs, directors, and executives. After arriving at the overall market size, the total market was split into several segments and subsegments. These data triangulation and market breakdown procedures were employed to complete the overall market engineering process and arrive at the exact statistics for all segments and subsegments. The breakdown of profiles of primary respondents is depicted in the figure below.
To know about the assumptions considered for the study, download the pdf brochure
The laminated label ecosystem comprises companies such as 3M Company (U.S.), Avery Denison Corporation (U.S.), Coveris Holdings S.A. (U.S.), CCL Industries Inc. (Canada), Constantia Flexible Group GMBH (Austria), and RR Donnelley & Sons Company (U.S.). The other players in the market are FLEXcon Company, Inc. (U.S.), Bemis Company, Inc. (U.S.), Stickythings Limited (U.K.), and Torraspapel Adestor (Spain). These provide solutions to end users to cater to their unique business requirements and needs.
Key Players in Laminated Labels Market
The market ecosystem involves various stakeholders in the laminated labels market. This ecosystem involves the various stakeholders involved in the supply chain of the laminated labels industry. It first starts with the raw material suppliers who provide the needed raw materials to the manufacturing companies. This is followed by the research & development team as the consumers want better and innovative solutions to their problems which are much more sustainable and environment friendly. The next level in the chain involves the manufacturing and the assembly team. This is taken care by the manufacturers. Post this, the marketing and sales of the finished products takes place which is only possible if efficient distribution channel is developed. Finally, the end-product lands with the consumers. Thus, this supply chain which involves various stakeholders explains the market ecosystem of the laminated labels industry.
Target audience in Laminated Labels Market
- Manufacturers of laminated labels
- Importers and exporters of laminated labels
- Traders, distributors, and suppliers of laminated labels
- End users
Laminated Labels Market Report Scope
This research report categorizes the laminated label market based on composition, printing technology, form, printing ink, application, and region.
Based on composition, the market has been segmented as follows:
- Facestock
- Adhesive
- Release liner
Based on printing ink, the market has been segmented as follows:
- Water-based ink
- UV-curable based ink
- Solvent-based ink
- Hot-melt-based ink
Based on printing technology, the market has been segmented as follows:
- Digital printintg
- Flexographic printing
- Gavure printing
- Screen printing
- Lithography printing
- Offset printing
- Letterpress printing
Based on form, the market has been segmented as follows:
- Reels
- Sheets
Based on application, the market has been segmented as follows:
- Food & beverage
- Consumer durables
- Home & personal care
- Pharmaceuticals
- Retail labels
- Others (labels used on apparels & textiles, industrial lubricant & paints, and gifts)
Based on region, the market has been segmented as follows:
- North America
- Europe
- Asia-Pacific
- RoW (Brazil, Argentina, South Africa, and others)
Laminated Labels Market Report Available Customizations
With the given market data, MarketsandMarkets offers customizations as per the client-specific needs. The following customization options are available for the report:
Laminated Labels Market Product Analysis
- Product matrix which gives a detailed comparison of the market for different recycled product types
Laminated Labels Market Geographic Analysis
- Further analysis of laminated labels market for additional countries
Laminated Labels Market Company Information
- Detailed analysis and profiling of additional market players (up to 5).
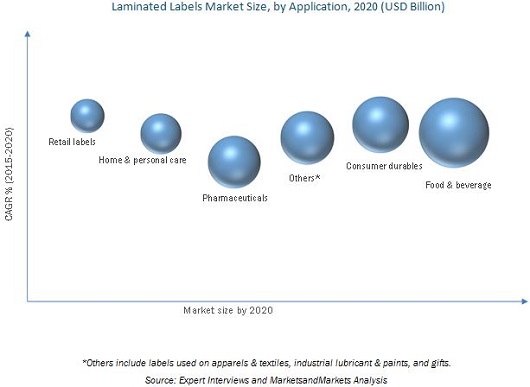
MarketsandMarkets projects that the laminated labels market size by value will grow and reach USD 94.49 Billion by 2020 at a CAGR of 4.57% between 2015 and 2020. The market is growing in accordance with the growth trends of the converting and packaging industries. Factors such as increasing demand from fresh food and beverage packaging industry, demand for pharmaceutical supplies, consumer durables, and logistics application, increasing consumer awareness, and growth of the e-commerce industry have propelled the growth of the global laminated label market. With the increasing demand for convenience and quality food products, people are opting for packaged food products, where the product information and other details such as nutritional information and manufactured & expiry dates are printed.
The laminated labels market is segmented on the basis of composition, printing technology, printing ink, form, application, and region. On the basis of composition, facestock held the largest market share, in terms of both volume and value. Digital printing was the most widely used laminated printing technology among other technologies, in terms of both volume and value. In terms of printing ink, the market is segmented into water-based, solvent-based, UV-curable, and hot-melt-based. On the basis of form, reels held the largest market share, in terms of both volume and value. The UV-curable ink is projected to grow at the highest rate, during the review period. On the basis of application, the market is segmented into food & beverage, consumer durables, home & personal care, pharmaceuticals, retail labels, and others. Increasing disposable incomes of people in developing countries and changing preferences of manufacturers for cost-efficient and effective labeling are some of the factors that are driving the laminated labels market. Certain factors such as printing on the package and the increasing cost of raw materials hinder the growth of this industry.
On the basis of key regions, the market for laminated labels is segmented into North America, Europe, Asia-Pacific, and the Rest of the World (RoW). The Asia-Pacific region held the largest share among all the regions in 2014. This is mainly due to emerging economies in China and India, coupled with growing applications of laminated labels in the food & beverage and consumer durables industry.
Lack of awareness about various types of labeling techniques factors in decreasing the demand for this type of labels. The new technology of printing on the packages itself hinders the demand for laminated labels. Varying environmental mandates in terms of printing on labels across different regions and increasing cost of raw materials are also significant limitations faced by manufacturers in this market.
Key Laminated Labels Market Industry Players
Mergers and aqusitions and new product developmets were the major strategies adopted by most players in this market. Companies such as 3M Company (U.S.), Coveris Holdings S.A. (Luxembourg), CCL Industries Inc. (Canada), Constantia Flexible Group GMBH (Austria), RR Donnelley & Sons Company (U.S.), Avery Dennison Corporation (U.S.), Stickythings Limited (U.K.), Bemis Company, Inc. (U.S.), FLEXcon Company, Inc. (U.S.), and Torraspapel Adestor (Spain) were the key players who adopted these strategies to increase the customer base in key markets. The leading laminated label manufacturers are focusing on emerging countries that are estimated to show potential for industrial development in the near future.
Frequently Asked Questions (FAQ):
What is the Laminated Labels Market growth?
Growth of Laminated Labels Market - At a CAGR of 4.57% from 2015 to 2020.
Who leading market players in Laminated Labels industry?
The major players include 3M company (U.S.), Avery Dennison Corporation (U.S.), Coveris Holdings S.A. (Luxembourg), CCL Industries Inc. (Canada), Constantia Flexible Group GMBH (Austria), and RR Donnelley & Sons Company (U.S.). Companies have adopted mergers & acquisitions to cope with the increasing demand in the emerging Laminated Labels Market.
How big is the Laminated Labels Market?
The Laminated Labels Market is projected to USD 94.49 Billion by 2020.
Which segments are covered in Laminated Labels Market report?
By Composition (Facestock, adhesive, release liner), Printing ink (water-based, solvent-based, holt melt-based, UV curable), Printing technology (Digital, Flexographic, Lithography) & Form (Reels, Sheets).
To speak to our analyst for a discussion on the above findings, click Speak to Analyst
Table of Contents
1 Introduction (Page No. - 25)
1.1 Objectives of the Study
1.2 Market Definition
1.3 Study Scope
1.3.1 Periodization Considered for the Laminated Labels Market
1.4 Currency Considered for the Laminated Label Market
1.5 Unit Considered for the Laminated Labels Market
1.6 Stakeholders
2 Research Methodology (Page No. - 28)
2.1 Research Data
2.1.1 Key Data From Secondary Sources
2.1.2 Primary Data
2.1.2.1 Key Data From Primary Sources
2.1.2.2 Breakdown of Primary Interviews
2.2 Market Size Estimation
2.3 Market Breakdown and Data Triangulation
2.4 Market Share Estimation
2.5 Research Assumptions & Limitations
2.5.1 Assumptions
2.5.2 Assumptions Made for This Study
2.5.3 Limitations
3 Executive Summary (Page No. - 37)
3.1 Laminated Labels Market Size, By Application, 2015 vs 2020 (USD Million)
3.2 Laminated Label Market Size, By Region, 2015 vs 2020 (USD Million)
3.3 China is Projected to Be the Fastest-Growing Market for Laminated Labels From 2015 to 2020
4 Premium Insights (Page No. - 43)
4.1 Attractive Market Opportunities in the Laminated Labels Market
4.2 Laminated Labels Market in the Asia-Pacific Region
4.3 Country-Wise Growth Rates From 2015 to 2020
4.4 Region-Wise Market Share in 2015
4.5 Emerging and Developed Markets for Laminated Labels, 2015 vs 2020
5 Market Overview (Page No. - 49)
5.1 Introduction
5.2 Market Evolution
5.3 Market Segmentation
5.3.1 By Printing Technology
5.3.2 By Printing Ink
5.3.3 By Form
5.3.4 By Composition
5.3.5 By Application
5.4 Market Dynamics
5.4.1 Drivers
5.4.1.1 Demand Side Drivers
5.4.1.1.1 Increasing Demand for Packaged Foods & Beverages
5.4.1.1.2 Growing Demand for Pharmaceutical Supplies
5.4.1.1.3 Growing Consumer Awareness About Information of the Product
5.4.1.1.4 Growing E-Commerce Industry
5.4.1.1.5 Growing Demand for Consumer Durables
5.4.2 Restraints
5.4.2.1 Demand-Side Restraints
5.4.2.1.1 Printing on the Package Itself
5.4.2.2 Supply-Side Restraints
5.4.2.2.1 Increase in Prices of Raw Material
5.4.3 Opportunities
5.4.3.1 Emerging Economies
5.4.3.2 Emergence of New Product Developments
5.4.4 Challenges
5.4.4.1 Cost-To-Benefit Ratio A Concern to Small Manufacturers
5.4.4.2 Increasing Use of Metallized Foils
6 Industry Trends (Page No. - 62)
6.1 Introduction
6.2 Value Chain Analysis
6.3 Porter’s Five Forces Analysis
6.3.1 Threat of New Entrants
6.3.2 Threats of Substitutes
6.3.3 Bargaining Power of Suppliers
6.3.4 Bargaining Power of Buyers
6.3.5 Intensity of Competitive Rivalry
7 Laminated Labels Market, By Composition (Page No. - 67)
7.1 Introduction
7.1.1 Laminated Labels Market, By Composition
7.1.1.1 Facestock Dominated the Laminated Labels Market in 2014
7.2 Facestock
7.3 Adhesive
7.4 Release Liner
7.5 Raw Materials for Laminated Labels
8 Laminated Labels Market, By Printing Ink (Page No. - 73)
8.1 Introduction
8.1.1 Laminated Labels Market, By Printing Ink
8.1.1.1 Water-Based Inks Dominated the Laminated Labels Market in 2014
8.2 Water-Based Ink
8.3 UV-Curable Ink
8.4 Solvent-Based Ink
8.5 Hot Melt-Based Ink
9 Laminated Label Market, By Printing Technology (Page No. - 78)
9.1 Introduction
9.1.1 Laminated Labels Market, By Printing Technology
9.1.1.1 Digital Printing Method Dominated the Laminated Labels Market in 2014
9.2 Digital Printing
9.3 Flexographic Printing
9.4 Gravure Printing
9.5 Lithography Printing
9.6 Offset Printing
9.7 Letterpress Printing
10 Laminated Labels Market, By Form (Page No. - 83)
10.1 Introduction
10.1.1 Laminated Labels in the Form of Reels Account for A Larger Market Share
10.2 Reels
10.3 Sheets
11 Laminated Labels Market, By Application (Page No. - 86)
11.1 Introduction
11.1.1 Laminated Labels Market, By Application
11.1.1.1 The Food & Beverages Segment Dominated the Laminated Labels Market in 2014
11.2 Food & Beverages
11.3 Consumer Durables
11.4 Home & Personal Care
11.5 Pharmaceuticals
11.6 Retail Labels
11.7 Others
12 Laminated Label Market, By Region (Page No. - 91)
12.1 Introduction
12.1.1 Laminated Labels Market Size, By Region
12.1.1.1 Asia-Pacific Dominated the Market for Laminated Labels in 2014
12.2 Asia-Pacific
12.2.1 Asia-Pacific: Laminated Label Market Size, By Country
12.2.1.1 China Dominated the Asia-Pacific Laminated Labels Market in 2014
12.2.1.2 Asia-Pacific: Laminated Labels Market Size, By Composition
12.2.1.2.1 Facestock Accounted for the Largest Market Share in 2014
12.2.1.3 Asia-Pacific: Laminated Label Market Size, By Form
12.2.1.3.1 Reels Accounted for the Largest Market Share in 2014
12.2.1.4 Asia-Pacific: Laminated Labels Market Size, By Printing Ink
12.2.1.4.1 Solvent-Based Ink Segment to Grow at the Highest CAGR From 2015 to 2020
12.2.1.5 Asia-Pacific: Laminated Label Market Size, By Printing Technology
12.2.1.5.1 Digital Printing Segment to Grow at the Highest Rate From 2015 to 2020
12.2.1.6 Asia-Pacific: Laminated Label Market Size, By Application
12.2.1.6.1 Retail Segment to Grow at the Highest Rate From 2015 to 2020
12.2.2 China
12.2.2.1 China: Laminated Labels Market Size, By Composition
12.2.2.1.1 Facestock Accounted for the Largest Market Share in China in 2014
12.2.2.2 China: Laminated Label Market Size, By Form
12.2.2.2.1 Reels Accounted for the Largest Market Share in China in 2014
12.2.2.3 China: Laminated Label Market Size, By Printing Ink
12.2.2.3.1 Water-Based Ink Segment Dominated the Chinese Market in 2014
12.2.2.4 China: Laminated Label Market Size, By Printing Technology
12.2.2.4.1 Digital Printing Segment is Projected to Dominate the Laminated Labels Market in China By 2020
12.2.2.5 China: Laminated Labels Market Size, By Application
12.2.2.5.1 Food & Beverages Segment is Projected to Dominate the Laminated Labels Market in China By 2020
12.2.3 Japan
12.2.3.1 Japan: Laminated Labels Market Size, By Composition
12.2.3.1.1 Facestock Segment to Grow at the Highest CAGR From 2015 to 2020
12.2.3.2 Japan: Laminated Label Market Size, By Form
12.2.3.2.1 Reels Segment is Projected to Grow at A Higher Rate From 2015 to 2020
12.2.3.3 Japan: Laminated Label Market Size, By Printing Ink
12.2.3.3.1 UV-Curable Ink Segment is Projected to Grow at the Highest Rate From 2015 to 2020
12.2.3.4 Japan: Laminated Label Market Size, By Printing Technology
12.2.3.4.1 Digital Printing Segment Was the Largest in 2014
12.2.3.5 Japan: Laminated Labels Market Size, By Application
12.2.3.5.1 Application of Laminated Labels in the Food & Beverage Sector Was the Highest in 2014
12.2.4 India
12.2.4.1 India: Laminated Labels Market Size, By Composition
12.2.4.1.1 Facestock Segment is Projected to Grow at the Highest Rate From 2015 to 2020
12.2.4.2 India: Laminated Label Market Size, By Form
12.2.4.2.1 Sheets Segment is Projected to Grow at A Higher Rate From 2015 to 2020
12.2.4.3 India: Laminated Label Market Size, By Printing Ink
12.2.4.3.1 Water-Based Ink Segment Accounted for the Largest Share in the Indian Laminated Labels Market in 2014
12.2.4.4 India: Laminated Labels Market Size, By Printing Technology
12.2.4.4.1 Digital Printing Segment in India is Projected to Grow at the Highest CAGR
12.2.4.5 India: Laminated Label Market Size, By Application
12.2.4.5.1 Packaging Industry in India is Largely Driven By Growth in Food & Beverage Packaging
12.2.5 Rest of Asia-Pacific
12.2.5.1 Rest of Asia-Pacific: Laminated Labels Market Size, By Composition
12.2.5.1.1 Facestock Held the Largest Share in the Rest of Asia-Pacific Market
12.2.5.2 Rest of Asia-Pacific: Laminated Label Market Size, By Form
12.2.5.2.1 Reels Held the Largest Share in the Rest of Asia-Pacific Market
12.2.5.3 Rest of Asia-Pacific: Laminated Label Market Size, By Printing Ink
12.2.5.3.1 Solvent-Based Ink Was the Second-Largest Segment in 2014
12.2.5.4 Rest of Asia-Pacific: Laminated Label Market Size, By Printing Technology
12.2.5.4.1 Flexographic Printing Was the Second-Largest Printing Technology for Laminated Labels in 2014
12.2.5.5 Rest of Asia-Pacific: Laminated Labels Market Size, By Application
12.2.5.5.1 Consumer Durables Was the Second-Largest Application Segment for Laminated Labels in 2014
12.3 Europe
12.3.1 Europe: Laminated Labels Market Size, By Country
12.3.1.1 Germany Accounted for the Largest Share in the European Laminated Labels Market
12.3.1.2 Europe: Laminated Label Market Size, By Composition
12.3.1.2.1 Facestock Segment to Grow at the Highest CAGR Through 2020
12.3.1.3 Europe: Laminated Label Market Size, By Form
12.3.1.3.1 Reels Segment to Grow at A Higher CAGR Through 2020
12.3.1.4 Europe: Laminated Label Market Size, By Printing Ink
12.3.1.4.1 Water-Based Ink Accounted for the Largest Share in European Laminated Labels Market, in 2014
12.3.1.5 Europe: Laminated Label Market Size, By Printing Technology
12.3.1.5.1 Digital Printing Segment Accounted for the Largest Share in European Laminated Labels Market, in 2014
12.3.1.6 Europe: Laminated Labels Market Size, By Application
12.3.1.6.1 Food & Beverages Segment Dominated the Market in Europe in 2014
12.3.2 Germany
12.3.2.1 Germany: Laminated Label Market Size, By Composition
12.3.2.1.1 Facestock Segment Accounted for the Largest Market Share in 2014
12.3.2.2 Germany: Laminated Label Market Size, By Form
12.3.2.2.1 Reels Segment Accounted for the Largest Market Share in 2014
12.3.2.3 Germany: Laminated Labels Market Size, By Printing Ink
12.3.2.3.1 Water-Based Ink Accounted for the Largest Share in German Laminated Labels Market, in 2014
12.3.2.4 Germany: Laminated Label Market Size, By Printing Technology
12.3.2.4.1 Digital Printing Segment Accounted for the Largest Share in German Laminated Labels Market, in 2014
12.3.2.5 Germany: Laminated Label Market Size, By Application
12.3.2.5.1 Pharmaceuticals Was the Second-Largest Segment in 2014 in Germany
12.3.3 U.K.
12.3.3.1 U.K.: Laminated Labels Market Size, By Composition
12.3.3.1.1 Facestock Segment Accounted for the Largest Market Share in 2014
12.3.3.2 U.K.: Laminated Label Market Size, By Form
12.3.3.2.1 Reels Segment Accounted for the Largest Market Share in 2014
12.3.3.3 U.K.: Laminated Label Market Size, By Printing Ink
12.3.3.3.1 Water-Based Ink Accounted for the Largest Share in U.K. Laminated Labels Market, in 2014
12.3.3.4 U.K.: Laminated Label Market Size, By Printing Technology
12.3.3.4.1 Digital Printing Segment Accounted for the Largest Share in U.K. Laminated Labels Market, in 2014
12.3.3.5 U.K.: Laminated Labels Market Size, By Application
12.3.3.5.1 Food & Beverages Segment Dominated the Market in Europe in 2014
12.3.4 France
12.3.4.1 France: Laminated Label Market Size, By Composition
12.3.4.1.1 Facestock Segment Accounted for the Largest Market Share in 2014
12.3.4.2 France: Laminated Label Market Size, By Form
12.3.4.2.1 Reels Segment Accounted for the Largest Market Share in 2014
12.3.4.3 France: Laminated Labels Market Size, By Printing Ink
12.3.4.3.1 Water-Based Ink Accounted for the Largest Share in French Laminated Labels Market, in 2014
12.3.4.4 France: Laminated Label Market Size, By Printing Technology
12.3.4.4.1 Digital Printing Segment Accounted for the Largest Share in French Laminated Labels Market, in 2014
12.3.4.5 France: Laminated Labels Market Size, By Application
12.3.4.5.1 Food & Beverages Segment Dominated the Market in France in 2014
12.3.5 Rest of Europe
12.3.5.1 Rest of Europe: Laminated Label Market Size, By Composition
12.3.5.1.1 Facestock Segment Accounted for the Largest Market Share in 2014
12.3.5.2 Rest of Europe: Laminated Label Market Size, By Form
12.3.5.2.1 Reels Segment Accounted for the Largest Market Share in 2014
12.3.5.3 Rest of Europe: Laminated Label Market Size, By Printing Ink
12.3.5.3.1 Water-Based Ink Accounted for the Largest Share in the Rest of Europe Laminated Labels Market, in 2014
12.3.5.4 Rest of Europe: Laminated Label Market Size, By Printing Technology
12.3.5.4.1 Digital Printing Segment Accounted for the Largest Share in Rest of Europe’s Laminated Labels Market, in 2014
12.3.5.5 Rest of Europe: Laminated Labels Market Size, By Application
12.3.5.5.1 Food & Beverages Segment Dominated the Market in Rest of Europe in 2014
12.4 North America
12.4.1 North America: Laminated Labels Market Size, By Country
12.4.1.1 U.S. Accounted for Largest Share in North America’s Laminated Labels Market
12.4.1.2 North America: Laminated Label Market Size, By Composition
12.4.1.2.1 Facestock Segment to Grow at the Highest Rate By 2020
12.4.1.3 North America: Laminated Label Market Size, By Form
12.4.1.3.1 Reels Segment to Grow at the Highest Rate By 2020
12.4.1.4 North America: Laminated Label Market Size, By Printing Ink
12.4.1.4.1 Water-Based Ink Segment Accounted for the Largest Share in North American Laminated Labels Market, in 2014
12.4.1.5 North America: Laminated Labels Market Size, By Printing Technology
12.4.1.5.1 Digital Printing Segment Accounted for the Largest Share in the North American Laminated Labels Market, in 2014
12.4.1.6 North America: Laminated Labels Market Size, By Application
12.4.1.6.1 Consumer Durables Segment Was the Second-Largest in North America in 2014
12.4.2 U.S.
12.4.2.1 U.S.: Laminated Labels Market Size, By Composition
12.4.2.1.1 Facestock Segment Accounted for the Largest Market Share in 2014
12.4.2.2 U.S.: Laminated Label Market Size, By Form
12.4.2.2.1 Reels Segment Accounted for the Largest Market Share in 2014
12.4.2.3 U.S.: Laminated Label Market Size, By Printing Ink
12.4.2.3.1 Hot Melt-Based Ink Accounted for the Largest Share in the U.S. Laminated Labels Market, in 2014
12.4.2.4 U.S.: Laminated Label Market Size, By Printing Technology
12.4.2.4.1 Digital Printing Segment Accounted for the Largest Share in U.S. Laminated Labels Market, in 2014
12.4.2.5 U.S.: Laminated Labels Market Size, By Application
12.4.2.5.1 Pharmaceuticals Segment Was the Second-Largest in 2014 in the U.S.
12.4.3 Canada
12.4.3.1 Canada: Laminated Labels Market Size, By Composition
12.4.3.1.1 Facestock Segment Accounted for the Largest Market Share in 2014
12.4.3.2 Canada: Laminated Label Market Size, By Form
12.4.3.2.1 Reels Segment Accounted for the Largest Market Share in 2014
12.4.3.3 Canada: Laminated Labels Market Size, By Printing Ink
12.4.3.3.1 Solvent-Based Ink Segment Accounted for the Largest Share in Canada’s Laminated Labels Market, in 2014
12.4.3.4 Canada: Laminated Label Market Size, By Printing Technology
12.4.3.4.1 Digital Printing Segment Accounted for the Largest Share in Canada’s Laminated Labels Market, in 2014
12.4.3.5 Canada: Laminated Labels Market Size, By Application
12.4.3.5.1 Food & Beverages Segment Dominated the Market in Canada in 2014
12.4.4 Mexico
12.4.4.1 Mexico: Laminated Labels Market Size, By Composition
12.4.4.1.1 Facestock Segment Accounted for the Largest Market Share in Mexico in 2014
12.4.4.2 Mexico: Laminated Label Market Size, By Form
12.4.4.2.1 Reels Segment Accounted for the Largest Market Share in Mexico in 2014
12.4.4.3 Mexico: Laminated Labels Market Size, By Printing Ink
12.4.4.3.1 Solvent-Based Ink Accounted for the Largest Share in Mexico’s Laminated Labels Market, in 2014
12.4.4.4 Mexico: Laminated Label Market Size, By Printing Technology
12.4.4.4.1 Digital Printing Segment Accounted for the Largest Share in Mexico’s Laminated Labels Market, in 2014
12.4.4.5 Mexico: Laminated Labels Market Size, By Application
12.4.4.5.1 Food & Beverages Segment Dominated the Market in Mexico in 2014
12.5 Rest of the World (RoW)
12.5.1 RoW: Laminated Label Market Size, By Country
12.5.1.1 Brazil Dominated the RoW Laminated Labels Market in 2014
12.5.1.2 RoW: Laminated Labels Market Size, By Composition
12.5.1.2.1 Facestock Segment to Grow at the Highest Rate in RoW By 2020
12.5.1.3 RoW: Laminated Label Market Size, By Form
12.5.1.3.1 Reels Segment to Grow at A Higher Rate in RoW By 2020
12.5.1.4 RoW: Laminated Label Market Size, By Printing Ink
12.5.1.4.1 Hot Melt-Based Inks Segment Projected to Grow at the Second-Highest Rate in RoW By 2020
12.5.1.5 RoW: Laminated Label Market Size, By Printing Technology
12.5.1.5.1 Digital Printing Segment Dominated the RoW Market in 2014
12.5.1.6 RoW: Laminated Labels Market Size, By Application
12.5.1.6.1 Food & Beverages Segment Dominated the RoW Market in 2014
12.5.2 Brazil
12.5.2.1 Brazil: Laminated Labels Market Size, By Composition
12.5.2.1.1 Laminated Label Market in Brazil Was Dominated By Facestock Segment in 2014
12.5.2.2 Brazil: Laminated Label Market Size, By Form
12.5.2.2.1 Laminated Label Market in Brazil Was Dominated By the Reels Segment in 2014
12.5.2.3 Brazil: Laminated Labels Market Size, By Printing Ink
12.5.2.3.1 UV-Curable Ink Segment is Projected to Grow at the Highest CAGR in Brazil By 2020
12.5.2.4 Brazil: Laminated Label Market Size, By Printing Technology
12.5.2.4.1 Lithography Printing Segment Dominated the Brazilian Market for Laminated Labels in 2014
12.5.2.5 Brazil: Laminated Labels Market Size, By Application
12.5.2.5.1 Food & Beverages Segment Dominated the Brazilian Market for Laminated Labels in 2014
12.5.3 South Africa
12.5.3.1 South Africa: Laminated Label Market Size, By Composition
12.5.3.1.1 Facestock Segment is Projected to Dominate the Market in South Africa By 2020
12.5.3.2 South Africa: Laminated Label Market Size, By Form
12.5.3.2.1 Reels Segment is Projected to Dominate the Market in South Africa By 2020
12.5.3.3 South Africa: Laminated Labels Market Size, By Printing Ink
12.5.3.3.1 Water-Based Ink Segment Dominated the South African Market in 2014
12.5.3.4 South Africa: Laminated Label Market Size, By Printing Technology
12.5.3.4.1 Flexographic Printing Segment is Expected to Have Potential Growth Opportunities By 2020
12.5.3.5 South Africa: Laminated Labels Market Size, By Application
12.5.3.5.1 Consumer Durables Segment is Expected to Have Potential Growth Opportunities in South Africa By 2020
12.5.4 Argentina
12.5.4.1 Argentina: Laminated Labels Market Size, By Composition
12.5.4.1.1 Facestock Segment is Projected to Dominate the Market in Argentina By 2020
12.5.4.2 Argentina: Laminated Label Market Size, By Form
12.5.4.2.1 Reels Segment is Projected to Dominate the Market in Argentina By 2020
12.5.4.3 Argentina: Laminated Label Market Size, By Printing Ink
12.5.4.3.1 Water-Based Ink Segment Dominated Argentina’s Market in 2014
12.5.4.4 Argentina: Laminated Label Market Size, By Printing Technology
12.5.4.4.1 Flexographic Printing Segment is Expected to Have Potential Growth Opportunities in Argentina By 2020
12.5.4.5 Argentina: Laminated Labels Market Size, By Application
12.5.4.5.1 Consumer Durables Segment is Expected to Have Potential Growth Opportunities in Argentina By 2020
12.5.5 Others in RoW
12.5.5.1 Others in RoW: Laminated Labels Market Size, By Composition
12.5.5.1.1 Facestock Segment is Projected to Grow at the Highest Rate in the Other Countries of RoW By 2020
12.5.5.2 Others in RoW: Laminated Label Market Size, By Form
12.5.5.2.1 Reels Segment is Projected to Grow at A High Rate in the Other Countries of RoW By 2020
12.5.5.3 Others in RoW: Laminated Labels Market Size, By Printing Ink
12.5.5.3.1 Water-Based Ink Segment Accounted for the Largest Market Share in the Other Countries of RoW in 2014
12.5.5.4 Others in RoW: Laminated Label Market Size, By Printing Technology
12.5.5.4.1 Flexographic Printing Segment is Projected to Grow at the Highest CAGR in the Other RoW Countries By 2020
12.5.5.5 Others in RoW: Laminated Label Market Size, By Application
12.5.5.5.1 Retail Labels Segment is Projected to Grow at the Highest CAGR in Other RoW Countries By 2020
13 Competitive Landscape (Page No. - 202)
13.1 Overview
13.2 Development Analysis
13.3 Competitive Situations & Trends
13.4 Key Growth Strategies, 2011–2015
13.4.1 Mergers & Acquisitions
13.4.2 New Product Launches
13.4.3 Agreements, Partnerships, Contracts, and Joint Ventures
13.4.4 Expansions
14 Company Profiles (Page No. - 210)
(Company at A Glance, Recent Financials, Products & Services, Strategies & Insights, & Recent Developments)*
14.1 Introduction
14.2 Avery Dennison Corporation
14.3 CCL Industries Inc.
14.4 3M Company
14.5 Constantia Flexibles Group GmbH
14.6 Coveris Holdings S.A.
14.7 R.R. Donnelley & Sons Company
14.8 Torraspapel Adestor
14.9 Bemis Company, Inc.
14.10 Flexcon Company, Inc.
14.11 Stickythings Limited
*Details on Company at A Glance, Recent Financials, Products & Services, Strategies & Insights, & Recent Developments Might Not Be Captured in Case of Unlisted Companies.
15 Appendix (Page No. - 237)
15.1 Insights of Industry Experts
15.2 Discussion Guide
15.3 Knowledge Store: Marketsandmarkets’ Subscription Portal
15.4 Company Developments
15.4.1 Mergers & Acquisitions
15.4.2 New Product Launches
15.4.3 Agreements, Partnerships, Contracts, and Joint Ventures
15.4.4 Expansions
15.5 Introducing RT: Real-Time Market Intelligence
15.6 Available Customizations
15.7 Related Report
List of Tables (199 Tables)
Table 1 Printing Technology & Description
Table 2 Printing Ink & Description
Table 3 Form & Description
Table 4 Composition & Description
Table 5 Application & Description
Table 6 Laminated Labels Market Size, By Composition, 2013–2020 (USD Million)
Table 7 Laminated Label Market Size, By Printing Ink, 2013–2020 (USD Million)
Table 8 Laminated Labels Market Size, By Printing Ink, 2013–2020 (Million Square Meters)
Table 9 Laminated Label Market Size, By Printing Technology, 2013–2020 (USD Million)
Table 10 Laminated Labels Market Size, By Printing Technology, 2013–2020 (Million Square Meters)
Table 11 Laminated Label Market Size, By Form, 2013–2020 (USD Million)
Table 12 Laminated Labels Market Size, By Form, 2013–2020 (Million Square Meters)
Table 13 Laminated Label Market Size, By Application, 2013–2020 (USD Million)
Table 14 Laminated Labels Market Size, By Application, 2013–2020 (Million Square Meters)
Table 15 Laminated Label Market Size, By Region, 2013–2020 (USD Million)
Table 16 Laminated Labels Market Size, By Region, 2013–2020 (Million Square Meters)
Table 17 Asia-Pacific: Laminated Label Market Size, By Country, 2013–2020 (USD Million)
Table 18 Asia-Pacific: By Market Size, By Country, 2013–2020 (Million Square Meters)
Table 19 Asia-Pacific: By Market Size, By Composition, 2013–2020 (USD Million)
Table 20 Asia-Pacific: By Market Size, By Form, 2013–2020 (USD Million)
Table 21 Asia-Pacific: By Market Size, By Form, 2013–2020 (Million Square Meters)
Table 22 Asia-Pacific: By Market Size, By Printing Ink, 2013–2020 (USD Million)
Table 23 Asia-Pacific: By Market Size, By Printing Ink, 2013–2020 (Million Square Meters)
Table 24 Asia-Pacific: By Market Size, By Printing Technology, 2013–2020 (USD Million)
Table 25 Asia-Pacific: By Market Size, By Printing Technology, 2013–2020 (Million Square Meters)
Table 26 Asia-Pacific: By Market Size, By Application, 2013–2020 (USD Million)
Table 27 Asia-Pacific: By Market Size, By Application, 2013–2020 (Million Square Meters)
Table 28 China: Laminated Labels Market Size, By Composition, 2013–2020 (USD Million)
Table 29 China: By Market Size, By Form, 2013–2020 (USD Million)
Table 30 China: By Market Size, By Form, 2013–2020 (Million Square Meters)
Table 31 China: By Market Size, By Printing Ink, 2013–2020 (USD Million)
Table 32 China: By Market Size, By Printing Ink, 2013–2020 (Million Square Meters)
Table 33 China: By Market Size, By Printing Technology, 2013–2020 (USD Million)
Table 34 China: By Market Size, By Printing Technology, 2013–2020 (Million Square Meters)
Table 35 China: By Market Size, By Application, 2013–2020 (USD Million)
Table 36 China: By Market Size, By Application, 2013–2020 (Million Square Meters)
Table 37 Japan: Laminated Labels Market Size, By Composition, 2013–2020 (USD Million)
Table 38 Japan: By Market Size, By Form, 2013–2020 (USD Million)
Table 39 Japan: By Market Size, By Form, 2013–2020 (Million Square Meters)
Table 40 Japan: By Market Size, By Printing Ink, 2013–2020 (USD Million)
Table 41 Japan: By Market Size, By Printing Ink, 2013–2020 (Million Square Meters)
Table 42 Japan: By Market Size, By Printing Technology, 2013–2020 (USD Million)
Table 43 Japan: By Market Size, By Printing Technology, 2013–2020 (Million Square Meters)
Table 44 Japan: By Market Size, By Application, 2013–2020 (USD Million)
Table 45 Japan: By Market Size, By Application, 2013–2020 (Million Square Meters)
Table 46 India: Laminated Labels Market Size, By Composition, 2013–2020 (USD Million)
Table 47 India: By Market Size, By Form, 2013–2020 (USD Million)
Table 48 India: By Market Size, By Form, 2013–2020 (Million Square Meters)
Table 49 India: By Market Size, By Printing Ink, 2013–2020 (USD Million)
Table 50 India: By Market Size, By Printing Ink, 2013–2020 (Million Square Meters)
Table 51 India: By Market Size, By Printing Technology, 2013–2020 (USD Million)
Table 52 India: By Market Size, By Printing Technology, 2013–2020 (Million Square Meters)
Table 53 India: By Market Size, By Application, 2013–2020 (USD Million)
Table 54 India: By Market Size, By Application, 2013–2020 (Million Square Meters)
Table 55 Rest of Asia-Pacific: Laminated Labels Market Size, By Composition, 2013–2020 (USD Million)
Table 56 Rest of Asia-Pacific: By Market Size, By Form, 2013–2020 (USD Million)
Table 57 Rest of Asia-Pacific: By Market Size, By Form, 2013–2020 (Million Square Meters)
Table 58 Rest of Asia-Pacific: By Market Size, By Printing Ink, 2013–2020 (USD Million)
Table 59 Rest of Asia-Pacific: By Market Size, By Printing Ink, 2013–2020 (Million Square Meters)
Table 60 Rest of Asia-Pacific: By Market Size, By Printing Technology, 2013–2020 (USD Million)
Table 61 Rest of Asia-Pacific: By Market Size, By Printing Technology, 2013–2020 (Million Square Meters)
Table 62 Rest of Asia-Pacific: By Market Size, By Application, 2013–2020 (USD Million)
Table 63 Rest of Asia-Pacific: By Market Size, By Application, 2013–2020 (Million Square Meters)
Table 64 Europe: Laminated Labels Market Size, By Country, 2013–2020 (USD Million)
Table 65 Europe: By Market Size, By Country, 2013–2020 (Million Square Meters)
Table 66 Europe: By Market Size, By Composition, 2013–2020 (USD Million)
Table 67 Europe: By Market Size, By Form, 2013–2020 (USD Million)
Table 68 Europe: By Market Size, By Form, 2013–2020 (Million Square Meters)
Table 69 Europe: By Market Size, By Printing Ink, 2013–2020 (USD Million)
Table 70 Europe: By Market Size, By Printing Ink, 2013–2020 (Million Square Meters)
Table 71 Europe: By Market Size, By Printing Technology, 2013–2020 (USD Million)
Table 72 Europe: By Market Size, By Printing Technology, 2013–2020 (Million Square Meters)
Table 73 Europe: By Market Size, By Application, 2013–2020 (USD Million)
Table 74 Europe: By Market Size, By Application, 2013–2020 (Million Square Meters)
Table 75 Germany: Laminated Labels Market Size, By Composition, 2013–2020 (USD Million)
Table 76 Germany: By Market Size, By Form, 2013–2020 (USD Million)
Table 77 Germany: By Market Size, By Form, 2013–2020 (Million Square Meters)
Table 78 Germany: By Market Size, By Printing Ink, 2013–2020 (USD Million)
Table 79 Germany: By Market Size, By Printing Ink, 2013–2020 (Million Square Meters)
Table 80 Germany: By Market Size, By Printing Technology, 2013–2020 (USD Million)
Table 81 Germany: By Market Size, By Printing Technology, 2013–2020 (Million Square Meters)
Table 82 Germany: By Market Size, By Application, 2013–2020 (USD Million)
Table 83 Germany: By Market Size, By Application, 2013–2020 (Million Square Meters)
Table 84 U.K.: Laminated Labels Market Size, By Composition, 2013–2020 (USD Million)
Table 85 U.K.: By Market Size, By Form, 2013–2020 (USD Million)
Table 86 U.K.: By Market Size, By Form, 2013–2020 (Million Square Meters)
Table 87 U.K.: By Market Size, By Printing Ink, 2013–2020 (USD Million)
Table 88 U.K.: By Market Size, By Printing Ink, 2013–2020 (Million Square Meters)
Table 89 U.K.: By Market Size, By Printing Technology, 2013–2020 (USD Million)
Table 90 U.K.: By Market Size, By Printing Technology, 2013–2020 (Million Square Meters)
Table 91 U.K.: By Market Size, By Application, 2013–2020 (USD Million)
Table 92 U.K.: By Market Size, By Application, 2013–2020 (Million Square Meters)
Table 93 France: Laminated Label Market Size, By Composition, 2013–2020 (USD Million)
Table 94 France: By Market Size, By Form, 2013–2020 (USD Million)
Table 95 France: By Market Size, By Form, 2013–2020 (Million Square Meters)
Table 96 France: By Market Size, By Printing Ink, 2013–2020 (USD Million)
Table 97 France: By Market Size, By Printing Ink, 2013–2020 (Million Square Meters)
Table 98 France: By Market Size, By Printing Technology, 2013–2020 (USD Million)
Table 99 France: By Market Size, By Printing Technology, 2013–2020 (Million Square Meters)
Table 100 France: By Market Size, By Application, 2013–2020 (USD Million)
Table 101 France: By Market Size, By Application, 2013–2020 (Million Square Meters)
Table 102 Rest of Europe: Laminated Labels Market Size, By Composition, 2013–2020 (USD Million)
Table 103 Rest of Europe: Market Size, By Form, 2013–2020 (USD Million)
Table 104 Rest of Europe: Market Size, By Form, 2013–2020 (Million Square Meters)
Table 105 Rest of Europe: Market Size, By Printing Ink, 2013–2020 (USD Million)
Table 106 Rest of Europe: Market Size, By Printing Ink, 2013–2020 (Million Square Meters)
Table 107 Rest of Europe: Market Size, By Printing Technology, 2013–2020 (USD Million)
Table 108 Rest of Europe: Market Size, By Printing Technology, 2013–2020 (Million Square Meters)
Table 109 Rest of Europe: Market Size, By Application, 2013–2020 (USD Million)
Table 110 Rest of Europe: Market Size, By Application, 2013–2020 (Million Square Meters)
Table 111 North America: Laminated Labels Market Size, By Country, 2013–2020 (USD Million)
Table 112 North America: Market Size, By Country, 2013–2020 (Million Square Meters)
Table 113 North America: Market Size, By Composition, 2013–2020 (USD Million)
Table 114 North America: Market Size, By Form, 2013–2020 (USD Million)
Table 115 North America: Market Size, By Form, 2013–2020 (Million Square Meters)
Table 116 North America: Market Size, By Printing Ink, 2013–2020 (USD Million)
Table 117 North America: Market Size, By Printing Ink, 2013–2020 (Million Square Meters)
Table 118 North America: Market Size, By Printing Technology, 2013–2020 (USD Million)
Table 119 North America: Market Size, By Printing Technology, 2013–2020 (Million Square Meters)
Table 120 North America: Market Size, By Application, 2013–2020 (USD Million)
Table 121 North America: Market Size, By Application, 2013–2020 (Million Square Meters)
Table 122 U.S.: Laminated Labels Market Size, By Composition , 2013–2020 (USD Million)
Table 123 U.S.: Market Size, By Form, 2013–2020 (USD Million)
Table 124 U.S.: Market Size, By Form, 2013–2020 (Million Square Meters)
Table 125 U.S.: Market Size, By Printing Ink, 2013–2020 (USD Million)
Table 126 U.S.: Market Size, By Printing Ink, 2013–2020 (Million Square Meters)
Table 127 U.S.: Market Size, By Printing Technology, 2013–2020 (USD Million)
Table 128 U.S.: Market Size, By Printing Technology, 2013–2020 (Million Square Meters)
Table 129 U.S.: Market Size, By Application, 2013–2020 (USD Million)
Table 130 U.S.: Market Size, By Application, 2013–2020 (Million Square Meters)
Table 131 Canada: Laminated Labels Market Size, By Composition, 2013–2020 (USD Million)
Table 132 Canada: Market Size, By Form, 2013–2020 (USD Million)
Table 133 Canada: Market Size, By Form, 2013–2020 (Million Square Meters)
Table 134 Canada: Market Size, By Printing Ink, 2013–2020 (USD Million)
Table 135 Canada: Market Size, By Printing Ink, 2013–2020 (Million Square Meters)
Table 136 Canada: Market Size, By Printing Technology, 2013–2020 (USD Million)
Table 137 Canada: Market Size, By Printing Technology, 2013–2020 (Million Square Meters)
Table 138 Canada: Market Size, By Application, 2013–2020 (USD Million)
Table 139 Canada: Market Size, By Application, 2013–2020 (Million Square Meters)
Table 140 Mexico: Laminated Label Market Size, By Composition, 2013–2020 (USD Million)
Table 141 Mexico: Market Size, By Form, 2013–2020 (USD Million)
Table 142 Mexico: Market Size, By Form, 2013–2020 (Million Square Meters)
Table 143 Mexico: Market Size, By Printing Ink, 2013–2020 (USD Million)
Table 144 Mexico: Market Size, By Printing Ink, 2013–2020 (Million Square Meters)
Table 145 Mexico: Market Size, By Printing Technology, 2013–2020 (USD Million)
Table 146 Mexico: Market Size, By Printing Technology, 2013–2020 (Million Square Meters)
Table 147 Mexico: Market Size, By Application, 2013–2020 (USD Million)
Table 148 Mexico: Market Size, By Application, 2013–2020 (Million Square Meters)
Table 149 RoW: Laminated Labels Market Size, By Country, 2013–2020 (USD Million)
Table 150 RoW: Market Size, By Country, 2013–2020 (Million Square Meters)
Table 151 RoW: Market Size, By Composition, 2013–2020 (USD Million)
Table 152 RoW: Market Size, By Form, 2013–2020 (USD Million)
Table 153 RoW: Market Size, By Form, 2013–2020 (Million Square Meters)
Table 154 RoW: Market Size, By Printing Ink, 2013–2020 (USD Million)
Table 155 RoW: Market Size, By Printing Ink, 2013–2020 (Million Square Meters)
Table 156 RoW: Market Size, By Printing Technology, 2013–2020 (USD Million)
Table 157 RoW: Market Size, By Printing Technology, 2013–2020 (Million Square Meters)
Table 158 RoW: Market Size, By Application, 2013–2020 (USD Million)
Table 159 RoW: Market Size, By Application, 2013–2020 (Million Square Meters)
Table 160 Brazil: Laminated Labels Market Size, By Composition, 2013–2020 (USD Million)
Table 161 Brazil: Market Size, By Form, 2013–2020 (USD Million)
Table 162 Brazil: Market Size, By Form, 2013–2020 (Million Square Meters)
Table 163 Brazil: Market Size, By Printing Ink, 2013–2020 (USD Million)
Table 164 Brazil: Market Size, By Printing Ink, 2013–2020 (Million Square Meters)
Table 165 Brazil: Market Size, By Printing Technology, 2013–2020 (USD Million)
Table 166 Brazil: Market Size, By Printing Technology, 2013–2020 (Million Square Meters)
Table 167 Brazil: Market Size, By Application, 2013–2020 (USD Million)
Table 168 Brazil: Market Size, By Application, 2013–2020 (Million Square Meters)
Table 169 South Africa: Laminated Label Market Size, By Composition, 2013–2020 (USD Million)
Table 170 South Africa: Market Size, By Form, 2013–2020 (USD Million)
Table 171 South Africa: Market Size, By Form, 2013–2020 (Million Square Meters)
Table 172 South Africa: Market Size, By Printing Ink, 2013–2020 (USD Million)
Table 173 South Africa: Market Size, By Printing Ink, 2013–2020 (Million Square Meters)
Table 174 South Africa: Market Size, By Printing Technology, 2013–2020 (USD Million)
Table 175 South Africa: Market Size, By Printing Technology, 2013–2020 (Million Square Meters)
Table 176 South Africa: Market Size, By Application, 2013–2020 (USD Million)
Table 177 South Africa: Market Size, By Application, 2013–2020 (Million Square Meters)
Table 178 Argentina: Laminated Labels Market Size, By Composition, 2013–2020 (USD Million)
Table 179 Argentina: Market Size, By Form, 2013–2020 (USD Million)
Table 180 Argentina: Market Size, By Form, 2013–2020 (Million Square Meters)
Table 181 Argentina: Market Size, By Printing Ink, 2013–2020 (USD Million)
Table 182 Argentina: Market Size, By Printing Ink, 2013–2020 (Million Square Meters)
Table 183 Argentina: Market Size, By Printing Technology, 2013–2020 (USD Million)
Table 184 Argentina: Market Size, By Printing Technology, 2013–2020 (Million Square Meters)
Table 185 Argentina: Market Size, By Application, 2013–2020 (USD Million)
Table 186 Argentina: Market Size, By Application, 2013–2020 (Million Square Meters)
Table 187 Others in RoW: Laminated Labels Market Size, By Composition, 2013–2020 (USD Million)
Table 188 Others in RoW: Market Size, By Form, 2013–2020 (USD Million)
Table 189 Others in RoW: Market Size, By Form, 2013–2020 (Million Square Meters)
Table 190 Others in RoW: Market Size, By Printing Ink, 2013–2020 (USD Million)
Table 191 Others in RoW: Market Size, By Printing Ink, 2013–2020 (Million Square Meters)
Table 192 Others in RoW: Market Size, By Printing Technology, 2013–2020 (USD Million)
Table 193 Others Countries in RoW: Laminated Label Market Size, By Printing Technology, 2013–2020 (Million Square Meters)
Table 194 Others in RoW: Laminated Labels Market Size, By Application, 2013–2020 (USD Million)
Table 195 Others in RoW: Market Size, By Application, 2013–2020 (Million Square Meters)
Table 196 Mergers & Acquisitions, 2011–2015
Table 197 New Product Launches, 2011–2015
Table 198 Partnerships, Agreements, and Joint Ventures, 2011–2015
Table 199 Expansions, 2011–2015
List of Figures (64 Figures)
Figure 1 Laminated Labels Market
Figure 2 Laminated Label Market: Research Design
Figure 3 Breakdown of Primaries
Figure 4 Market Size Estimation Methodology: Bottom-Up Approach
Figure 5 Market Size Estimation Methodology: Top-Down Approach
Figure 6 Data Triangulation Methodology
Figure 7 Food & Beverages is Projected to Account for the Largest Share By 2020
Figure 8 Asia-Pacific is Projected to Dominate the Global Laminated Labels Market By 2020
Figure 9 China is Projected to Grow at the Highest CAGR From 2015 to 2020
Figure 10 Digital Printing for Laminated Labels is Projected to Dominate the Market By 2020
Figure 11 Key Market Players Adopted Mergers & Acquisitions as Key Strategies From 2011 to 2016
Figure 12 Emerging Economies Offer Attractive Opportunities in the Laminated Label Market
Figure 13 Digital Printing Captured the Largest Share in the Emerging Asia-Pacific Market in 2015
Figure 14 China Projected to Be the Fastest-Growing Country for Laminated Labels From 2015 to 2020
Figure 15 Asia-Pacific Occupied the Largest Market Share Among All Regions in 2014
Figure 16 Emerging Markets to Grow Faster Than Developed Markets, 2015-2020
Figure 17 Global Laminated Labels Market Snapshot, By Application, 2015
Figure 18 Evolution of Laminated Labels
Figure 19 Laminated Label Market Segmentation
Figure 20 Market Dynamics
Figure 21 Leading FMCG Companies Sales in 2014
Figure 22 Revenue of the Worldwide Pharmaceuticals Market (2001-2014)
Figure 23 B2C E-Commerce Sales in the U.S. (2011-2014)
Figure 24 Production Output Index of Consumer Durables in the U.K. (2010-2014)
Figure 25 Price Development for Paper and Plastic (2007-2011)
Figure 26 Laminated Labels Value Chain
Figure 27 Porter’s Five Forces Analysis
Figure 28 Laminated Labels Market, 2015 vs 2020 (USD Million)
Figure 29 Water-Based Ink Segment is Projected to Dominate the Laminated Labels Market Through 2020
Figure 30 Laminated Labels Market Size, By Printing Technology, 2015 vs 2020 (USD Million)
Figure 31 Laminated Label Market Size, By Form, 2015 vs 2020 (USD Million)
Figure 32 Laminated Labels Market Share (Value), By Application, 2015
Figure 33 Geographical Snapshot: Laminated Labels Market Growth Rate, 2015-2020
Figure 34 China is Poised to Grow at the Highest CAGR During the Forecast Period
Figure 35 Asia-Pacific: Market Snapshot
Figure 36 Growth of Sales in China’s Food Sector, 2005-2011
Figure 37 FMCG Market in India, 2003-2015
Figure 38 Europe: Market Snapshot
Figure 39 Plastic Consumption in Germany, 2014
Figure 40 Food & Beverage Turnover in France, 2009-2013
Figure 41 North America: Market Snapshot
Figure 42 U.S. Consumer Durables Market, 2011-2014 (USD Billion)
Figure 43 RoW: Market Snapshot
Figure 44 Companies Adopted Mergers & Acquisitions as Their Key Growth Strategy During the Studied Period (2011–2015)
Figure 45 Laminated Labels Market Developments, By Key Players, 2014
Figure 46 2014 Was Observed to Be the Most Active Year for the Laminated Labels Market
Figure 47 Mergers & Acquisitions: the Key Growth Strategy, 2011–2015
Figure 48 Geographic Revenue Mix of Top Five Players
Figure 49 Avery Dennison Corporation: Company Snapshot
Figure 50 Avery Dennison Corporation: SWOT Analysis
Figure 51 CCL Industries Inc.: Company Snapshot
Figure 52 CCL Industries Inc.: SWOT Analysis
Figure 53 3M Company: Company Snapshot
Figure 54 3M Company: SWOT Analysis
Figure 55 Constantia Flexibles Group GmbH: Company Snapshot
Figure 56 Constantia Flexibles Group GmbH: SWOT Analysis
Figure 57 Coveris Holdings S.A.: Company Snapshot
Figure 58 Coveris Holdings S.A.: SWOT Analysis
Figure 59 R.R. Donnelley& Sons Company: Company Snapshot
Figure 60 R.R. Donnelley & Sons Company: SWOT Analysis
Figure 61 Torraspapel Adestor: Company Snapshot
Figure 62 Bemis Company, Inc.: Company Snapshot
Figure 63 Marketsandmarkets Knowledge Store Snapshot
Figure 64 Marketsandmarkets Knowledge Store: Packaging Materials Industry Snapshot


Growth opportunities and latent adjacency in Laminated Labels Market