Laser Technology Market

Laser Technology Market by Laser Type (Solid, Gas, Liquid), Configuration (Fixed, Moving, Hybrid), Application (Laser Processing, Optical Communication), Vertical (Telecommunications, Automotive, Medical, Industrial) and Region - Global Forecast to 2029

Report Code: SE 2726 Apr, 2024, by marketsandmarkets.com

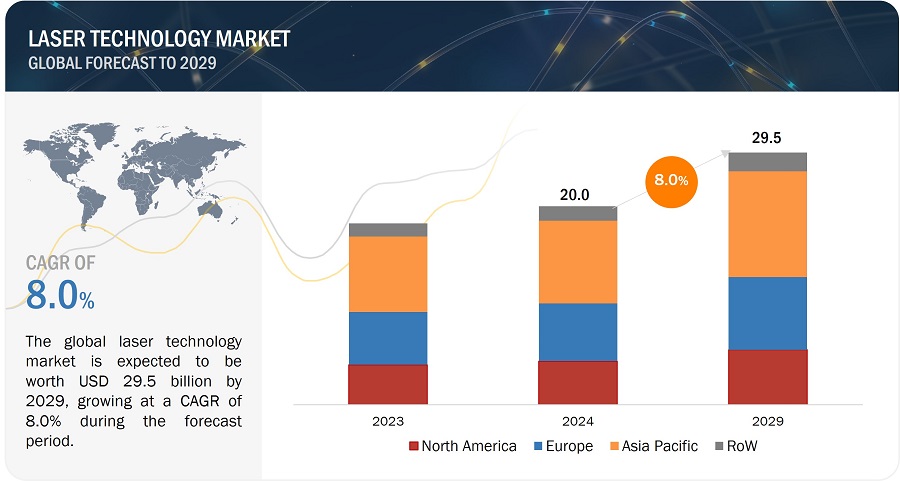
[259 Pages Report] The global laser technology market size is estimated to be valued at USD 20.0 billion in 2024 and is anticipated to reach USD 29.5 billion by 2029, at a CAGR of 8.0% during the forecast period. The market growth is ascribed to increasing demand for laser technology in healthcare vertical, better performance of laser-based techniques compared with conventional material processing methods, rising preference for laser-based material processing over traditional approaches, shift toward production of nanodevices and microdevices, growing adoption of smart manufacturing techniques.
Laser Technology Market

Laser Technology Market

Laser Technology Market Forecast to 2029

To know about the assumptions considered for the study, Request for Free Sample Report

Laser Technology Market Trends

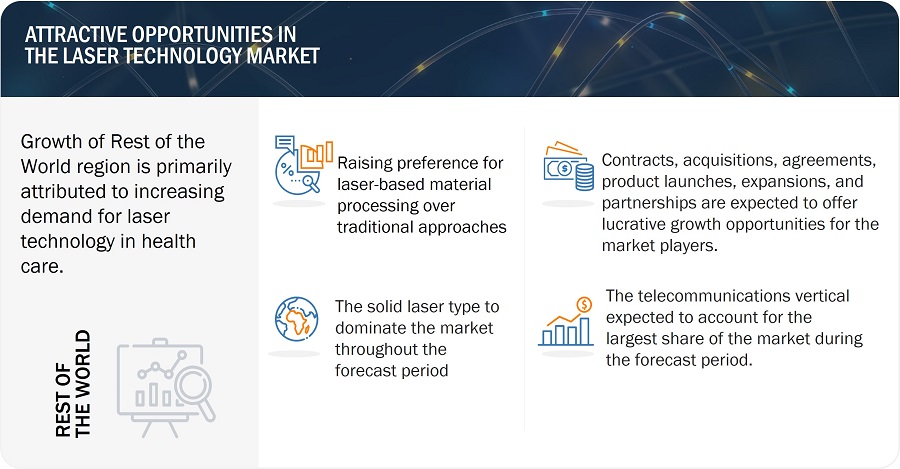
Driver: Increasing demand for laser technology in healthcare vertical

The healthcare industry is witnessing a substantial surge in the demand for laser technology due to its diverse applications and transformative impact on medical practices. In the healthcare vertical, laser technology has significant applications in urology, dermatology, dentistry, and ophthalmology. Laser technology advances medical care by offering precise, effective, and minimally invasive solutions for diagnosis, treatment, and surgery across various medical specialties. Ongoing research and innovation in laser technology are expected to expand its applications further and improve healthcare outcomes in the future.As in February 2023, the newest laser therapy to remove blockages in heart blood vessel was introduced for the first time in Central India. laser therapy in which a catheter that emits high energy light is used to unblock arteries. It vapourizes blockages and clears vessels without hurting the walls of vessels.

Noninvasive methods of body contouring and fat reduction are gaining popularity. Transdermal focused ultrasound, monopolar radiofrequency (RF), high-intensity focused ultrasound (HIFU), and cry lipolysis are advanced techniques used for body contouring and fat reduction. Furthermore, fractionation treatments are leading to improvements in skin treatment procedures. Laser technology helps minimize bleeding and pain and leads to faster healing of human tissues. Hence, the increasing number of cosmetic laser surgeries and advancements in laser technology devices and ophthalmology lasers are fueling the demand for laser technology in the healthcare vertical.

Restraint: High deployment cost

The laser technology market faces challenge in the form of high deployment costs, which act as a barrier to widespread adoption across industries. The intricate nature of laser systems necessitates the use of specialized components, cutting-edge technologies, and strict safety measures, all of which contribute significantly to the overall deployment expenses. Research and development investments aimed at advancing laser technologies and ensuring compliance with safety standards further contribute to the high upfront costs. Quality assurance procedures, infrastructure requirements, and the need for customization to suit specific applications contribute to the overall financial commitment associated with deploying laser technology.  The high deployment cost of lasers can be attributed to several factors, including the complexity of laser systems, the cost of materials and components, research and development expenses, and the specialized expertise required for design, manufacturing, and maintenance. Laser systems require specialized components such as diodes, optical elements, semiconductor materials, and control electronics. These components are often expensive to manufacture, and their high precision and quality contribute to the overall cost of laser systems.

The lack of trained personnel is another factor that is restraining the growth of the laser technology market. Skilled labor is essential for operating and maintaining laser systems, adding expenses related to hiring and training qualified professionals For instance, the operation of an excimer laser requires the presence of at least one trained personnel to ensure that the operator is aware of the protocols to be followed during the use of laser systems. The lack of trained staff could damage the materials involved in laser processing and lead to high time consumption.

Opportunity: Growing adoption of laser technology for optical communication

Optical communication uses light as a platform for transmission. Laser technology provides advantages over radio waves as light waves are packed tightly compared to sound waves. Laser fiber optics have many fibers wrapped inside a cable, in which each cable contains many laser beams. Every laser beam has the potential to carry billions of bits of data. Thus, laser technology can transfer more data per second with strong signal quality.

Laser technology enables high-speed data transmission in optical communication systems, supporting data rates ranging from gigabits per second (Gbps) to terabits per second (Tbps). High-speed laser-based communication systems are essential for meeting the increasing demand for bandwidth in modern telecommunications networks.

In the coming years, laser technology is expected to be widely used for optical communication as it can transmit multiple signals at a low loss and is monochromatic. Laser manufacturers focus on increasing the speed of lasers and decreasing the size of components to meet the demand for sophisticated optical communication applications.

Laser technology is emerging as a game-changer in satellite communications (SATCOM), enabling the creation of ultra-secure networks capable of transmitting vast amounts of data at unprecedented speeds via satellite networks and constellations. With ongoing advancements, the industry is poised for growth and collaboration, seizing the untapped potential of unconnected populations. The ability to handle the surging volume of data is a key advantage offered by laser communications, providing a significant value proposition. As in 2024 it is revealed by Breaking Defence that the project called Kepler is introduced which will bring Internet connectivity to space.

Challenge: Technical challenges associated to high-power lasers

The use of high-power lasers poses several challenges. High-power lasers, characterized by their output levels in the kilowatt (kW) to megawatt (MW) range, present several technical complexities that necessitate careful consideration in their design and operation. Enhancing the reliability and lifetime of lasers to meet the demands of industrial, medical, and aerospace applications is critical. Challenges pertaining to these applocations majorly include improving the stability of laser diodes, minimizing degradation mechanisms, and increasing component lifetimes under harsh operating conditions.High-power solid-state lasers exhibit strong thermal lensing, making achieving a high beam quality more challenging. Lasers with polarized output often compromise efficiency compared to lasers with depolarized output. Efficient heat removal and thermal management are issues that require additional measures to be resolved. High-power lasers also exhibit non-linear effects, such as Raman scattering, Brillouin scattering, and four-wave mixing.

The delivery and control of high-power laser beams poe challenges, demanding robust systems to ensure beam stability, pointing accuracy, and focus control over long distances.

Market Ecosystem
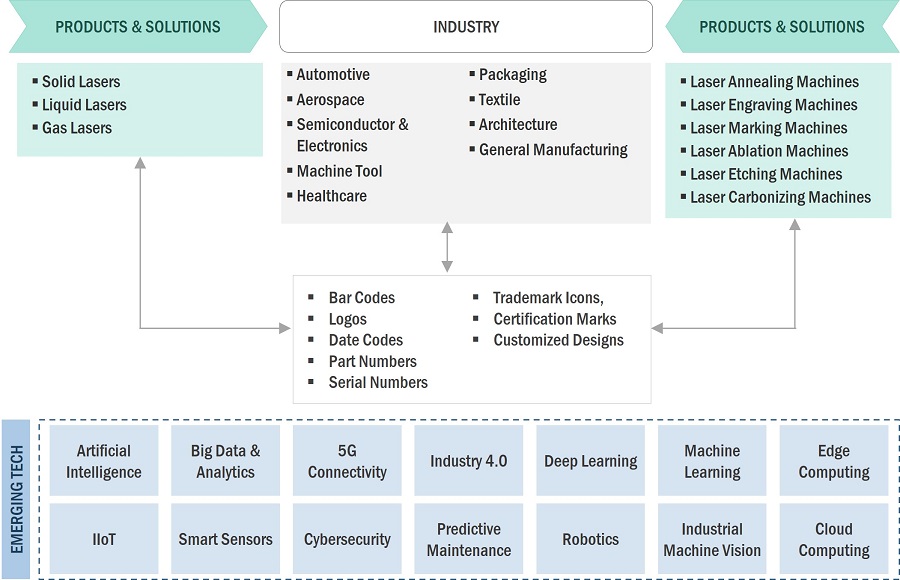
Laser Technology Market by Ecosystem

The Solid laser type segment accounted for the largest share of the laser technology market in 2023.

Solid laser type segment accounted for the largest share of the laser technology market in 2023. Solid-state lasers lead the laser technology market owing to their adaptability, dependability, efficiency, compactness, and safety features. They serve diverse industries like manufacturing, healthcare, defense, communication, and entertainment. Technological advancements continually enhance their performance and affordability, making them economically advantageous. With their efficient energy conversion and extended operational lifespan, solid-state lasers are widely embraced across commercial and industrial sectors. In essence, their blend of performance, reliability, and cost-effectiveness cements their position as the preferred laser technology.

The hybrid configuration segment is expected hold the largest market share during the forecast period.

Hybrid configurations in laser technology dominate the laser processing market due to their versatility, optimized performance, flexibility, and potential synergistic effects. These systems provide a wider range of capabilities, meeting a variety of processing needs across sectors by combining several laser sources, such as fiber, CO2, and solid-state lasers. They improve performance for certain jobs, improve flexibility in response to changing needs, and can result in cost savings through equipment consolidation.

The laser processing application segment accounted for the largest share of the laser technology market in 2023.

The Laser processing encompasses a broad range of applications within laser technology, leveraging the unique properties of laser light for various industrial tasks. Laser technology offers unparalleled precision, speed, and versatility in tasks such as cutting, welding, marking, engraving, and drilling across various materials like metals, plastics, ceramics, and composites. Industries such as manufacturing, automotive, aerospace, electronics, healthcare, and consumer goods heavily rely on laser processing for its ability to deliver high-quality results with minimal material waste, reduced operational costs, and increased productivity.

Medical vertical will grow at the highest CAGR during the forecast period.

The laser technology plays a crucial role in medical procedures such as ophthalmology, dermatology, dentistry, and surgery due to its precision, minimally invasive nature, and ability to target specific tissues with high accuracy. As medical technologies progress, the market for medical lasers is expected to rise due to the growing need for laser-based procedures and treatments. Additionally, the aging population worldwide contributes to the rising demand for medical procedures, including those utilizing laser technology, to address age-related conditions such as vision impairments, skin disorders, and chronic diseases. Furthermore, continuous advancements in laser technology, including improved safety, efficacy, and accessibility of laser systems, make them more widely adopted in medical settings.

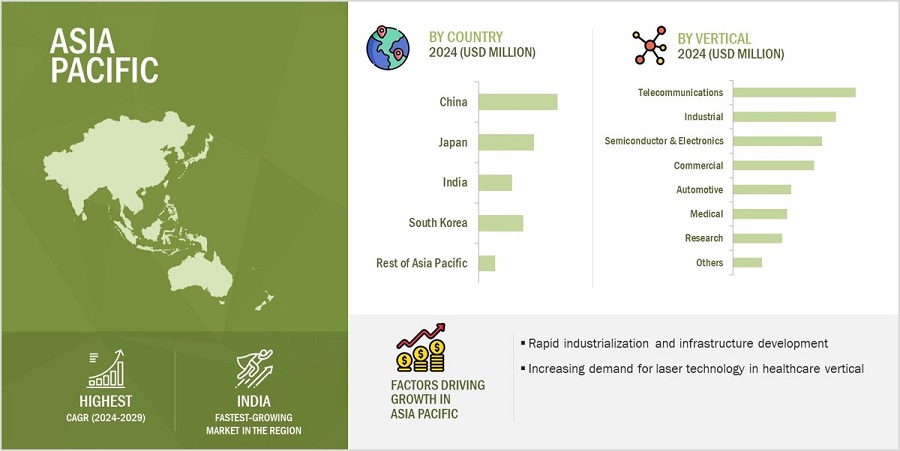
Asia Pacific holds the largest market share of the laser technology market throughout the forecast period.

Asia Pacific consists of – China, Japan, india, and South Korea. The region is home to some of the world's largest manufacturing hubs, including China, Japan, South Korea. These countries have a strong presence in industries such as automotive, electronics, semiconductors, and consumer goods, which are significant users of laser technology for applications like cutting, welding, marking, and engraving. Asia Pacific is experiencing rapid industrialization and urbanization, driving the demand for advanced manufacturing processes and technologies.
Laser Technology Market by Region

Laser Technology Market by Region

To know about the assumptions considered for the study, download the pdf brochure

Key Market Players

The major companies in the laser technology companies are Coherent (US), TRUMPF (Germany), Han’s Laser Technology Industry Group Co., Ltd (China), IPG Photonics (US) and Jenoptik AG (Germany) and others. These companies have used both organic and inorganic growth strategies, such as product launches, acquisitions, and partnerships to strengthen their position in the laser technology market.

Get online access to the report on the World's First Market Intelligence Cloud

  • Easy to Download Historical Data & Forecast Numbers
  • Company Analysis Dashboard for high growth potential opportunities
  • Research Analyst Access for customization & queries
  • Competitor Analysis with Interactive dashboard
  • Latest News, Updates & Trend analysis
Request Sample

Scope of the Report

Report Metric

Details

Years Considered

2020–2029

Base year considered

2023

Forecast period

2024–2029

Forecast units

Value (USD million/billion)

Segments Covered

Type, Configuration, Application, Vertical, and Region

Regions covered

North America, Asia Pacific, Europe, and Rest of the World

Companies covered

Coherent (US), Trumpf (Germany), Han’s Laser Technology Industry Group Co., Ltd (China), IPG Photonics (US) and Jenoptik AG (Germany), A total of 25 players are covered.

Laser Technology Market Highlights

In this report, the overall laser technology market has been segmented based on Type, Configuration, Application, Vertical, and Region.

Segment

Subsegment

By Type

  • Solid Lasers
  • Liquid Lasers
  • Gas Lasers
  • Other Types

By Configuration

  • Fixed
  • Moving
  • Hybrid

By Application

  • Laser Processing
  • Optical Communication
  • Optoelectronic Devices
  • Other Applications

By Vertical

  • Telecommunication
  • Industrial
  • Semiconductor & Electronics
  • Commercial
  • Aerospace
  • Automotive
  • Medical
  • Research
  • Other Verticals

By Region

  • North America
    • US
    • Canada
    • Mexico
  • Europe
    • Germany
    • France
    • UK
    • Rest of Europe
  • Asia Pacific
    • China
    • Japan
    • South Korea
    • India
    • Rest of Asia Pacific
  • Rest of the World
    • South America
    • GCC Countries
    • Africa & Rest of Middle East

Recent Developments

  • In January 2024, Coherent Corp. introduced the OBIS 640 XT, a red laser module that matches the high output power, low noise, beam quality, and compact size of its existing portfolio of blue and green laser modules, which is a complete set. It also enables the high performance of SRM systems.
  • In November 2023, IPG Photonics Corporation, a global leader in fiber laser technology, collaborated with Miller Electronics Mfg. LLC, a leading worldwide manufacturer of arc welding products, is in line with its commitment to innovation, quality, and reliability. The alliance will advance laser technologies for the handheld welding market and reshape the landscape of welding tools to provide welders with powerful, efficient, and precise solutions that meet the demands of modern welding applications. This collaboration will deliver dependable solutions that welders can rely on for their critical tasks.
  • In October 2023, TRUMPF launched the TruMatic 5000 laser machine for fully automated laser-cutting, punching, and forming capabilities. This machine enables a fully automated flow of materials within the manufacturing cell, from loading and unloading the machine to removing finished parts.

Frequently Asked Questions (FAQs):

To speak to our analyst for a discussion on the above findings, click Speak to Analyst

TABLE OF CONTENTS
 
1 INTRODUCTION (Page No. - 31)
    1.1 STUDY OBJECTIVES 
    1.2 MARKET DEFINITION 
    1.3 STUDY SCOPE 
           1.3.1 INCLUSIONS AND EXCLUSIONS
           1.3.2 MARKETS COVERED
                    FIGURE 1 LASER TECHNOLOGY MARKET SEGMENTATION
           1.3.3 REGIONAL SCOPE
           1.3.4 YEARS CONSIDERED
    1.4 CURRENCY CONSIDERED 
    1.5 UNITS CONSIDERED 
    1.6 STAKEHOLDERS 
    1.7 SUMMARY OF CHANGES 
    1.8 RECESSION IMPACT 
 
2 RESEARCH METHODOLOGY (Page No. - 35)
    2.1 RESEARCH DATA 
           FIGURE 2 LASER TECHNOLOGY MARKET: RESEARCH DESIGN
           2.1.1 SECONDARY DATA
                    2.1.1.1 List of major secondary sources
                    2.1.1.2 Key data from secondary sources
           2.1.2 PRIMARY DATA
                    2.1.2.1 Breakdown of primaries
                    2.1.2.2 List of primary interview participants
                    2.1.2.3 Key industry insights
                    2.1.2.4 Key data from primary sources
           2.1.3 SECONDARY AND PRIMARY RESEARCH
                        FIGURE 3 LASER TECHNOLOGY MARKET: RESEARCH APPROACH
    2.2 MARKET SIZE ESTIMATION METHODOLOGY 
           2.2.1 BOTTOM-UP APPROACH
                    2.2.1.1 Approach to estimate market size using bottom-up analysis (demand side)
                               FIGURE 4 MARKET SIZE ESTIMATION METHODOLOGY: BOTTOM-UP APPROACH
           2.2.2 TOP-DOWN APPROACH
                    2.2.2.1 Approach to estimate market size using top-down analysis (supply side)
                               FIGURE 5 MARKET SIZE ESTIMATION METHODOLOGY: TOP-DOWN APPROACH
                               FIGURE 6 LASER TECHNOLOGY MARKET SIZE ESTIMATION METHODOLOGY
    2.3 DATA TRIANGULATION 
          FIGURE 7 DATA TRIANGULATION
    2.4 RESEARCH ASSUMPTIONS 
    2.5 RESEARCH LIMITATIONS 
    2.6 RISK ASSESSMENT 
    2.7 PARAMETERS CONSIDERED TO ANALYZE RECESSION IMPACT ON LASER TECHNOLOGY MARKET 
 
3 EXECUTIVE SUMMARY (Page No. - 46)
    FIGURE 8 LASER TECHNOLOGY MARKET, 2020−2029
    FIGURE 9 SOLID LASERS SEGMENT TO ACCOUNT FOR LARGEST MARKET SHARE IN 2024
    FIGURE 10 HYBRID BEAM SEGMENT DOMINATED MARKET IN 2023
    FIGURE 11 LASER PROCESSING SEGMENT TO RECORD HIGHEST CAGR DURING FORECAST PERIOD
    FIGURE 12 TELECOMMUNICATIONS SEGMENT TO DOMINATE MARKET FROM 2024 TO 2029
    FIGURE 13 ASIA PACIFIC CLAIMED LARGEST MARKET SHARE IN 2023
 
4 PREMIUM INSIGHTS (Page No. - 50)
    4.1 ATTRACTIVE OPPORTUNITIES FOR PLAYERS IN LASER TECHNOLOGY MARKET 
           FIGURE 14 RISING PREFERENCE FOR LASER-BASED MATERIAL PROCESSING OVER TRADITIONAL MATERIAL PROCESSING METHODS TO DRIVE LASER TECHNOLOGY MARKET
    4.2 LASER TECHNOLOGY MARKET, BY APPLICATION 
           FIGURE 15 LASER PROCESSING SEGMENT ACCOUNTED FOR LARGEST MARKET SHARE IN 2023
    4.3 LASER TECHNOLOGY MARKET, BY LASER TYPE 
           FIGURE 16 SOLID LASERS SEGMENT TO DOMINATE MARKET IN 2029
    4.4 LASER TECHNOLOGY MARKET, BY VERTICAL 
           FIGURE 17 TELECOMMUNICATIONS SEGMENT TO LEAD MARKET FROM 2024 TO 2029
    4.5 LASER TECHNOLOGY MARKET, BY REGION 
           FIGURE 18 INDIA TO RECORD HIGHEST CAGR IN GLOBAL LASER TECHNOLOGY MARKET DURING FORECAST PERIOD
 
5 MARKET OVERVIEW (Page No. - 53)
    5.1 INTRODUCTION 
    5.2 MARKET DYNAMICS 
                    FIGURE 19 LASER TECHNOLOGY MARKET: DRIVERS, RESTRAINTS, OPPORTUNITIES, AND CHALLENGES
           5.2.1 DRIVERS
                    5.2.1.1 Growing use in healthcare industry
                    5.2.1.2 High levels of precision and minimized material waste
                    5.2.1.3 Increasing preference for laser-based material processing over conventional methods
                    5.2.1.4 Rising production of nanodevices and microdevices
                               FIGURE 20 GLOBAL SEMICONDUCTOR SILICON MATERIAL SALES, 2020–2022
                    5.2.1.5 Adoption of smart manufacturing techniques
                    5.2.1.6 Growing demand in automotive and manufacturing sectors
                               FIGURE 21 LASER TECHNOLOGY MARKET: IMPACT ANALYSIS OF DRIVERS
           5.2.2 RESTRAINTS
                    5.2.2.1 High deployment cost
                    5.2.2.2 Shortage of skilled professionals
                        FIGURE 22 LASER TECHNOLOGY MARKET: IMPACT ANALYSIS OF RESTRAINTS
           5.2.3 OPPORTUNITIES
                    5.2.3.1 Application of laser spectroscopy and imaging technologies in various verticals
                    5.2.3.2 Deployment in optical communication
                    5.2.3.3 Ongoing advancements in satellite communications
                    5.2.3.4 Growing applications in research and development
                               FIGURE 23 FIBER BROADBAND SUBSCRIPTION STATISTICS FOR TOP 10 COUNTRIES, 2022
                               FIGURE 24 LASER TECHNOLOGY MARKET: IMPACT ANALYSIS OF OPPORTUNITIES
           5.2.4 CHALLENGES
                    5.2.4.1 Environmental concerns associated with processing and extraction of rare-earth metals
                    5.2.4.2 Requirement for wall plug with high efficiency for long-term CW operations
                    5.2.4.3 Contamination of materials during laser welding process
                               FIGURE 25 LASER TECHNOLOGY MARKET: IMPACT ANALYSIS OF CHALLENGES
    5.3 SUPPLY CHAIN ANALYSIS 
                    FIGURE 26 LASER TECHNOLOGY MARKET: SUPPLY CHAIN ANALYSIS
    5.4 ECOSYSTEM ANALYSIS 
           FIGURE 27 GLOBAL LASER TECHNOLOGY ECOSYSTEM
           TABLE 1 ROLE OF PARTICIPANTS IN ECOSYSTEM
    5.5 INVESTMENT AND FUNDING SCENARIO 
           FIGURE 28 INVESTMENT AND FUNDING SCENARIO, 2023
    5.6 PRICING ANALYSIS 
           5.6.1 AVERAGE SELLING PRICE OF FIBER LASERS, 2020−2029
                    FIGURE 29 AVERAGE SELLING PRICE OF FIBER LASERS
           5.6.2 AVERAGE SELLING PRICE OF LASERS OFFERED BY THREE KEY PLAYERS, BY TYPE, 2023
                    FIGURE 30 AVERAGE SELLING PRICE OF LASERS OFFERED BY THREE KEY PLAYERS, BY TYPE, 2023
                    TABLE 2 AVERAGE SELLING PRICE OF LASERS OFFERED BY THREE KEY PLAYERS, BY TYPE
           5.6.3 AVERAGE SELLING PRICE OF FIBER LASERS, BY REGION
                    FIGURE 31 AVERAGE SELLING PRICE OF FIBER LASERS, BY REGION, 2021−2023 (USD)
    5.7 TRENDS/DISRUPTIONS IMPACTING CUSTOMERS' BUSINESSES 
                    FIGURE 32 TRENDS/DISRUPTIONS IMPACTING CUSTOMERS' BUSINESSES
    5.8 TECHNOLOGY ANALYSIS 
           5.8.1 KEY TECHNOLOGY
                    5.8.1.1 Adjustable mode beam lasers
                    5.8.1.2 Additive manufacturing locus beam control
           5.8.2 COMPLEMENTARY TECHNOLOGY
                    5.8.2.1 LiDAR
           5.8.3 ADJACENT TECHNOLOGY
                    5.8.3.1 Quantum cascade lasers
    5.9 PORTER'S FIVE FORCES ANALYSIS 
           FIGURE 33 LASER TECHNOLOGY MARKET: PORTER'S FIVE FORCES ANALYSIS
           TABLE 3 LASER TECHNOLOGY MARKET: PORTER'S FIVE FORCES ANALYSIS
           5.9.1 THREAT OF NEW ENTRANTS
           5.9.2 THREAT OF SUBSTITUTES
           5.9.3 BARGAINING POWER OF SUPPLIERS
           5.9.4 BARGAINING POWER OF BUYERS
           5.9.5 INTENSITY OF COMPETITIVE RIVALRY
    5.10 KEY STAKEHOLDERS AND BUYING CRITERIA 
           5.10.1 KEY STAKEHOLDERS IN BUYING PROCESS
                     FIGURE 34 INFLUENCE OF STAKEHOLDERS ON BUYING PROCESS, BY VERTICAL
                     TABLE 4 INFLUENCE OF STAKEHOLDERS ON BUYING PROCESS, BY VERTICAL (%)
           5.10.2 BUYING CRITERIA
                     FIGURE 35 KEY BUYING CRITERIA, BY VERTICAL
           5.10.3 KEY BUYING CRITERIA FOR TOP THREE VERTICALS
    5.11 CASE STUDY ANALYSIS 
           5.11.1 FORMER DSTL INVENTORS MAKE LASER DETECTION AND PROTECTION SYSTEMS FOR DEFENSE AND SECURITY INDUSTRIES
           5.11.2 LASER MANUFACTURER COLLABORATES WITH DENTON VACUUM TO INTRODUCE E-BEAM EVAPORATION FOR LASER BAR FACET AR AND HR COATING
           5.11.3 LASER MARKING TECHNOLOGIES CREATE MATERIALS THAT ABSORB INFRARED WAVELENGTH
    5.12 TRADE ANALYSIS 
           5.12.1 IMPORT DATA
                        FIGURE 36 IMPORT DATA FOR HS CODE 901320-COMPLIANT PRODUCTS, BY COUNTRY, 2018–2022 (USD MILLION)
           5.12.2 EXPORT DATA
                        FIGURE 37 EXPORT DATA FOR HS CODE 901320-COMPLIANT PRODUCTS, BY COUNTRY, 2018–2022 (USD MILLION)
    5.13 PATENT ANALYSIS 
           FIGURE 38 NUMBER OF PATENTS APPLIED AND GRANTED, 2014–2023
           TABLE 5 LIST OF MAJOR PATENTS APPLIED/GRANTED, 2021–2024
    5.14 KEY CONFERENCES AND EVENTS, 2024–2025 
           TABLE 6 LASER TECHNOLOGY MARKET: LIST OF KEY CONFERENCES AND EVENTS, 2024–2025
    5.15 REGULATORY LANDSCAPE AND STANDARDS 
           5.15.1 REGULATORY BODIES, GOVERNMENT AGENCIES, AND OTHER ORGANIZATIONS
                        TABLE 7 NORTH AMERICA: LIST OF REGULATORY BODIES, GOVERNMENT AGENCIES, AND OTHER ORGANIZATIONS
                        TABLE 8 EUROPE: LIST OF REGULATORY BODIES, GOVERNMENT AGENCIES, AND OTHER ORGANIZATIONS
                        TABLE 9 ASIA PACIFIC: LIST OF REGULATORY BODIES, GOVERNMENT AGENCIES, AND OTHER ORGANIZATIONS
                        TABLE 10 ROW: LIST OF REGULATORY BODIES, GOVERNMENT AGENCIES, AND OTHER ORGANIZATIONS
           5.15.2 STANDARDS
                    5.15.2.1 IEC 60825-1:2014
                    5.15.2.2 ANSI Z136.1
                    5.15.2.3 Federal Laser Product Performance Standard (FLPPS)
                    5.15.2.4 International Commission on Non-Ionizing Radiation Protection (ICNIRP)
                    5.15.2.5 EN 60825 – Safety of Laser Products
                    5.15.2.6 FDA Standards
 
6 RECENT TRENDS AND IMPLEMENTATION AREAS OF LASER TECHNOLOGY (Page No. - 90)
    6.1 INTRODUCTION 
    6.2 RECENT TRENDS IN LASER TECHNOLOGY 
           6.2.1 FEMTOSECOND LASERS
           6.2.2 GREEN AND ULTRAFAST LASERS
           6.2.3 LASER SURFACE TEXTURING
           6.2.4 LASER CLEANING AND COATING REMOVAL
           6.2.5 LASER SAFETY TECHNOLOGIES
           6.2.6 SMART MANUFACTURING AND INDUSTRY 4.0 TECHNOLOGY INTEGRATION
    6.3 IMPLEMENTATION AREAS OF LASER TECHNOLOGY 
           6.3.1 LASER PRINTERS
           6.3.2 LASER GYROSCOPES
           6.3.3 LASER HEADLIGHTS
           6.3.4 LASER RANGEFINDERS
           6.3.5 LASER SECURITY SYSTEMS
           6.3.6 OTHER IMPLEMENTATION AREAS
 
7 LASER PROCESSING COMPONENTS (Page No. - 94)
    7.1 INTRODUCTION 
           FIGURE 39 LASER PROCESSING COMPONENTS
    7.2 LASER SYSTEMS 
    7.3 LASERS 
 
8 LASER TECHNOLOGY MARKET, BY LASER TYPE (Page No. - 97)
    8.1 INTRODUCTION 
           FIGURE 40 LASER TECHNOLOGY MARKET, BY LASER TYPE
           FIGURE 41 SOLID LASERS SEGMENT TO REGISTER HIGHEST CAGR DURING FORECAST PERIOD
           TABLE 11 LASER TECHNOLOGY MARKET, BY LASER TYPE, 2020–2023 (USD MILLION)
           TABLE 12 LASER TECHNOLOGY MARKET, BY LASER TYPE, 2024–2029 (USD MILLION)
    8.2 SOLID LASERS 
           TABLE 13 SOLID LASERS: LASER TECHNOLOGY MARKET, BY REGION, 2020–2023 (USD MILLION)
           TABLE 14 SOLID LASERS: LASER TECHNOLOGY MARKET, BY REGION, 2024–2029 (USD MILLION)
           TABLE 15 SOLID LASERS: LASER TECHNOLOGY MARKET, BY TYPE, 2020–2023 (USD MILLION)
           TABLE 16 SOLID LASERS: LASER TECHNOLOGY MARKET, BY TYPE, 2024–2029 (USD MILLION)
           8.2.1 FIBER LASERS
                    8.2.1.1 Widespread use in telecommunications for transmitting data to drive market
                               TABLE 17 FIBER LASERS: LASER TECHNOLOGY MARKET, 2020–2023 (THOUSAND UNITS)
                               TABLE 18 FIBER LASERS: LASER TECHNOLOGY MARKET, 2024–2029 (THOUSAND UNITS)
           8.2.2 RUBY LASERS
                    8.2.2.1 Ability to offer short bursts of high-intensity light with no wastage of material to accelerate demand
           8.2.3 YTTRIUM ALUMINUM GARNET (YAG) LASERS
                    8.2.3.1 Growing demand for high-energy laser beams to fuel market growth
           8.2.4 SEMICONDUCTOR LASERS
                    8.2.4.1 Increasing applications in metrology, spectroscopy, and laser material processing to boost demand
           8.2.5 THIN-DISK LASERS
                    8.2.5.1 Ability to produce high output powers with good beam quality to accelerate demand
    8.3 LIQUID LASERS 
           8.3.1 RISING APPLICATION IN REMOTE SENSING AND MAPPING TECHNOLOGIES TO BOOST DEMAND
                        TABLE 19 LIQUID LASERS: LASER TECHNOLOGY MARKET, BY REGION, 2020–2023 (USD MILLION)
                        TABLE 20 LIQUID LASERS: LASER TECHNOLOGY MARKET, BY REGION, 2024–2029 (USD MILLION)
    8.4 GAS LASERS 
           TABLE 21 GAS LASERS: LASER TECHNOLOGY MARKET, BY REGION, 2020–2023 (USD MILLION)
           TABLE 22 GAS LASERS: LASER TECHNOLOGY MARKET, BY REGION, 2024–2029 (USD MILLION)
           TABLE 23 GAS LASERS: LASER TECHNOLOGY MARKET, BY TYPE, 2020–2023 (USD MILLION)
           TABLE 24 GAS LASERS: LASER TECHNOLOGY MARKET, BY TYPE, 2024–2029 (USD MILLION)
           8.4.1 CO2 LASERS
                    8.4.1.1 Growing deployment in military sector to boost demand
           8.4.2 EXCIMER LASERS
                    8.4.2.1 Increasing demand for material processing and industrial applications to drive market
           8.4.3 HELIUM-NEON LASERS
                    8.4.3.1 Low cost and ease of use to boost demand
           8.4.4 ARGON LASERS
                    8.4.4.1 Rising use in medical procedures to accelerate demand
           8.4.5 CHEMICAL LASERS
                    8.4.5.1 Growing applications in directed energy weapons and anti-missile systems to drive market
    8.5 OTHER LASER TYPES 
           TABLE 25 OTHER LASER TYPES: LASER TECHNOLOGY MARKET, BY REGION, 2020–2023 (USD MILLION)
           TABLE 26 OTHER LASER TYPES: LASER TECHNOLOGY MARKET, BY REGION, 2024–2029 (USD MILLION)
 
9 LASER TECHNOLOGY MARKET, BY CONFIGURATION (Page No. - 113)
    9.1 INTRODUCTION 
           FIGURE 42 LASER TECHNOLOGY MARKET, BY CONFIGURATION
           FIGURE 43 MOVING BEAM SEGMENT TO EXHIBIT HIGHEST CAGR DURING FORECAST PERIOD
           TABLE 27 LASER TECHNOLOGY MARKET, BY CONFIGURATION, 2020–2023 (USD MILLION)
           TABLE 28 LASER TECHNOLOGY MARKET, BY CONFIGURATION, 2024–2029 (USD MILLION)
           9.1.1 FIXED BEAMS
                    9.1.1.1 Increasing use for cutting and welding metals to drive market
           9.1.2 MOVING BEAMS
                    9.1.2.1 Requirement for rapid and precise laser beam movements to foster segmental growth
           9.1.3 HYBRID BEAMS
                    9.1.3.1 Need for enhanced efficiency and flexibility of laser technology to expedite segmental growth
                        TABLE 29 COMPARISON OF DIFFERENT LASER TECHNOLOGY CONFIGURATIONS
 
10 LASER TECHNOLOGY MARKET, BY APPLICATION (Page No. - 117)
     10.1 INTRODUCTION 
             FIGURE 44 LASER TECHNOLOGY MARKET, BY APPLICATION
             FIGURE 45 LASER PROCESSING SEGMENT TO EXHIBIT HIGHEST CAGR DURING FORECAST PERIOD
             TABLE 30 LASER TECHNOLOGY MARKET, BY APPLICATION, 2020–2023 (USD MILLION)
             TABLE 31 LASER TECHNOLOGY MARKET, BY APPLICATION, 2024–2029 (USD MILLION)
     10.2 LASER PROCESSING 
             10.2.1 GROWING UTILIZATION OF LASER SURFACE ALLOYING IN AUTOMOTIVE AND AEROSPACE INDUSTRIES TO DRIVE MARKET
                        TABLE 32 LASER PROCESSING: LASER TECHNOLOGY MARKET, BY REGION, 2020–2023 (USD MILLION)
                        TABLE 33 LASER PROCESSING: LASER TECHNOLOGY MARKET, BY REGION, 2024–2029 (USD MILLION)
             10.2.2 MACRO PROCESSING
                        10.2.2.1 Cutting
                                     10.2.2.1.1 Fusion cutting
                                     10.2.2.1.2 Flame cutting
                                     10.2.2.1.3 Sublimation cutting
                        10.2.2.2 Drilling
                                     10.2.2.2.1 Single-pulse drilling
                                     10.2.2.2.2 Percussion drilling
                                     10.2.2.2.3 Trepanning drilling
                                     10.2.2.2.4 Helical drilling
                        10.2.2.3 Welding
                        10.2.2.4 Marking and engraving
             10.2.3 MICROPROCESSING
             10.2.4 ADVANCED PROCESSING
     10.3 OPTICAL COMMUNICATION 
             10.3.1 GROWING DEMAND IN DATA NETWORKING TO BOOST DEMAND
                        TABLE 34 OPTICAL COMMUNICATION: LASER TECHNOLOGY MARKET, BY REGION, 2020–2023 (USD MILLION)
                        TABLE 35 OPTICAL COMMUNICATION: LASER TECHNOLOGY MARKET, BY REGION, 2024–2029 (USD MILLION)
     10.4 OPTOELECTRONIC DEVICES 
             10.4.1 RISING APPLICATION IN SENSING AND IMAGING TO DRIVE MARKET
                        TABLE 36 OPTOELECTRONIC DEVICES: LASER TECHNOLOGY MARKET, BY REGION, 2020–2023 (USD MILLION)
                        TABLE 37 OPTOELECTRONIC DEVICES: LASER TECHNOLOGY MARKET, BY REGION, 2024–2029 (USD MILLION)
     10.5 OTHER APPLICATIONS 
             TABLE 38 OTHER APPLICATIONS: LASER TECHNOLOGY MARKET, BY REGION, 2020–2023 (USD MILLION)
             TABLE 39 OTHER APPLICATIONS: LASER TECHNOLOGY MARKET, BY REGION, 2024–2029 (USD MILLION)
 
11 LASER TECHNOLOGY MARKET, BY VERTICAL (Page No. - 129)
     11.1 INTRODUCTION 
             FIGURE 46 LASER TECHNOLOGY MARKET, BY VERTICAL
             FIGURE 47 TELECOMMUNICATIONS SEGMENT TO HOLD LARGEST MARKET SHARE DURING FORECAST PERIOD
             TABLE 40 LASER TECHNOLOGY MARKET, BY VERTICAL, 2020–2023 (USD MILLION)
             TABLE 41 LASER TECHNOLOGY MARKET, BY VERTICAL, 2024–2029 (USD MILLION)
     11.2 TELECOMMUNICATIONS 
             11.2.1 GROWING ADOPTION IN FIBER OPTIC COMMUNICATION TO BOOST DEMAND
                        TABLE 42 TELECOMMUNICATIONS: LASER TECHNOLOGY MARKET, BY REGION, 2020–2023 (USD MILLION)
                        TABLE 43 TELECOMMUNICATIONS: LASER TECHNOLOGY MARKET, BY REGION, 2024–2029 (USD MILLION)
     11.3 INDUSTRIAL 
             11.3.1 INTEGRATION OF LASER SYSTEMS WITH ADVANCED BEAM DELIVERY SYSTEMS AND CNC MACHINERY TO OFFER LUCRATIVE GROWTH OPPORTUNITIES FOR PLAYERS
                        TABLE 44 INDUSTRIAL: LASER TECHNOLOGY MARKET, BY REGION, 2020–2023 (USD MILLION)
                        TABLE 45 INDUSTRIAL: LASER TECHNOLOGY MARKET, BY REGION, 2024–2029 (USD MILLION)
     11.4 SEMICONDUCTOR & ELECTRONICS 
             11.4.1 GROWING DEMAND FOR MINIATURIZED SEMICONDUCTOR COMPONENTS TO BOOST DEMAND
                        TABLE 46 SEMICONDUCTOR & ELECTRONICS: LASER TECHNOLOGY MARKET, BY REGION, 2020–2023 (USD MILLION)
                        TABLE 47 SEMICONDUCTOR & ELECTRONICS: LASER TECHNOLOGY MARKET, BY REGION, 2024–2029 (USD MILLION)
             11.4.2 MEMORY CHIPS
             11.4.3 MICROPROCESSORS
             11.4.4 PHOTONIC INTEGRATED CIRCUITS
     11.5 COMMERCIAL 
             11.5.1 GROWING DEMAND FOR ENHANCED SECURITY IN SMART CARDS TO DRIVE MARKET
                        TABLE 48 COMMERCIAL: LASER TECHNOLOGY MARKET, BY REGION, 2020–2023 (USD MILLION)
                        TABLE 49 COMMERCIAL: LASER TECHNOLOGY MARKET, BY REGION, 2024–2029 (USD MILLION)
     11.6 AEROSPACE 
             11.6.1 INCREASED ADOPTION FOR MACHINING AIRCRAFT PARTS TO ACCELERATE MARKET GROWTH
                        TABLE 50 AEROSPACE: LASER TECHNOLOGY MARKET, BY REGION, 2020–2023 (USD MILLION)
                        TABLE 51 AEROSPACE: LASER TECHNOLOGY MARKET, BY REGION, 2024–2029 (USD MILLION)
     11.7 AUTOMOTIVE 
             11.7.1 RISING DEMAND FOR SEAM WELDING AND HIGH-STRENGTH STEEL CUTTING IN AUTOMOTIVE INDUSTRY TO FOSTER SEGMENTAL GROWTH
                        TABLE 52 AUTOMOTIVE: LASER TECHNOLOGY MARKET, BY REGION, 2020–2023 (USD MILLION)
                        TABLE 53 AUTOMOTIVE: LASER TECHNOLOGY MARKET, BY REGION, 2024–2029 (USD MILLION)
     11.8 MEDICAL 
             11.8.1 INCREASING APPLICATION IN SURGICAL PROCEDURES TO DRIVE DEMAND
                        TABLE 54 MEDICAL: LASER TECHNOLOGY MARKET, BY REGION, 2020–2023 (USD MILLION)
                        TABLE 55 MEDICAL: LASER TECHNOLOGY MARKET, BY REGION, 2024–2029 (USD MILLION)
             11.8.2 LASER VISION CORRECTION
             11.8.3 CONFOCAL MICROSCOPES
             11.8.4 OPTOGENETICS
     11.9 RESEARCH 
             11.9.1 GROWING APPLICATION IN CONFOCAL MICROSCOPY AND TWO-PHOTON MICROSCOPY TO DRIVE MARKET
                        TABLE 56 RESEARCH: LASER TECHNOLOGY MARKET, BY REGION, 2020–2023 (USD MILLION)
                        TABLE 57 RESEARCH: LASER TECHNOLOGY MARKET, BY REGION, 2024–2029 (USD MILLION)
     11.1 OTHER VERTICALS 
             TABLE 58 OTHER VERTICALS: LASER TECHNOLOGY MARKET, BY REGION, 2020–2023 (USD MILLION)
             TABLE 59 OTHER VERTICALS: LASER TECHNOLOGY MARKET, BY REGION, 2024–2029 (USD MILLION)
 
12 LASER TECHNOLOGY MARKET, BY REGION (Page No. - 146)
     12.1 INTRODUCTION 
             FIGURE 48 INDIA TO EXHIBIT HIGHEST CAGR IN GLOBAL LASER TECHNOLOGY MARKET DURING FORECAST PERIOD
             TABLE 60 LASER TECHNOLOGY MARKET, BY REGION, 2020–2023 (USD MILLION)
             TABLE 61 LASER TECHNOLOGY MARKET, BY REGION, 2024–2029 (USD MILLION)
     12.2 NORTH AMERICA 
             12.2.1 IMPACT OF RECESSION ON LASER TECHNOLOGY MARKET IN NORTH AMERICA
                        FIGURE 49 NORTH AMERICA: LASER TECHNOLOGY MARKET SNAPSHOT
                        TABLE 62 NORTH AMERICA: LASER TECHNOLOGY MARKET, BY VERTICAL, 2020–2023 (USD MILLION)
                        TABLE 63 NORTH AMERICA: LASER TECHNOLOGY MARKET, BY VERTICAL, 2024–2029 (USD MILLION)
                        TABLE 64 NORTH AMERICA: LASER TECHNOLOGY MARKET, BY TYPE, 2020–2023 (USD MILLION)
                        TABLE 65 NORTH AMERICA: LASER TECHNOLOGY MARKET, BY TYPE, 2024–2029 (USD MILLION)
                        TABLE 66 NORTH AMERICA: LASER TECHNOLOGY MARKET, BY APPLICATION, 2020–2023 (USD MILLION)
                        TABLE 67 NORTH AMERICA: LASER TECHNOLOGY MARKET, BY APPLICATION, 2024–2029 (USD MILLION)
                        TABLE 68 NORTH AMERICA: LASER TECHNOLOGY MARKET, BY COUNTRY, 2020–2023 (USD MILLION)
                        TABLE 69 NORTH AMERICA: LASER TECHNOLOGY MARKET, BY COUNTRY, 2024–2029 (USD MILLION)
             12.2.2 US
                        12.2.2.1 Growing demand for miniature laser processing devices in healthcare industry to drive market
             12.2.3 CANADA
                        12.2.3.1 Government-led initiatives to develop, produce, and sell EVs to boost demand
             12.2.4 MEXICO
                        12.2.4.1 Rising adoption in automobile, aerospace, and electronics to accelerate demand
     12.3 EUROPE 
             12.3.1 IMPACT OF RECESSION ON LASER TECHNOLOGY MARKET IN EUROPE
                        FIGURE 50 EUROPE: LASER TECHNOLOGY MARKET SNAPSHOT
                        TABLE 70 EUROPE: LASER TECHNOLOGY MARKET, BY VERTICAL, 2020–2023 (USD MILLION)
                        TABLE 71 EUROPE: LASER TECHNOLOGY MARKET, BY VERTICAL, 2024–2029 (USD MILLION)
                        TABLE 72 EUROPE: LASER TECHNOLOGY MARKET, BY TYPE, 2020–2023 (USD MILLION)
                        TABLE 73 EUROPE: LASER TECHNOLOGY MARKET, BY TYPE, 2024–2029 (USD MILLION)
                        TABLE 74 EUROPE: LASER TECHNOLOGY MARKET, BY APPLICATION, 2020–2023 (USD MILLION)
                        TABLE 75 EUROPE: LASER TECHNOLOGY MARKET, BY APPLICATION, 2024–2029 (USD MILLION)
                        TABLE 76 EUROPE: LASER TECHNOLOGY MARKET, BY COUNTRY, 2020–2023 (USD MILLION)
                        TABLE 77 EUROPE: LASER TECHNOLOGY MARKET, BY COUNTRY, 2024–2029 (USD MILLION)
             12.3.2 GERMANY
                        12.3.2.1 Rising use in minimally invasive surgical procedures to drive market
             12.3.3 FRANCE
                        12.3.3.1 Increasing demand in automotive, telecommunications, and healthcare verticals to fuel market growth
             12.3.4 UK
                        12.3.4.1 Rising emphasis on reducing greenhouse gas emissions to fuel market growth
             12.3.5 REST OF EUROPE
     12.4 ASIA PACIFIC 
             12.4.1 IMPACT OF RECESSION ON LASER TECHNOLOGY MARKET IN ASIA PACIFIC
                        FIGURE 51 ASIA PACIFIC: LASER TECHNOLOGY MARKET SNAPSHOT
                        TABLE 78 ASIA PACIFIC: LASER TECHNOLOGY MARKET, BY VERTICAL, 2020–2023 (USD MILLION)
                        TABLE 79 ASIA PACIFIC: LASER TECHNOLOGY MARKET, BY VERTICAL, 2024–2029 (USD MILLION)
                        TABLE 80 ASIA PACIFIC: LASER TECHNOLOGY MARKET, BY TYPE, 2020–2023 (USD MILLION)
                        TABLE 81 ASIA PACIFIC: LASER TECHNOLOGY MARKET, BY TYPE, 2024–2029 (USD MILLION)
                        TABLE 82 ASIA PACIFIC: LASER TECHNOLOGY MARKET, BY APPLICATION, 2020–2023 (USD MILLION)
                        TABLE 83 ASIA PACIFIC: LASER TECHNOLOGY MARKET, BY APPLICATION, 2024–2029 (USD MILLION)
                        TABLE 84 ASIA PACIFIC: LASER TECHNOLOGY MARKET, BY COUNTRY, 2020–2023 (USD MILLION)
                        TABLE 85 ASIA PACIFIC: LASER TECHNOLOGY MARKET, BY COUNTRY, 2024–2029 (USD MILLION)
             12.4.2 CHINA
                        12.4.2.1 Growing use in semiconductor chip manufacturing processes to propel market growth
             12.4.3 JAPAN
                        12.4.3.1 Presence of prominent automobile and electronic companies to drive market
             12.4.4 INDIA
                        12.4.4.1 Government-led projects to boost domestic manufacturing to fuel market growth
             12.4.5 SOUTH KOREA
                        12.4.5.1 Consumer electronics and automotive industries to offer lucrative growth opportunities for market players
             12.4.6 REST OF ASIA PACIFIC
     12.5 ROW 
             12.5.1 IMPACT OF RECESSION ON LASER TECHNOLOGY MARKET IN ROW
                        TABLE 86 ROW: LASER TECHNOLOGY MARKET, BY VERTICAL, 2020–2023 (USD MILLION)
                        TABLE 87 ROW: LASER TECHNOLOGY MARKET, BY VERTICAL, 2024–2029 (USD MILLION)
                        TABLE 88 ROW: LASER TECHNOLOGY MARKET, BY TYPE, 2020–2023 (USD MILLION)
                        TABLE 89 ROW: LASER TECHNOLOGY MARKET, BY TYPE, 2024–2029 (USD MILLION)
                        TABLE 90 ROW: LASER TECHNOLOGY MARKET, BY APPLICATION, 2020–2023 (USD MILLION)
                        TABLE 91 ROW: LASER TECHNOLOGY MARKET, BY APPLICATION, 2024–2029 (USD MILLION)
                        TABLE 92 ROW: LASER TECHNOLOGY MARKET, BY REGION, 2020–2023 (USD MILLION)
                        TABLE 93 ROW: LASER TECHNOLOGY MARKET, BY REGION, 2024–2029 (USD MILLION)
             12.5.2 SOUTH AMERICA
                        12.5.2.1 Investments in laser technology and infrastructure to drive market
             12.5.3 GCC COUNTRIES
                        12.5.3.1 Growing demand for light weight cars to drive market
             12.5.4 AFRICA & REST OF MIDDLE EAST
                        12.5.4.1 Increasing use of EVs to offer lucrative growth opportunities for market players
 
13 COMPETITIVE LANDSCAPE (Page No. - 172)
     13.1 OVERVIEW 
     13.2 KEY PLAYER STRATEGIES/RIGHT TO WIN, 2022–2024 
             TABLE 94 OVERVIEW OF STRATEGIES ADOPTED BY KEY PLAYERS, 2022–2024
     13.3 REVENUE ANALYSIS OF TOP FIVE PLAYERS, 2018–2022 
             FIGURE 52 FIVE-YEAR REVENUE ANALYSIS OF TOP FIVE PLAYERS, 2018–2022
     13.4 LASER TECHNOLOGY MARKET SHARE ANALYSIS, 2023 
             TABLE 95 LASER TECHNOLOGY MARKET: DEGREE OF COMPETITION, 2023
             FIGURE 53 LASER TECHNOLOGY MARKET SHARE ANALYSIS, 2023
     13.5 COMPANY VALUATION AND FINANCIAL METRICS 
             FIGURE 54 LASER TECHNOLOGY MARKET: COMPANY VALUATION
             FIGURE 55 LASER TECHNOLOGY MARKET: FINANCIAL METRICS
     13.6 BRAND/PRODUCT COMPARISON 
             FIGURE 56 BRAND/PRODUCT COMPARISON
     13.7 COMPANY EVALUATION MATRIX: KEY PLAYERS, 2023 
             13.7.1 STARS
             13.7.2 EMERGING LEADERS
             13.7.3 PERVASIVE PLAYERS
             13.7.4 PARTICIPANTS
                        FIGURE 57 LASER TECHNOLOGY MARKET: COMPANY EVALUATION MATRIX (KEY PLAYERS), 2023
             13.7.5 COMPANY FOOTPRINT: KEY PLAYERS, 2023
                        13.7.5.1 Overall company footprint
                                     FIGURE 58 LASER TECHNOLOGY MARKET: COMPANY FOOTPRINT
                        13.7.5.2 Laser type footprint
                                     TABLE 96 LASER TECHNOLOGY MARKET: LASER TYPE FOOTPRINT
                        13.7.5.3 Application footprint
                                     TABLE 97 LASER TECHNOLOGY MARKET: APPLICATION FOOTPRINT
                        13.7.5.4 Vertical footprint
                                     TABLE 98 LASER TECHNOLOGY MARKET: VERTICAL FOOTPRINT
                        13.7.5.5 Region footprint
                                     TABLE 99 LASER TECHNOLOGY MARKET: REGION FOOTPRINT
     13.8 COMPANY EVALUATION MATRIX (STARTUPS/SMES), 2023 
             13.8.1 PROGRESSIVE COMPANIES
             13.8.2 RESPONSIVE COMPANIES
             13.8.3 DYNAMIC COMPANIES
             13.8.4 STARTING BLOCKS
                        FIGURE 59 LASER TECHNOLOGY MARKET: COMPANY EVALUATION MATRIX (STARTUPS/SMES), 2023
             13.8.5 COMPETITIVE BENCHMARKING: STARTUPS/SMES, 2023
                        13.8.5.1 List of key startups/SMEs
                                     TABLE 100 LASER TECHNOLOGY MARKET: LIST OF KEY STARTUPS/SMES
                        13.8.5.2 Competitive benchmarking of key startups/SMEs
                                     TABLE 101 LASER TECHNOLOGY MARKET: COMPETITIVE BENCHMARKING OF KEY STARTUPS/SMES
     13.9 COMPETITIVE SCENARIOS AND TRENDS 
             13.9.1 PRODUCT LAUNCHES
                        TABLE 102 LASER TECHNOLOGY MARKET: PRODUCT LAUNCHES, SEPTEMBER 2021–JANUARY 2024
             13.9.2 DEALS
                        TABLE 103 LASER TECHNOLOGY MARKET: DEALS, SEPTEMBER 2021–JANUARY 2024
 
14 COMPANY PROFILES (Page No. - 191)
(Business Overview, Products/Solutions/Services Offered, Recent Developments, MnM view (Key strengths/Right to win, Strategic choices made, Weakness/competitive threats)*  
     14.1 KEY PLAYERS 
             14.1.1 COHERENT CORP.
                        TABLE 104 COHERENT CORP.: COMPANY OVERVIEW
                        FIGURE 60 COHERENT CORP.: COMPANY SNAPSHOT
                        TABLE 105 COHERENT CORP.: PRODUCTS/SOLUTIONS/SERVICES OFFERED
                        TABLE 106 COHERENT CORP.: PRODUCT LAUNCHES
             14.1.2 TRUMPF
                        TABLE 107 TRUMPF: COMPANY OVERVIEW
                        FIGURE 61 TRUMPF: COMPANY SNAPSHOT
                        TABLE 108 TRUMPF: PRODUCTS/SOLUTIONS/SERVICES OFFERED
                        TABLE 109 TRUMPF: PRODUCT LAUNCHES
             14.1.3 HAN'S LASER TECHNOLOGY INDUSTRY GROUP CO., LTD
                        TABLE 110 HAN'S LASER TECHNOLOGY INDUSTRY GROUP CO., LTD: COMPANY OVERVIEW
                        FIGURE 62 HAN'S LASER TECHNOLOGY INDUSTRY GROUP CO., LTD: COMPANY SNAPSHOT
                        TABLE 111 HAN'S LASER TECHNOLOGY INDUSTRY GROUP CO., LTD: PRODUCTS/SOLUTIONS/SERVICES OFFERED
                        TABLE 112 HAN'S LASER TECHNOLOGY INDUSTRY GROUP CO., LTD: PRODUCT LAUNCHES
                        TABLE 113 HAN'S LASER TECHNOLOGY INDUSTRY GROUP CO., LTD: DEALS
             14.1.4 IPG PHOTONICS CORPORATION
                        TABLE 114 IPG PHOTONICS CORPORATION: COMPANY OVERVIEW
                        FIGURE 63 IPG PHOTONICS CORPORATION: COMPANY SNAPSHOT
                        TABLE 115 IPG PHOTONICS CORPORATION: PRODUCTS/SOLUTIONS/SERVICES OFFERED
                        TABLE 116 IPG PHOTONICS CORPORATION: PRODUCT LAUNCHES
                        14.1.4.3.2 Deals
                        TABLE 117 IPG PHOTONICS CORPORATION: DEALS
             14.1.5 JENOPTIK AG
                        TABLE 118 JENOPTIK AG: COMPANY OVERVIEW
                        FIGURE 64 JENOPTIK AG: COMPANY SNAPSHOT
                        TABLE 119 JENOPTIK AG: PRODUCTS/SOLUTIONS/SERVICES OFFERED
                        TABLE 120 JENOPTIK AG: PRODUCT LAUNCHES
                        TABLE 121 JENOPTIK AG: DEALS
                        TABLE 122 JENOPTIK: OTHERS
             14.1.6 600 GROUP PLC
                        TABLE 123 600 GROUP PLC: COMPANY OVERVIEW
                        FIGURE 65 600 GROUP PLC: COMPANY SNAPSHOT
                        TABLE 124 600 GROUP PLC: PRODUCTS/SOLUTIONS/SERVICES OFFERED
             14.1.7 BYSTRONIC GROUP
                        TABLE 125 BYSTRONIC GROUP: COMPANY OVERVIEW
                        FIGURE 66 BYSTRONIC GROUP: COMPANY SNAPSHOT
                        TABLE 126 BYSTRONIC GROUP: PRODUCT/SOLUTIONS/SERVICES OFFERED
                        TABLE 127 BYSTRONIC GROUP: PRODUCT LAUNCHES
             14.1.8 EPILOG LASER
                        TABLE 128 EPILOG LASER: COMPANY OVERVIEW
                        TABLE 129 EPILOG LASER: PRODUCTS/SOLUTIONS/SERVICES OFFERED
                        TABLE 130 EPILOG LASER: PRODUCT LAUNCHES
                        TABLE 131 EPILOG LASER: EXPANSIONS
             14.1.9 EUROLASER GMBH
                        TABLE 132 EUROLASER GMBH: COMPANY OVERVIEW
                        TABLE 133 EUROLASER GMBH: PRODUCTS/SOLUTIONS/SERVICES OFFERED
             14.1.10 GRAVOTECH MARKING
                        TABLE 134 GRAVOTECH MARKING: COMPANY OVERVIEW
                        TABLE 135 GRAVOTECH MARKING: PRODUCTS/SOLUTIONS/SERVICES OFFERED
                        TABLE 136 GRAVOTECH MARKING: PRODUCT LAUNCHES
             14.1.11 LASERSTAR TECHNOLOGIES CORPORATION
                        TABLE 137 LASERSTAR TECHNOLOGIES CORPORATION: COMPANY OVERVIEW
                        TABLE 138 LASERSTAR TECHNOLOGIES CORPORATION: PRODUCTS/SOLUTIONS/SERVICES OFFERED
             14.1.12 LUMIBIRD
                        TABLE 139 LUMIBIRD: COMPANY OVERVIEW
                        FIGURE 67 LUMIBIRD: COMPANY SNAPSHOT
                        TABLE 140 LUMIBIRD: PRODUCTS/SOLUTIONS/SERVICES OFFERED
                        TABLE 141 LUMIBIRD: PRODUCT LAUNCHES
                        TABLE 142 LUMIBIRD: DEALS
             14.1.13 LUMENTUM OPERATIONS LLC
                        TABLE 143 LUMENTUM OPERATIONS LLC: COMPANY OVERVIEW
                        FIGURE 68 LUMENTUM OPERATIONS LLC: COMPANY SNAPSHOT
                        TABLE 144 LUMENTUM OPERATIONS LLC: PRODUCTS/SOLUTIONS/SERVICES OFFERED
                        TABLE 145 LUMENTUM OPERATIONS LLC: PRODUCT LAUNCHES
                        TABLE 146 LUMENTUM OPERATION LLC: DEALS
                        TABLE 147 LUMENTUM OPERATION LLC: OTHERS
             14.1.14 MKS INSTRUMENTS
                        TABLE 148 MKS INSTRUMENTS: COMPANY OVERVIEW
                        FIGURE 69 MKS INSTRUMENTS: COMPANY SNAPSHOT
                        TABLE 149 MKS INSTRUMENTS: PRODUCTS/SOLUTIONS/SERVICES OFFERED
                        TABLE 150 MKS INSTRUMENTS: PRODUCT LAUNCHES
                        TABLE 151 MKS INSTRUMENTS: DEALS
             14.1.15 NOVANTA INC.
                        TABLE 152 NOVANTA INC.: COMPANY OVERVIEW
                        FIGURE 70 NOVANTA INC.: COMPANY SNAPSHOT
                        TABLE 153 NOVANTA INC.: PRODUCTS/SOLUTIONS/SERVICES OFFERED
                        TABLE 154 NOVANTA INC.: PRODUCT LAUNCHES
                        TABLE 155 NOVANTA INC.: DEALS
     14.2 OTHER PLAYERS 
             14.2.1 ALPHALAS GMBH
             14.2.2 APPLIED LASER TECHNOLOGY, INC
             14.2.3 ARIMA LASERS CORP.
             14.2.4 FOCUSLIGHT TECHNOLOGIES INC.
             14.2.5 INNO LASER TECHNOLOGY CO., LTD.
             14.2.6 NKT PHOTONICS A/S
             14.2.7 PHOTONICS INDUSTRIES INTERNATIONAL.INC.
             14.2.8 SFX STORE
             14.2.9 TOPTICA PHOTONICS AG
             14.2.10 VESCENT
*Details on Business Overview, Products/Solutions/Services Offered, Recent Developments, MnM view (Key strengths/Right to win, Strategic choices made, Weakness/competitive threats)* might not be captured in case of unlisted companies.  
 
15 ADJACENT MARKET (Page No. - 246)
     15.1 INTRODUCTION 
     15.2 FIBER OPTICS MARKET 
                        FIGURE 71 GLASSES SEGMENT TO REGISTER HIGHER CAGR DURING FORECAST PERIOD
                        TABLE 156 FIBER OPTICS MARKET, BY FIBER TYPE, 2018–2021 (USD MILLION)
                        TABLE 157 FIBER OPTICS MARKET, BY FIBER TYPE, 2022–2027 (USD MILLION)
                        TABLE 158 FIBER OPTICS MARKET, BY FIBER TYPE, 2018–2021 (MILLION FIBER KILOMETER)
                        TABLE 159 FIBER OPTICS MARKET, BY FIBER TYPE, 2022–2027 (MILLION FIBER KILOMETER)
     15.3 GLASSES 
             15.3.1 LOW INTRINSIC ABSORPTION PROPERTIES OF GLASSES TO BOOST DEMAND
                        FIGURE 72 ASIA PACIFIC TO REGISTER HIGHEST CAGR DURING FORECAST PERIOD
                        TABLE 160 GLASSES: FIBER OPTICS MARKET, BY REGION, 2018–2021 (USD MILLION)
                        TABLE 161 GLASSES: FIBER OPTICS MARKET, BY REGION, 2022–2027 (USD MILLION)
                        TABLE 162 GLASSES: FIBER OPTICS MARKET, BY REGION, 2018–2021 (MILLION FIBER KILOMETER)
                        TABLE 163 GLASSES: FIBER OPTICS MARKET, BY REGION, 2022–2027 (MILLION FIBER KILOMETER)
     15.4 PLASTICS 
             15.4.1 SUITABILITY FOR INDUSTRIAL AND AUTOMOTIVE LIGHTING APPLICATIONS TO DRIVE MARKET
                        FIGURE 73 ASIA PACIFIC TO DOMINATE PLASTIC FIBER OPTICS MARKET FROM 2024 TO 2029
                        TABLE 164 PLASTICS: FIBER OPTICS MARKET, BY REGION, 2018–2021 (USD MILLION)
                        TABLE 165 PLASTICS: FIBER OPTICS MARKET, BY REGION, 2022–2027 (USD MILLION)
                        TABLE 166 PLASTICS: FIBER OPTICS MARKET, BY REGION, 2018–2021 (MILLION FIBER KILOMETER)
                        TABLE 167 PLASTICS: FIBER OPTICS MARKET, BY REGION, 2022–2027 (MILLION FIBER KILOMETER)
 
16 APPENDIX (Page No. - 253)
     16.1 INSIGHTS FROM INDUSTRY EXPERTS 
     16.2 DISCUSSION GUIDE 
     16.3 KNOWLEDGESTORE: MARKETSANDMARKETS’ SUBSCRIPTION PORTAL 
     16.4 CUSTOMIZATION OPTIONS 
     16.5 RELATED REPORTS 
     16.6 AUTHOR DETAILS 
 

The study involves four major activities that estimate the size of the laser technology market. Exhaustive secondary research was conducted to collect information related to the market. Following this was validating these findings, assumptions, and sizing with the industry experts across the value chain through primary research. Both top-down and bottom-up approaches were employed to estimate the overall size of the laser technology market. Subsequently, market breakdown and data triangulation procedures were used to determine the extent of different segments and subsegments of the market.   

Secondary Research

Secondary sources in this research study include corporate filings (such as annual reports, investor presentations, and financial statements); trade, business, and professional associations; white papers, certified publications, articles from recognized authors; directories; and databases. The secondary data were collected and analyzed to estimate the overall market size, further validated by primary research. The relevant data is collected from various secondary sources, it is analyzed to extract insights and information relevant to the market research objectives. This analysis has involved summarizing the data, identifying trends, and drawing conclusions based on the available information.

Primary Research

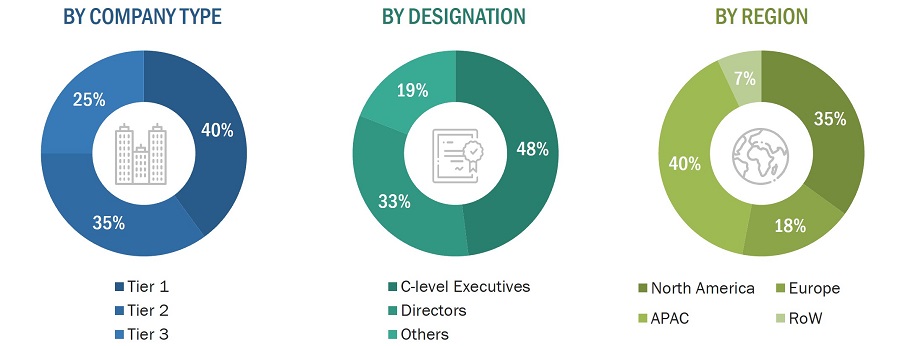
In the primary research process, numerous sources from both the supply and demand sides were interviewed to obtain qualitative and quantitative information about this report. The primary sources from the supply side included various industry experts such as Chief X Officers (CXOs), Vice Presidents (VPs), and Directors from business development, marketing, product development/innovation teams, and related key executives from laser technology providers, (such as Coherent, Trumpf, Han’s Laser Technology Industry Group Co., Ltd, IPG Photonics and Jenoptik AG) research organizations, distributors, professional and managed service providers, industry associations, and key opinion leaders. Approximately 25% of the primary interviews were conducted with the demand side and 75% with the supply side. These data were collected mainly through questionnaires, emails, and telephonic interviews, accounting for 80% of the primary interviews.
Laser Technology Market
 Size, and Share

To know about the assumptions considered for the study, download the pdf brochure

Market Size Estimation

In the market engineering process, both top-down and bottom-up approaches were implemented, along with several data triangulation methods, to estimate and validate the size of the laser technology market and other dependent submarkets listed in this report.

  • The key players in the industry and markets were identified through extensive secondary research.
  • Both the supply chain of the industry and the market size, in terms of value, were determined through primary and secondary research.
  • All percentage shares, splits, and breakdowns were determined using secondary sources and verified through primary sources.

Market Size Estimation Methodology-Bottom-up Approach

Laser Technology Market
 Size, and Bottom-up Approach

Market Size Estimation Methodology-Top-Down Approach

Laser Technology Market
 Size, and Top-Down Approach

Data Triangulation

After estimating the overall market size, the total market was split into several segments. The market breakdown and data triangulation procedures were employed wherever applicable to complete the overall market engineering process and gauge exact statistics for all segments. The data were triangulated by studying various factors and trends from both the demand and supply sides. The market was also validated using both top-down and bottom-up approaches.

Market Definition

Laser stands for light amplification by stimulated emission of radiation (LASER). Laser technology-based devices generate a beam of light, which is coherent, monochromatic, and aligned. They generate light through optical amplification based on the stimulated emission of electromagnetic radiation. The wavelength of laser light is purer compared to other light sources. Unlike other light sources, all the photons that develop the laser beam have a fixed-phase relationship. The light beam generated from a laser source has low divergence. Laser technology-based systems find applications in optical communication, cutting, drilling, printing, and marking and engraving. The verticals that use laser technology include commercial, telecommunications, research, aerospace & defense, healthcare, automotive, semiconductor & electronics, industrial, and others (oil & gas, iron & steel, tobacco, glass, wood, retail, and plastics).

Stakeholders

  • End users
  • Government bodies, venture capitalists, and private equity firms
  • Laser technology manufacturers
  • Laser technology distributors
  • Laser technology industry associations
  • Professional service/solution providers
  • Research institutions and organizations
  • Standards organizations and regulatory authorities related to the laser technology market
  • System integrators
  • Technology consultants

The main objectives of this study are as follows:

  • To define, describe, and project the size of the global laser technology market, in terms of value, segmented based on laser type, application, product, vertical and region
  • To forecast the market size for various segments with respect to four main regions—North America, Europe, Asia Pacific, and Rest of the World (RoW)s
  • To provide detailed information regarding the major factors (drivers, restraints, opportunities, and industry-specific challenges) influencing the growth of the market
  • To analyze the micro markets with respect to individual growth trends, prospects, and contributions to the total market
  • To profile the key market players, and comprehensively analyze their market ranking and core competencies.
  • To analyze competitive developments, such as joint ventures, mergers & acquisitions, product launches, and research & development (R&D) activities, in the laser technology market
  • To provide the leadership mapping based on company profiles and key player strategies such as product launches and development, collaborations, expansions, and acquisitions
  • To analyze the opportunities in the market for stakeholders and provide a detailed competitive landscape of the market
  • To provide ecosystem analysis, case study analysis, patent analysis, pricing analysis, Porter’s five forces analysis, key stakeholders & buying criteria, key conferences and events, and regulatory bodies, government agencies, and regulations pertaining to the market under study

Available Customizations:

With the given market data, MarketsandMarkets offers customizations according to the specific requirements of companies. The following customization options are available for the report:

Country-wise Information:

  • Analysis for additional countries (up to five)

Company Information:

  • Detailed analysis and profiling of different market players (up to five)
Custom Market Research Services

We will customize the research for you, in case the report listed above does not meet with your exact requirements. Our custom research will comprehensively cover the business information you require to help you arrive at strategic and profitable business decisions.

Request Customization

Instant Answers with GPT - Ask Now!

Ask real questions. Get complete answers !
Report Code
SE 2726
Published ON
Apr, 2024
Choose License Type
BUY NOW
  • SHARE
X
Request Customization
Speak to Analyst
Speak to Analyst
OR FACE-TO-FACE MEETING
PERSONALIZE THIS RESEARCH
  • Triangulate with your Own Data
  • Get Data as per your Format and Definition
  • Gain a Deeper Dive on a Specific Application, Geography, Customer or Competitor
  • Any level of Personalization
REQUEST A FREE CUSTOMIZATION
LET US HELP YOU!
  • What are the Known and Unknown Adjacencies Impacting the Laser Technology Market
  • What will your New Revenue Sources be?
  • Who will be your Top Customer; what will make them switch?
  • Defend your Market Share or Win Competitors
  • Get a Scorecard for Target Partners
CUSTOMIZED WORKSHOP REQUEST
+1-888-600-6441
  • Call Us
  • +1-888-600-6441 (Corporate office hours)
  • +1-888-600-6441 (US/Can toll free)
  • +44-800-368-9399 (UK office hours)
CONNECT WITH US
ABOUT TRUST ONLINE
©2024 MarketsandMarkets Research Private Ltd. All rights reserved
DMCA.com Protection Status Website Feedback