Lighting as a Service Market by End-User (Commercial, Municipal, and Industrial), Installation (Indoor, and Outdoor), Component (Luminaires, Software & Communication Systems, and Maintenance Services), and Region - Global Forecast to 2021


[146 Pages] The global lighting as a service market was valued at USD 66.2 Million in 2015, and is expected to grow at a CAGR of 46.3% from 2016 to 2021. Financial benefits such as instant return on investment without any upfront capital cost and government policies and regulations for adoption of energy efficient lighting systems are major factors driving the lighting as a service.
The years considered for the study are as follows:
- Historical Year � 2014
- Base Year � 2015
- Estimated Year � 2016
- Projected Year � 2021
- Forecast Period � 2016 to 2021
2015 has been considered as the base year for company profiles. Whenever information was unavailable for the base year, the prior year has been considered.
Objectives of the Study
- To define, describe, and forecast the global market by end-user, installation, component, and region
- To provide detailed information regarding major factors influencing the growth of the market (drivers, restraints, opportunities, industry-specific challenges, and burning issues related to the market)
- To strategically analyze the market with respect to individual growth trends, future prospects, and contribution of each segment to the market
- To analyze opportunities in the market for stakeholders and provide details of a competitive landscape for market leaders
- To strategically profile key players and comprehensively analyze their market shares and core competencies
- To track and analyze competitive developments such as contracts and agreements, expansions, new product developments, and mergers & acquisitions in the market
Research Methodology
This research study has involved the use of extensive secondary sources, directories, and databases such as Hoovers, Bloomberg Businessweek, Factiva, and OneSource to identify and collect information useful for a technical, market-oriented, and commercial study of the global market. Primary sources are mainly industry experts from core and related industries, preferred manufacturers, service providers, technology developers, standard and certification organizations of companies, and organizations related to all the segments of this industry�s value chain. The points given below explain the research methodology.
- Study of annual revenue and market developments of major players providing lighting as a service solutions and LED manufacturers
- Assessment of future trends and growth of end-user industries
- Assessment of market with respect to the type of installation
- Analysis of major policies/regulations for reducing carbon dioxide emissions and emission standards
- Study of market trends in various regions/countries supported by installation of LED and smart lighting in different industries
- Study of contracts and developments related to market for key players across different regions
- Finalization of overall market sizes by triangulating the supply-side data, which includes service providers, supply chain, LED manufacturers and annual revenues of companies providing market across the globe
After arriving at the overall market size, the total market has been split into several segments and subsegments. The figure given below shows the breakdown of primaries on the basis of company type, designation, and region, conducted during the research study.
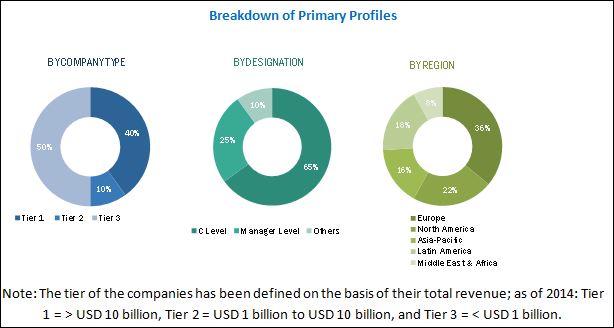
To know about the assumptions considered for the study, download the pdf brochure
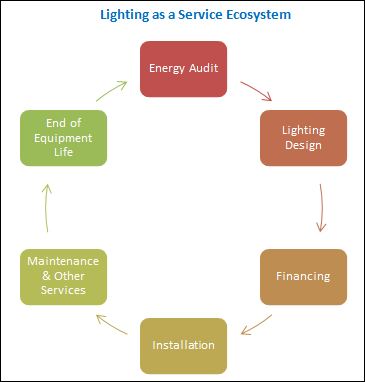
Market Ecosystem:
The life cycle of the global lighting as a service market starts with energy auditing. In an energy audit the existing lighting, electricity consumption, existing intensity and needs of the customer are assessed and an efficient lighting system is provided. After auditing, lighting components such as LED chips, circuit boards, casings, and others are selected and installed according to the customer�s need. The last step is lighting maintenance, in which a customer�s lighting consumption is analyzed and off- site & on-site maintenance is provided.
Target Audience:
The report�s target audience includes:
- Lighting manufacturers
- Lighting as a Service providers
- Research institutes and organizations
- Lighting control manufacturers
- Lighting industry associations
- Technology standards organizations, alliances, and associations
- Government bodies, and private Equity firms
- Institutional investors
Get online access to the report on the World's First Market Intelligence Cloud
Request Sample Scope of the Report
:

- By End-User
- Commercial
- Industrial
- Municipal
- By Components
- Luminaries & control equipment
- Software�s & communication systems
- Maintenance & Other services
- By Installation
- Indoor
- Outdoor
- By Region
- North America
- Europe
- Asia-Pacific
- Latin America
- Middle East & Africa
Available Customizations:
With the given market data, MarketsandMarkets offers customizations as per the client�s specific needs. The following customization options are available for this report:
Company Information
Detailed analysis and profiling of additional market players (Up to 5)
The global lighting as a service market is projected to grow at a CAGR of 46.3% from 2016 to 2021, to reach a market size of USD 638.7 Million by 2021. This growth is attributed to increasing demand for energy efficient lighting systems, zero capital cost requirement and growing convergence of Internet of Things (IoT) in lighting systems to reduce energy consumption across the globe.
The report segments the lighting as a service based on end-user industry into commercial, municipal, and industrial. The commercial segment dominated the end-user segment in 2015 and is expected to maintain its leading position throughout the forecast period. The municipal segment is projected to lead the market in terms of growth rate during the forecast period.
In terms of installation, the outdoor segment is estimated to constitute the fastest growing segment in the market. The indoor segment held the largest market share in 2015 and is expected to dominate the market during the forecast period. Growing commercial sector in developing countries is the main driver behind the growth of the indoor segment in the lighting as a service.
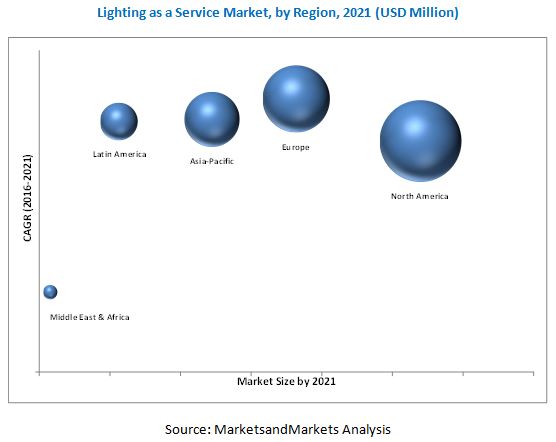
In this report, the lighting as a service has been analyzed with respect to five regions, namely, North America, Europe, Asia-Pacific, Latin America, and the Middle East & Africa. North America is expected to dominate the global market during the forecast period, owing to government support to replace traditional lighting system by energy efficient lighting systems.
The development of smart cities across the globe is expected to drive the growth of the lighting as a service. Key benefits of using lighting as a service to end users include no upfront costs, reduced energy consumption, continuing cost savings, improved lighting experience, no maintenance liability, and the ability to procure add-on functions, and systems such as data collection, inter-device communication and remote management. Low quality LED products flooding the market have resulted in poor performance of the service. This poses a huge challenge for the market.
Some of the leading players in the lighting as a service market include Koninklijke Philips N.V. (Netherlands), General Electric Lighting (U.S.), Zumtobel Group AG (Austria), SIB Lighting (U.S.), Lunera Lighting (U.S.), Igor Inc. (U.S.), Itelecom (Chile), and Cree Inc. (U.S.). Contracts & agreements was the strategy most commonly adopted by the top players in the market, constituting more than one-third of the total share of developments from 2013 to 2016. It was followed by partnerships & collaborations, and investments & expansions.
To speak to our analyst for a discussion on the above findings, click Speak to Analyst
Table of Contents
1 Introduction (Page No. - 15)
1.1 Objectives of the Study
1.2 Market Definition
1.3 Market Scope
1.3.1 Markets Covered
1.3.2 Years Considered for the Study
1.3.3 Currency
1.4 Limitations
1.5 Stakeholders
2 Research Methodology (Page No. - 20)
2.1 Research Data
2.1.1 Secondary Data
2.1.1.1 Key Data From Secondary Sources
2.1.2 Primary Data
2.1.2.1 Key Data From Primary Sources
2.1.2.2 Breakdown of Primary Interviews
2.2 Market Size Estimation
2.3 Market Breakdown & Data Triangulation
2.4 Research Assumptions & Limitations
2.4.1 Assumptions
3 Executive Summary (Page No. - 28)
3.1 Introduction
3.2 Historical Backdrop, Evolution, & Current Scenario
3.3 Future Outlook
3.4 Conclusion
4 Premium Insights (Page No. - 35)
4.1 North America is Expected to Hold the Largest Market Share During the Forecast Period
4.2 Lighting as a Service, By End-User
4.3 Lighting as a Service, By Installation
4.4 Lighting as a Service, By Component
4.5 North America: Lighting as a Service Market
5 Market Overview (Page No. - 39)
5.1 Introduction
5.2 Market Segmentation
5.2.1 By Component
5.2.2 By End-User
5.2.3 By Installation
5.2.4 By Region
5.3 Market Dynamics
5.3.1 Drivers
5.3.1.1 Zero Capital Cost Model & Improved Financial Benefits
5.3.1.2 Government Policies & Regulations for Adoption of Energy-Efficient Lighting Systems
5.3.2 Restraint
5.3.2.1 Lack of Awareness About the Value of A Service Oriented Model of Lighting
5.3.3 Opportunities
5.3.3.1 Convergence of Internet of Things With Lighting Systems
5.3.3.2 Development of Smart Cities
5.3.4 Challenges
5.3.4.1 Low-Quality Led Products Flooding the Market and Their Poor Performance
6 Lighting as a Service Market, By End-User (Page No. - 49)
6.1 Introduction
6.2 Commercial
6.3 Municipal
6.4 Industrial
6.5 Regional Overview
7 Lighting as a Service, By Installation (Page No. - 59)
7.1 Introduction
7.2 Indoor
7.3 Outdoor
7.4 Regional Overview
8 Lighting as a Service, By Component (Page No. - 68)
8.1 Introduction
8.2 Luminaire & Control Equipment
8.3 Software & Communication Systems
8.4 Maintenance & Other Services
8.5 Regional Overview
9 Lighting as a Service, By Region (Page No. - 78)
9.1 Introduction
9.2 North America
9.2.1 U.S.
9.2.2 Canada
9.3 Europe
9.3.1 U.K.
9.3.2 Netherlands
9.3.3 Austria
9.3.4 Belgium
9.3.5 Rest of Europe
9.4 Asia-Pacific
9.4.1 India
9.4.2 Japan
9.4.3 South Korea
9.4.4 Singapore
9.4.5 Rest of Asia-Pacific
9.5 Latin America
9.5.1 Chile
9.5.2 Colombia
9.5.3 Rest of Latin America
9.6 Middle East & Africa
9.6.1 UAE
9.6.2 Rest of the Middle East & Africa
10 Competitive Landscape (Page No. - 112)
10.1 Overview
10.2 Competitive Situation & Trends
10.3 Contracts & Agreements
10.4 Partnerships & Collaborations
10.5 Investments & Expansions
10.6 New Service Launches
11 Company Profiles (Page No. - 119)
11.1 Introduction
11.2 Koninklijke Philips N.V
11.2.1 Business Overview
11.2.2 Services Offered
11.2.3 Developments, 2013�2016
11.2.4 SWOT Analysis
11.2.5 MnM View
11.3 General Electric Lighting
11.3.1 Business Overview
11.3.2 General Electric Lighting: Company Snapshot
11.3.3 Services Offered
11.3.4 Developments, 2013�2016
11.3.5 SWOT Analysis
11.3.6 MnM View
11.4 Zumtobel Group AG
11.4.1 Business Overview
11.4.2 Services Offered
11.4.3 Developments, 2014�2016
11.4.4 SWOT Analysis
11.4.5 MnM View
11.5 SIB Lighting
11.5.1 Business Overview
11.5.2 Services Offered
11.5.3 Developments, 2016
11.6 IGOR Inc.
11.6.1 Business Overview
11.6.2 Products Offered
11.6.3 Developments, 2014
11.7 Lunera Lighting
11.7.1 Business Overview
11.7.2 Services Offered
11.7.3 Developments, 2016
11.8 RCG Lighthouse
11.8.1 Business Overview
11.8.2 Services Offered
11.8.3 Developments, 2015
11.9 Cree, Inc.
11.9.1 Business Overview
11.9.2 Cree, Inc.: Company Snapshot
11.9.3 Products & Services Offered
11.9.4 Developments, 2014�2016
11.10 Itelecom USA
11.10.1 Business Overview
11.10.2 Products & Services Offered
11.10.3 Developments, 2015�2016
11.11 Future Energy Solutions
11.11.1 Business Overview
11.11.2 Products & Services Offered
11.11.3 Developments, 2013�2015
12 Appendix (Page No. - 143)
12.1 Insights of Industry Experts
12.2 Discussion Guide
12.3 Introducing RT: Real Time Market Intelligence
12.4 Available Customizations
12.5 Related Reports
List of Tables (70 Tables)
Table 1 Lighting as a Service Market Size, By End-User, 2014�2021 (USD Million)
Table 2 Commercial: Market Size, By Region, 2014�2021 (USD Million)
Table 3 Municipal: Market Size, By Region, 2014�2021 (USD Million)
Table 4 Industrial: Market Size, By Region, 2014�2021 (USD Million)
Table 5 North America: Market Size, By End-User, 2014�2021 (USD Million)
Table 6 Europe: Market Size, By End-User, 2014�2021 (USD Million)
Table 7 Asia-Pacific: Market Size, By End-User, 2014�2021 (USD Million)
Table 8 Latin America: Market Size, By End-User, 2014�2021 (USD Million)
Table 9 Middle East & Africa: Market Size, By End-User, 2014�2021 (USD Million)
Table 10 Market Size, By Installation, 2014�2021 (USD Million)
Table 11 Indoor: Market Size, By Region, 2014�2021 (USD Million)
Table 12 Outdoor: Market Size, By Region, 2014�2021 (USD Million)
Table 13 North America: Market Size, By Installation, 2014�2021 (USD Million)
Table 14 Europe: Market Size, By Installation, 2014�2021 (USD Million)
Table 15 Asia-Pacific: Market Size, By Installation, 2014�2021 (USD Million)
Table 16 Latin America: Market Size, By Installation, 2014�2021 (USD Million)
Table 17 Middle East & Africa: Market Size, By Installation, 2014�2021 (USD Million)
Table 18 Market Size, By Component, 2014�2021 (USD Million)
Table 19 Luminaire & Control Equipment: Market Size, By Region, 2014�2021 (USD Million)
Table 20 Software & Communication Systems: Market Size, By Region, 2014�2021 (USD Million)
Table 21 Maintenance & Other Services: Market Size, By Region, 2014�2021 (USD Million)
Table 22 North America: Market Size, By Component, 2014�2021 (USD Million)
Table 23 Europe: Market Size, By Component, 2014�2021 (USD Million)
Table 24 Asia-Pacific: Market Size, By Component, 2014�2021 (USD Million)
Table 25 Latin America: Market Size, By Component, 2014�2021 (USD Million)
Table 26 Middle East & Africa: Market Size, By Component, 2014�2021 (USD Million)
Table 27 Market Size, By Region, 2014�2021 (USD Million)
Table 28 North America: Market Size, By Country, 2014�2021 (USD Million)
Table 29 U.S.: Market Size, By End-User, 2014�2021 (USD Million)
Table 30 U.S.: Market Size, By Installation, 2014�2021 (USD Million)
Table 31 Canada: Market Size, By End-User, 2014�2021 (USD Million)
Table 32 Canada: Market Size, By Installation, 2014�2020 (USD Million)
Table 33 Europe: Market Size, By Country, 2014�2021 (USD Million)
Table 34 U.K.: Market Size, By End-User, 2014�2021 (USD Million)
Table 35 U.K.: Market Size, By Installation, 2014�2020 (USD Million)
Table 36 Netherlands: Market Size, By End-User, 2014�2021 (USD Million)
Table 37 Netherlands: Market Size, By Installation, 2014�2021 (USD Million)
Table 38 Austria: Market Size, By End-User, 2014�2021 (USD Million)
Table 39 Austria: Market Size, By Installation, 2014�2021 (USD Million)
Table 40 Belgium: Market Size, By End-User, 2014�2021 (USD Million)
Table 41 Belgium: Market Size, By Installation, 2014�2021 (USD Million)
Table 42 Rest of Europe: Market Size, By End-User, 2014�2021 (USD Million)
Table 43 Rest of Europe: Market Size, By Installation, 2014�2021 (USD Million)
Table 44 Asia-Pacific: Market Size, By Country, 2014�2020 (USD Million)
Table 45 India: Market Size, By End-User, 2014�2021 (USD Million)
Table 46 India: Market Size, By Installation, 2014�2021 (USD Million)
Table 47 Japan: Market Size, By End-User, 2014�2021 (USD Million)
Table 48 Japan: Market Size, By Installation, 2014�2021 (USD Million)
Table 49 South Korea: Market Size, By End-User, 2014�2021 (USD Million)
Table 50 South Korea: Market Size, By Installation, 2014�2021 (USD Million)
Table 51 Singapore: Market Size, By End-User, 2014�2021 (USD Million)
Table 52 Singapore: Market Size, By Installation, 2014�2021 (USD Million)
Table 53 Rest Asia-Pacific: Market Size, By End-User, 2014�2021 (USD Million)
Table 54 Rest of Asia-Pacific: Market Size, By Installation, 2014�2021 (USD Million)
Table 55 Latin America: Market Size, By Country, 2014�2021 (USD Million)
Table 56 Chile: Market Size, By End-User, 2014�2021 (USD Million)
Table 57 Chile: Market Size, By Installation, 2014�2021 (USD Million)
Table 58 Colombia: Market Size, By End-User, 2014�2021 (USD Million)
Table 59 Colombia: Market Size, By Installation, 2014�2021 (USD Million)
Table 60 Rest of Latin America: Market Size, By End-User, 2014�2021 (USD Million)
Table 61 Rest of Latin America: Market Size, By Installation, 2014�2021 (USD Million)
Table 62 Middle East & Africa: Market Size, By Country, 2014�2021 (USD Million)
Table 63 UAE: Lighting as a Service By Market Size, End-User, 2014�2021 (USD Million)
Table 64 UAE: Lighting as a Service By Market Size, Installation, 2014�2021 (USD Million)
Table 65 Rest of Middle East & Africa: Market Size, By End-User, 2014�2021 (USD Million)
Table 66 Rest of the Middle East & Africa: Market Size, By Installation, 2014�2021 (USD Million)
Table 67 Contracts & Agreements, 2015�2016
Table 68 Partnerships & Collaborations, 2014�2016
Table 69 Investments & Expansions, 2013�2015
Table 70 New Service Launches, 2014�2016
List of Figures (50 Figures)
Figure 1 LaaS: Market Segmentation
Figure 2 Lighting as a Service: Country-Wise Scope
Figure 3 Lighting as a Service: Research Design
Figure 4 Breakdown of Primary Interviews: By Company Type, Designation, & Region
Figure 5 Market Size Estimation Methodology: Top-Down Approach
Figure 6 Market Size Estimation Methodology: Bottom-Up Approach
Figure 7 Data Triangulation Methodology
Figure 8 Lighting as a Service: the Business Model
Figure 9 North America Occupied the Largest Market Share (Value), in 2015
Figure 10 Market Share (Value), By Installation, 2015
Figure 11 Commercial Segment is Expected to Dominate the Lighting as a Service Industry During the Forecast Period
Figure 12 North America to Dominate the Commercial End-User Segment While Europe to Grow at the Fastest Rate During the Forecast Period
Figure 13 Luminaire & Control Equipment is Expected to Continue to Be the Largest Segment, By Component, 2021
Figure 14 Attractive Market Opportunities in the Lighting as a Services Industry, 2016�2021
Figure 15 The European & Asia-Pacific Markets are Expected to Grow at the Highest CAGRs From 2016 to 2021
Figure 16 Demand From Commercial Segment is Expected to Dominate the Market During Forecast Period
Figure 17 Outdoor Segment is Expected to Grow at the Fastest Rate During the Forecast Period
Figure 18 Software & Communication Systems Segment is Expected to Grow at the Highest CAGR From 2016 to 2021
Figure 19 U.S. Accounted for the Largest Share in the North American Market in 2015
Figure 20 Lighting as a Service Industry: Market Segmentation
Figure 21 Lighting as a Service: By Component
Figure 22 Lighting as a Service: By End-User
Figure 23 Lighting as a Service: By Installation
Figure 24 Lighting as a Service: By Region
Figure 25 The Zero Capital Cost Nature of Lighting as a Services is Expected to Drive the Market
Figure 26 Market Share (Value), By End-User, 2015
Figure 27 Municipal End-User Segment is Projected to Be the Fastest Growing Lighting as a Services Industry, 2016�2021
Figure 28 Market Share (Value), By Installation, 2015
Figure 29 Outdoor Installation Segment is Projected to Be the Fastest Growing Lighting as a Services Industry, 2016�2021
Figure 30 Market Share (Value), By Component, 2015
Figure 31 Software & Communication Systems Segment is Projected to Be the Fastest Growing Market During the Forecast Period
Figure 32 Market Share (Value), By Region, 2015
Figure 33 Top 10 Growing Markets: Countries in North America & Europe to Lead Growth During the Forecast Period
Figure 34 The European Lighting as a Services Industry is Projected to Grow at the Highest CAGR During the Forecast Period
Figure 35 Regional Snapshot: North America is Expected to Continue to Dominate the Market During the Forecast Period
Figure 36 Companies Adopted Contracts & Agreements as the Key Growth Strategy, 2013�2016
Figure 37 Market Evaluation Framework, 2013�2016
Figure 38 Battle for Market Share: Contracts & Agreements Was the Key Strategy, 2013�2016
Figure 39 Region-Wise Revenue Mix of the Top 3 Market Players
Figure 40 Koninklijke Philips N.V: Company Snapshot
Figure 41 Koninklijke Philips N.V: SWOT Analysis
Figure 42 General Electric Lighting : SWOT Analysis
Figure 43 Zumtobel Group AG: Company Snapshot
Figure 44 Zumtobel Group AG: SWOT Analysis
Figure 45 SIB Lighting: Company Snapshot
Figure 46 IGOR Inc.: Company Snapshot
Figure 47 Lunera Lighting: Company Snapshot
Figure 48 RCG Lighthouse: Company Snapshot
Figure 49 Itelecom USA: Company Snapshot
Figure 50 Future Energy Solutions: Company Snapshot


Growth opportunities and latent adjacency in Lighting as a Service Market