M2M Satellite Communication Market

M2M Satellite Communication Market by Offering (Hardware, Software Types, Services), Technology (Satellite Constellation (LEO, MEO, GEO), Data Transmission, VSAT, AIS), Vertical (Maritime, Military & Defense) and Region - Global Forecast to 2028

Report Code: TC 2283 Feb, 2024, by marketsandmarkets.com

[403 Pages Report] The global market for the M2M satellite communication market is projected to grow from USD 15.5 billion in 2023 to USD 28.7 billion in 2028, at a CAGR of 13.1% during the forecast period. The increasing demand for ubiquitous and reliable connectivity in remote or challenging environments. Traditional terrestrial networks often face limitations in providing seamless communication in areas with limited infrastructure, such as rural or remote locations, oceans, and remote industrial sites. M2M satellite communication offers a solution by enabling devices and sensors to communicate efficiently over vast distances, regardless of geographical constraints.
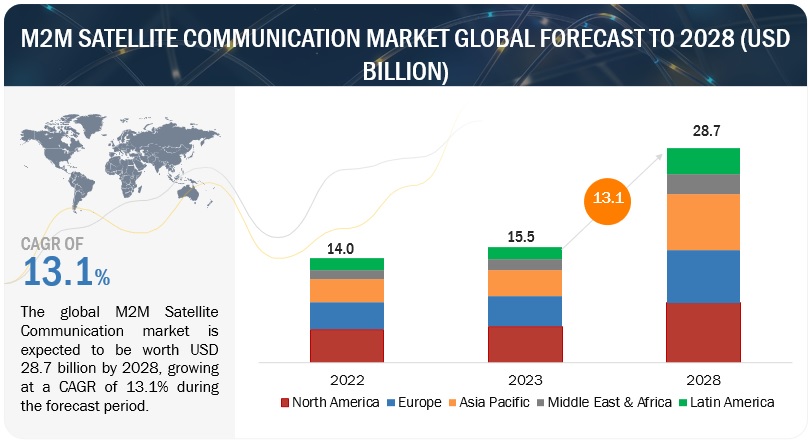
M2M Satellite Communication Market

To know about the assumptions considered for the study, Request for Free Sample Report
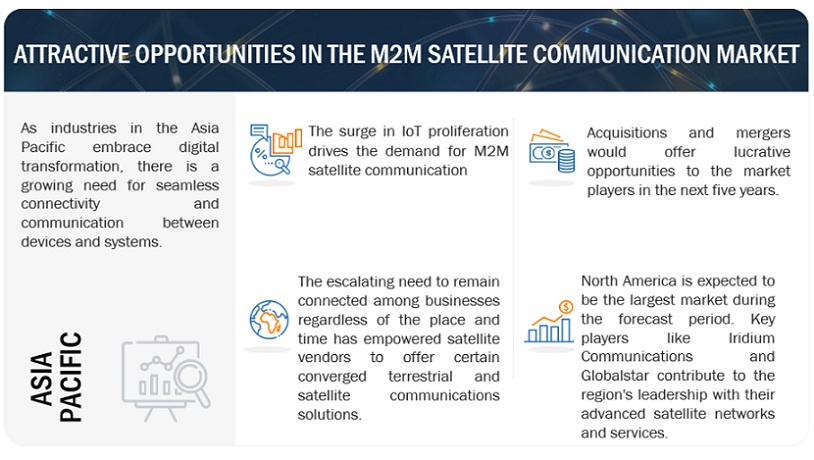
M2M Satellite Communication Market Opportunities

To know about the assumptions considered for the study, download the pdf brochure

Market Dynamics

Driver: The surge in IoT proliferation drives the demand for M2M satellite communication

As the IoT ecosystem expands exponentially, the deployment of connected devices spans various sectors, ranging from agriculture and healthcare to transportation and manufacturing. A key challenge in this expansive landscape is ensuring connectivity and efficient communication, particularly in remote or isolated areas where traditional networks may be unreliable or absent. M2M satellite communication addresses this challenge by providing a reliable and ubiquitous communication infrastructure that enables seamless connectivity for IoT devices irrespective of their geographical location.

Restraint: Cost constraints hinder the widespread adoption of M2M satellite communication

The implementation and operation of satellite communication infrastructure involve substantial financial investments, encompassing satellite deployment, ground station construction, and ongoing maintenance. These costs can be particularly burdensome for smaller enterprises or organizations operating within budget constraints, limiting their ability to adopt M2M satellite communication solutions. Additionally, the expenses associated with satellite communication services, including bandwidth and subscription fees, can contribute to the overall economic challenge. The high initial investment and ongoing operational costs may deter some businesses from embracing M2M satellite communication, hindering its broader adoption and potentially limiting the accessibility of this technology for industries seeking cost-effective connectivity solutions.

Opportunity: To enhance global connectivity in remote areas

In regions where traditional terrestrial networks struggle to establish a reliable presence, M2M satellite communication emerges as a critical solution. Industries operating in remote and underserved areas, such as agriculture, mining, and maritime, stand to benefit significantly. M2M satellite communication enables these sectors to establish seamless and robust connections, facilitating real-time monitoring and management of assets in locations where network infrastructure is either limited or entirely absent. This opportunity is particularly crucial for applications like precision agriculture, where data-driven insights and control mechanisms are essential for optimizing crop yields.

Challenge: Interference and signal quality issues pose a challenge for M2M satellite communication

The transmission of data over satellite links is susceptible to various external factors that can compromise the integrity of the communication channel. Atmospheric conditions, electromagnetic interference, and competing signals can collectively contribute to signal degradation, impacting the reliability and accuracy of data transfer. In regions with challenging weather patterns or high levels of radio frequency interference, the potential for signal quality deterioration is amplified, posing a significant hurdle for M2M satellite communication systems. Maintaining consistent and high-quality signals is paramount, especially in applications where precision, reliability, and real-time responsiveness are critical, such as in remote sensing, telemetry, and other mission-critical operations.

M2M satellite communication Market Ecosystem

The M2M satellite communication market ecosystem is a dynamic landscape consisting of various key components, each playing a distinct role in advancing the field of M2M satellite communication. These components include M2M satellite communication hardware providers, software providers, service providers, and regulatory bodies.
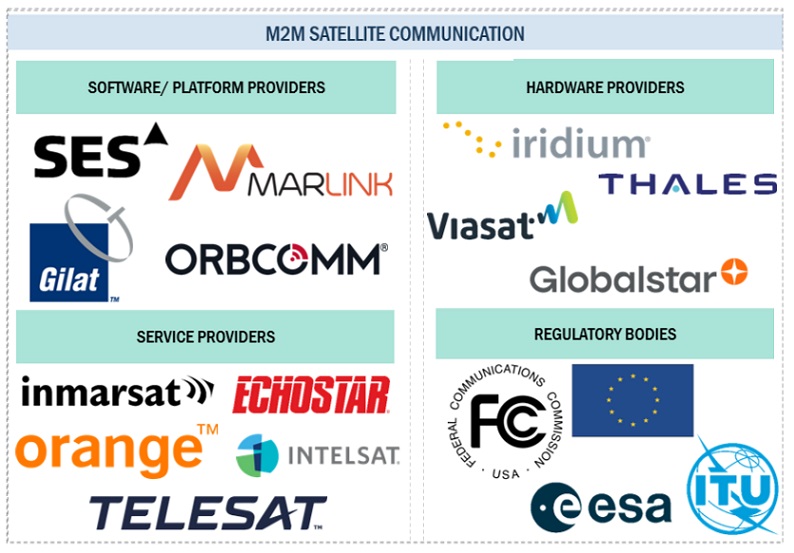
Top Companies in M2M Satellite Communication Market

By Vertical, the BFSI segment accounts for the largest market size during the forecast period.

The integration of satellite communication technology into vehicles has become increasingly prevalent, offering solutions that enhance safety, efficiency, and overall connectivity. In the automotive industry, M2M satellite communication is instrumental in providing real-time navigation, vehicle tracking, and telematics services. Fleet management systems leverage satellite connectivity for precise location tracking, route optimization, and monitoring of vehicle health. In the transportation sector, M2M satellite communication facilitates seamless communication between different modes of transport, improving overall logistics and supply chain management. Satellite communication supports connectivity in maritime and aviation industries, where terrestrial networks may be unreliable or unavailable over vast expanses of open water or airspace.

By Technology, the Very Small Aperture Terminals (VSATs) segment is projected to grow at the highest CAGR during the forecast period.

Very Small Aperture Terminals (VSATs) offer a reliable and scalable solution for connecting remote devices and locations. VSATs are satellite communication systems that utilize small antennas, typically ranging from 0.75 to 2.4 meters in diameter, to establish two-way satellite communication. In the M2M context, VSATs provide a crucial link between remote sensors, machines, or devices and centralized servers, enabling seamless data transmission. VSAT networks are highly adaptable, and their ability to provide reliable connectivity over large geographic areas makes them suitable for diverse M2M applications, including monitoring and control systems in agriculture, energy, and transportation. Additionally, VSAT systems support bidirectional communication, allowing M2M devices to both transmit data to the central server and receive commands or updates. This bidirectional capability is essential for applications like remote asset tracking, where real-time interactions and control are crucial.

North America to account for the largest market size during the forecast period.

North America has witnessed significant growth in recent years, driven by the increasing adoption of IoT devices across various industries. The growing demand for real-time data transmission and communication in sectors such as agriculture, transportation, energy, and environmental monitoring. Several companies in North America are actively contributing to the development of M2M satellite communication solutions. Companies like Iridium Communications and Globalstar have expanded their satellite networks, offering enhanced coverage and reliability for M2M applications. Moreover, partnerships between satellite communication providers and IoT platform developers have facilitated the seamless integration of satellite connectivity into IoT ecosystems.
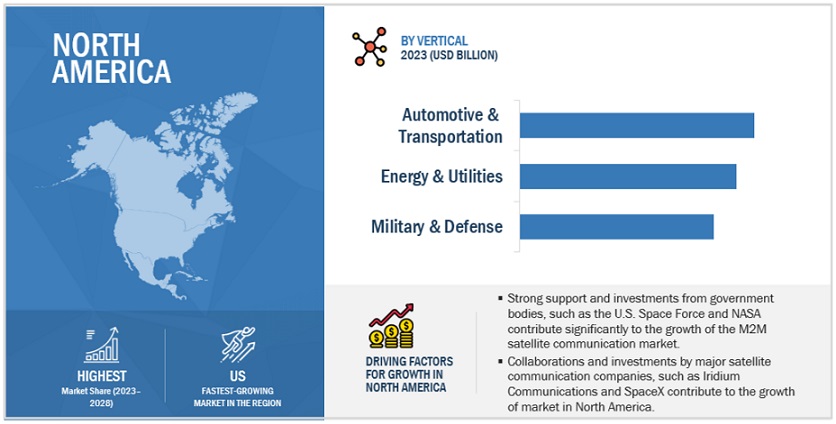
North American M2M Satellite Communication Market Size, and Share

Key Market Players

The major M2M satellite communication hardware, software and service providers include Marlink (France), Viasat (US), Thales (France), ORBCOMM (US), Iridium Communications (US), Globalstar (US), Orange (France), EchoStar (US), Intelsat (US), Rogers Communications (Canada), SES (Luxembourg), Gilat (Israel), Telia (Sweden), Kore Wireless (US), Honeywell (US), Qualcomm (US), Telesat (Canada), Wireless Logic (England), Outerlink Global Solutions (US), Nupoint Systems (Canada), Businesscom Networks (US), Semtech (US), Yahsat (UAE). These companies have used both organic and inorganic growth strategies such as product launches, acquisitions, and partnerships to strengthen their position in the M2M satellite communication market.

Get online access to the report on the World's First Market Intelligence Cloud

  • Easy to Download Historical Data & Forecast Numbers
  • Company Analysis Dashboard for high growth potential opportunities
  • Research Analyst Access for customization & queries
  • Competitor Analysis with Interactive dashboard
  • Latest News, Updates & Trend analysis
Request Sample

Scope of the Report

Report Metrics

Details

Market size available for years

2017–2028

Base year considered

2022

Forecast period

2023–2028

Forecast units

USD Billion

Segments Covered

Offering (Hardware, Software Type & Services) Technology (Satellite Constellation [Low-Earth Orbit, Medium-Earth Orbit, Geostationary-Earth Orbit]) Data Transmission, VSAT, AIS, Networking, Satellite Communication Protocols), Vertical, and Region.

Geographies covered

North America, Europe, Asia Pacific, Latin America Middle East & Africa

Companies covered

Marlink (France), Viasat (US), Thales (France), ORBCOMM (US), Iridium Communications (US), Globalstar (US), Orange (France), EchoStar (US), Intelsat (US), Rogers Communications (Canada), SES (Luxembourg), Gilat (Israel), Telia (Sweden), Kore Wireless (US), Honeywell (US), Qualcomm (US), Telesat (Canada), Wireless Logic (England), Outerlink Global Solutions (US), Nupoint Systems (Canada), Businesscom Networks (US), Semtech (US), Yahsat (UAE).

This research report categorizes the M2M satellite communication market based on offering (hardware, software type and services) technology, vertical, and region.

Offering:
  • Hardware
    • Antennas
    • Terminals
    • Modems
    • Other Hardware
  • Software Type
    • Connectivity Management Platform
    • Data Processing and Analytics Software
    • Security and Encryption Software
    • Remote Monitoring and Control Software
    • Geospatial Analysis and Mapping Software
    • Other Software Type
  • Services
    • Data Services
    • Voice Services
    • Satellite Services
    • Security Services
    • Business Services
By Technology:
  • Satellite Constellation
    • Low-Earth Orbit
    • Medium-Earth Orbit
    • Geostationary-Earth Orbit
  • Data Transmission
  • VSAT
  • AIS
  • Networking
  • Satellite Communication Protocols
By Vertical:
  • Mining
  • Agriculture
  • Energy and Utilities
  • Government and Public Sector
    • Environmental Monitoring
    • Disaster Management
    • Smart Cities Management
  • Automotive and Transportation
  • Maritime
  • Retail
  • Military and Defense
  • Manufacturing
  • Healthcare
  • Other Verticals (Education, IT/ITeS, Real Estate, Logistics and Construction)
By Region:
  • North America
  • Europe
  • Asia Pacific
  • Latin America
  • Middle East & Africa

Recent Developments:

  • In November 2023, SWISSto12 and Thales collaborated to advance the development of Active Electronically Steerable Antennas (AESAs) catering to the Satcom-on-the-move market, particularly for airborne, land, and maritime vehicles. This collaboration involves integrating SWISSto12's innovative 3D-printed antenna apertures with Thales' cutting-edge solid-state beamformers.
  • In October 2023, Viasat introduced upgraded business aviation in-flight broadband service options that align its Viasat Ka-band solution with the Jet ConneX solution from its recently acquired Inmarsat business. This integration aims to provide enhanced in-flight connectivity services for business aviation customers, combining the strengths of both Viasat and Inmarsat offerings to deliver a comprehensive and improved in-flight broadband experience.
  • In July 2023, Thales entered exclusive negotiations to acquire Cobham Aerospace Communications for USD 1.1 billion. This move aligns with Thales' strategy to enhance its Avionics portfolio by gaining a leading position in safety cockpit communications.
  • In May 2023, Viasat announced the acquisition of Inmarsat, marking a significant step that amplifies the company's scale and capabilities. This merger strengthens their position within the dynamic and competitive satellite communications industry, enabling them to leverage expanded scale and scope to drive further growth and innovation.
  • In February 2023, Gilat unveiled the SkyEdge IV Taurus-M, a new satellite modem product tailored for military and government markets. This modem, backward compatible with SkyEdge II-c, safeguards the investments of customers who have previously embraced Gilat’s leading satellite network platform.

Frequently Asked Questions (FAQ):

To know about the assumptions considered for the study, download the pdf brochure

TABLE OF CONTENTS
 
1 INTRODUCTION (Page No. - 33)
    1.1 STUDY OBJECTIVES 
    1.2 MARKET DEFINITION 
           1.2.1 INCLUSIONS AND EXCLUSIONS
    1.3 MARKET SCOPE 
           1.3.1 MARKET SEGMENTATION
                    FIGURE 1 M2M SATELLITE COMMUNICATION MARKET SEGMENTATION
                    FIGURE 2 REGIONAL SEGMENTATION
    1.4 CURRENCY CONSIDERED 
           TABLE 1 USD EXCHANGE RATES, 2018–2022
    1.5 STAKEHOLDERS 
    1.6 SUMMARY OF CHANGES 
 
2 RESEARCH METHODOLOGY (Page No. - 39)
    2.1 RESEARCH DATA 
           FIGURE 3 M2M SATELLITE COMMUNICATION MARKET: RESEARCH DESIGN
           2.1.1 SECONDARY DATA
           2.1.2 PRIMARY DATA
                    2.1.2.1 Breakup of primary profiles
                    2.1.2.2 Key industry insights
    2.2 DATA TRIANGULATION 
           FIGURE 4 MARKET: DATA TRIANGULATION
    2.3 MARKET SIZE ESTIMATION 
           FIGURE 5 MARKET: TOP-DOWN AND  BOTTOM-UP APPROACHES
           2.3.1 TOP-DOWN APPROACH
           2.3.2 BOTTOM-UP APPROACH
                    FIGURE 6 BOTTOM-UP APPROACH 1 (SUPPLY-SIDE): REVENUE FROM SOLUTIONS/SERVICES OF M2M SATELLITE COMMUNICATION MARKET
                    FIGURE 7 BOTTOM-UP APPROACH 2 (SUPPLY-SIDE): COLLECTIVE REVENUE FROM ALL SOLUTIONS/SERVICES OF MARKET
                    FIGURE 8 BOTTOM-UP APPROACH 3 (SUPPLY-SIDE): COLLECTIVE REVENUE FROM ALL SOLUTIONS/SERVICES OF MARKET
                    FIGURE 9 BOTTOM-UP APPROACH 4 (DEMAND-SIDE): SHARE OF M2M SATELLITE COMMUNICATION THROUGH OVERALL DIGITAL SOLUTIONS SPENDING
    2.4 GROWTH FORECAST 
           TABLE 2 FACTOR ANALYSIS
    2.5 RESEARCH ASSUMPTIONS 
    2.6 STUDY LIMITATIONS 
    2.7 IMPLICATIONS OF RECESSION ON MARKET 
           TABLE 3 IMPACT OF RECESSION ON GLOBAL MARKET
 
3 EXECUTIVE SUMMARY (Page No. - 52)
    TABLE 4 M2M SATELLITE COMMUNICATION MARKET SIZE AND GROWTH RATE, 2018–2022 (USD MILLION, Y-O-Y) 
    TABLE 5 MMARKET SIZE AND GROWTH RATE, 2023–2028 (USD MILLION, Y-O-Y) 
    FIGURE 10 HARDWARE ACCOUNTED FOR LARGEST MARKET SHARE IN 2023 
    FIGURE 11 ANTENNAS DOMINATED HARDWARE SEGMENT IN 2023 
    FIGURE 12 CONNECTIVITY MANAGEMENT PLATFORM WAS LARGEST SOFTWARE TYPE IN 2023 
    FIGURE 13 BUSINESS SERVICES ACCOUNTED FOR LARGEST SHARE OF SERVICES SEGMENT IN 2023 
    FIGURE 14 SATELLITE CONSTELLATION ACCOUNTED WAS LARGEST TECHNOLOGY SEGMENT IN 2023 
    FIGURE 15 MILITARY & DEFENSE VERTICAL TO REGISTER HIGHEST CAGR DURING FORECAST PERIOD 
    FIGURE 16 ASIA PACIFIC TO RECORD HIGHEST CAGR DURING FORECAST PERIOD 
 
4 PREMIUM INSIGHTS (Page No. - 58)
    4.1 ATTRACTIVE OPPORTUNITIES FOR PLAYERS IN M2M SATELLITE COMMUNICATION MARKET 
           FIGURE 17 THE GLOBAL DEMAND FOR M2M SATELLITE COMMUNICATION RISES AS IT ENHANCES OPERATIONAL EFFICIENCY ACROSS DIVERSE INDUSTRIES
    4.2 MARKET, BY OFFERING 
           FIGURE 18 SERVICES SEGMENT TO REGISTER HIGHEST CAGR DURING FORECAST PERIOD
    4.3 MARKET,  BY OFFERING AND KEY VERTICALS 
           FIGURE 19 AUTOMOTIVE & TRANSPORTATION ACCOUNTED FOR LARGEST SHARE OF NORTH AMERICAN MARKET IN 2023
    4.4 MARKET, BY REGION 
           FIGURE 20 NORTH AMERICA ACCOUNTED FOR LARGEST SHARE IN 2023
 
5 MARKET OVERVIEW AND INDUSTRY TRENDS (Page No. - 60)
    5.1 INTRODUCTION 
    5.2 MARKET DYNAMICS 
           FIGURE 21 MARKET DRIVERS, RESTRAINTS, OPPORTUNITIES, AND CHALLENGES
           5.2.1 DRIVERS
                    5.2.1.1 Escalating need for enriched data communication
                    5.2.1.2 Surge in IoT proliferation
                    5.2.1.3 Growing demand for monitoring and remote management of connected devices
           5.2.2 RESTRAINTS
                    5.2.2.1 Limited bandwidth and latency issues
                    5.2.2.2 Cost constraints hindering widespread adoption of M2M satellite communications
           5.2.3 OPPORTUNITIES
                    5.2.3.1 Co-existence of satellite and terrestrial communications solutions
                    5.2.3.2 Global connectivity in remote areas
           5.2.4 CHALLENGES
                    5.2.4.1 Growing security concerns
                    5.2.4.2 Interference of external factors and signal quality issues
    5.3 INDUSTRY TRENDS 
           5.3.1 M2M SATELLITE COMMUNICATION MARKET: ARCHITECTURE
                    FIGURE 22 M2M SATELLITE COMMUNICATION ARCHITECTURE
           5.3.2 MARKET: EVOLUTION
                    FIGURE 23 M2M SATELLITE COMMUNICATION EVOLUTION
           5.3.3 SUPPLY CHAIN ANALYSIS
                    FIGURE 24 MARKET: SUPPLY CHAIN ANALYSIS
           5.3.4 ECOSYSTEM/MARKET MAP
                    FIGURE 25 KEY PLAYERS IN MARKET ECOSYSTEM
                    TABLE 6 MARKET: ROLE OF PLAYERS IN ECOSYSTEM
                    5.3.4.1 Software or platform providers
                    5.3.4.2 Hardware providers
                    5.3.4.3 Service providers
                    5.3.4.4 Regulatory bodies
           5.3.5 CASE STUDY ANALYSIS
                    5.3.5.1 CASE STUDY 1: RFI overcame Cannes Festival network congestion using Marlink’s VSAT and Satcube
                    5.3.5.2 CASE STUDY 2: Thuraya’s Push-To-Talk solution revolutionized maritime communications for luxury yachts
                    5.3.5.3 CASE STUDY 3: British Army enhanced remote telemedicine in Mali using Intelsat's FlexMove and Satcube terminal
                    5.3.5.4 CASE STUDY 4: GOST enhances marine security with ORBCOMM for theft prevention and vessel protection
                    5.3.5.5 CASE STUDY 5: IGC boosts military satellite network performance with iDirect evolution on Intelsat Epic
           5.3.6 TARIFF AND REGULATORY LANDSCAPE
                    5.3.6.1 Tariffs related to M2M satellite communication market
                               TABLE 7 TARIFF RELATED TO M2M SATELLITE COMMUNICATION
                    5.3.6.2 Regulatory bodies, government agencies, and other organizations
                               TABLE 8 NORTH AMERICA: REGULATORY BODIES, GOVERNMENT AGENCIES, AND OTHER ORGANIZATIONS
                               TABLE 9 EUROPE: REGULATORY BODIES, GOVERNMENT AGENCIES, AND OTHER ORGANIZATIONS
                               TABLE 10 ASIA PACIFIC: REGULATORY BODIES, GOVERNMENT AGENCIES, AND OTHER ORGANIZATIONS
                               TABLE 11 MIDDLE EAST & AFRICA: REGULATORY BODIES, GOVERNMENT AGENCIES, AND OTHER ORGANIZATIONS
                               TABLE 12 LATIN AMERICA: REGULATORY BODIES, GOVERNMENT AGENCIES, AND OTHER ORGANIZATIONS
                    5.3.6.3 North America
                               5.3.6.3.1 US
                               5.3.6.3.2 Canada
                    5.3.6.4 Europe
                    5.3.6.5 Asia Pacific
                               5.3.6.5.1 China
                               5.3.6.5.2 India
                               5.3.6.5.3 Japan
                    5.3.6.6 Middle East & Africa
                               5.3.6.6.1 UAE
                               5.3.6.6.2 KSA
                               5.3.6.6.3 Nigeria
                    5.3.6.7 Latin America
                               5.3.6.7.1 Brazil
                               5.3.6.7.2 Mexico
           5.3.7 PATENT ANALYSIS
                    5.3.7.1 Methodology
                    5.3.7.2 Patents filed, by document type
                               TABLE 13 PATENTS FILED, 2013–2023
                    5.3.7.3 Innovation and patent applications
                               FIGURE 26 NUMBER OF PATENTS GRANTED, 2013–2023
                               5.3.7.3.1 Top 10 applicants in M2M satellite communication market
                               FIGURE 27 TOP 10 APPLICANTS IN MARKET, 2013–2023
                               FIGURE 28 REGIONAL ANALYSIS OF PATENTS GRANTED, 2013–2023
                               TABLE 14 TOP 20 PATENT OWNERS IN MARKET, 2013–2023
                               TABLE 15 PATENTS GRANTED IN MARKET
           5.3.8 TRADE ANALYSIS
                    5.3.8.1 Import scenario of antennas and antenna reflectors
                               FIGURE 29 ANTENNAS AND ANTENNA REFLECTOR IMPORTS, BY KEY COUNTRIES, 2015–2022 (USD BILLION)
                    5.3.8.2 Export scenario of antennas and antenna reflectors
                               FIGURE 30 ANTENNAS AND ANTENNA REFLECTOR EXPORTS, BY KEY COUNTRIES, 2015–2022 (USD BILLION)
           5.3.9 TECHNOLOGY ANALYSIS
                    FIGURE 31 M2M SATELLITE COMMUNICATION MARKET: TECHNOLOGY ANALYSIS
                    5.3.9.1 Key technologies
                               5.3.9.1.1 Telemetry
                               5.3.9.1.2 VSAT
                               5.3.9.1.3 AIS
                    5.3.9.2 Complementary technologies
                               5.3.9.2.1 AI/ML
                               5.3.9.2.2 IoT
                               5.3.9.2.3 Big Data & Analytics
                    5.3.9.3 Adjacent technologies
                               5.3.9.3.1 AR/VR
                               5.3.9.3.2 Digital twin
                               5.3.9.3.3 5G technology & networking
           5.3.10 PRICING ANALYSIS
                    5.3.10.1 Average selling price trends of key players, by hardware
                               FIGURE 32 AVERAGE SELLING PRICE TREND OF KEY PLAYERS, BY TOP 3 HARDWARE
                               TABLE 16 AVERAGE SELLING PRICE TREND OF KEY PLAYERS, BY TOP 3 HARDWARE
                    5.3.10.2 Indicative pricing analysis by M2M satellite communication vendors, by service
                               TABLE 17 M2M SATELLITE COMMUNICATION: INDICATIVE PRICING LEVELS OF M2M SATELLITE COMMUNICATION, BY SERVICES
           5.3.11 INVESTMENT AND FUNDING SCENARIO
                    FIGURE 33 M2M SATELLITE COMMUNICATION MARKET: INVESTMENT LANDSCAPE,  2017–2022
           5.3.12 PORTER’S FIVE FORCES ANALYSIS
                    FIGURE 34 MARKET: PORTER’S FIVE FORCES ANALYSIS
                    TABLE 18 MARKET: PORTER’S FIVE FORCES ANALYSIS
                    5.3.12.1 Threat from new entrants
                    5.3.12.2 Threat of substitutes
                    5.3.12.3 Bargaining power of suppliers
                    5.3.12.4 Bargaining power of buyers
                    5.3.12.5 Intensity of competition rivalry
           5.3.13 TRENDS/DISRUPTIONS IMPACTING CUSTOMER’S BUSINESS
                    FIGURE 35 MARKET: TRENDS/DISRUPTIONS IMPACTING CUSTOMER’S BUSINESS
           5.3.14 KEY CONFERENCES & EVENTS IN 2024–2025
                    TABLE 19 M2M SATELLITE COMMUNICATION MARKET: KEY CONFERENCES & EVENTS, 2024–2025
           5.3.15 KEY STAKEHOLDERS AND BUYING CRITERIA
                    5.3.15.1 Key stakeholders in buying process
                               FIGURE 36 INFLUENCE OF STAKEHOLDERS ON BUYING PROCESS FOR TOP THREE VERTICALS
                               TABLE 20 INFLUENCE OF STAKEHOLDERS ON BUYING PROCESS FOR TOP THREE VERTICALS
                    5.3.15.2 Buying criteria
                               FIGURE 37 KEY BUYING CRITERIA FOR TOP THREE VERTICALS
                               TABLE 21 KEY BUYING CRITERIA FOR TOP THREE VERTICALS
           5.3.16 TECHNOLOGY ROADMAP OF MARKET
                    TABLE 22 SHORT-TERM ROADMAP (UPTO 2027)
                    TABLE 23 LONG-TERM ROADMAP (UPTO 2030)
           5.3.17 BUSINESS MODELS OF M2M SATELLITE COMMUNICATION MARKET
                    5.3.17.1 Subscription-based model
                    5.3.17.2 Pay-per-use model
                    5.3.17.3 Vertical-specific solutions
                    5.3.17.4 Platform as a service (PaaS)
                    5.3.17.5 Integrated hardware and service bundles
           5.3.18 TYPE OF SATELLITE COMMUNICATION SERVICES
                    5.3.18.1 Telecommunication services
                    5.3.18.2 Broadcasting services
                    5.3.18.3 Data communications services
           5.3.19 TYPE OF SATELLITE COMMUNICATION CHANNELS
 
6 M2M SATELLITE COMMUNICATION MARKET, BY OFFERING (Page No. - 105)
    6.1 INTRODUCTION 
           6.1.1 OFFERING: MARKET DRIVERS
                    FIGURE 38 SERVICES SEGMENT TO WITNESS HIGHEST CAGR DURING FORECAST PERIOD
                    TABLE 24 MARKET, BY OFFERING, 2018–2022 (USD MILLION)
                    TABLE 25 MARKET, BY OFFERING, 2023–2028 (USD MILLION)
    6.2 HARDWARE 
           6.2.1 INCREASING ADOPTION OF IOT SOLUTIONS TO FUEL DEMAND FOR ROBUST HARDWARE
                    FIGURE 39 ANTENNAS SEGMENT TO ACCOUNT FOR LARGEST MARKET SHARE DURING FORECAST PERIOD
                    TABLE 26 MARKET, BY HARDWARE, 2018–2022 (USD MILLION)
                    TABLE 27 MARKET, BY HARDWARE, 2023–2028 (USD MILLION)
                    TABLE 28 HARDWARE: MARKET, BY REGION,  2018–2022 (USD MILLION)
                    TABLE 29 HARDWARE: MARKET, BY REGION,  2023–2028 (USD MILLION)
           6.2.2 ANTENNAS
                    TABLE 30 ANTENNAS: MARKET, BY REGION,  2018–2022 (USD MILLION)
                    TABLE 31 ANTENNAS: MARKET, BY REGION,  2023–2028 (USD MILLION)
                    6.2.2.1 Parabolic antennas
                    6.2.2.2 Flat panel antennas
                    6.2.2.3 Patch antennas
                    6.2.2.4 Others
           6.2.3 TERMINALS
                    TABLE 32 TERMINALS: MARKET, BY REGION,  2018–2022 (USD MILLION)
                    TABLE 33 TERMINALS: MARKET, BY REGION,  2023–2028 (USD MILLION)
                    6.2.3.1 Ruggedized terminals
                    6.2.3.2 Compact terminals
                    6.2.3.3 Machine-to-machine (M2M) modules
                    6.2.3.4 Others
           6.2.4 MODEMS
                    TABLE 34 MODEMS: M2M SATELLITE COMMUNICATION MARKET, BY REGION,  2018–2022 (USD MILLION)
                    TABLE 35 MODEMS: MARKET, BY REGION,  2023–2028 (USD MILLION)
                    6.2.4.1 Satellite modems
                               6.2.4.1.1 Low-power modems
                               6.2.4.1.2 High-throughput modems
                    6.2.4.2 Others
           6.2.5 OTHER HARDWARE
                    TABLE 36 OTHER HARDWARE: MARKET, BY REGION,  2018–2022 (USD MILLION)
                    TABLE 37 OTHER HARDWARE: MARKET, BY REGION,  2023–2028 (USD MILLION)
    6.3 SOFTWARE 
           6.3.1 INCREASING DEMAND FOR REAL-TIME DATA ANALYTICS AND SECURE CONNECTIVITY IN REMOTE LOCATIONS TO DRIVE DEMAND
                    FIGURE 40 GEOSPATIAL ANALYSIS & MAPPING SOFTWARE SEGMENT TO ACCOUNT FOR LARGEST MARKET SHARE DURING FORECAST PERIOD
                    TABLE 38 MARKET, BY SOFTWARE, 2018–2022 (USD MILLION)
                    TABLE 39 MARKET, BY SOFTWARE, 2023–2028 (USD MILLION)
                    TABLE 40 SOFTWARE: MARKET, BY REGION,  2018–2022 (USD MILLION)
                    TABLE 41 SOFTWARE: MARKET, BY REGION,  2023–2028 (USD MILLION)
           6.3.2 CONNECTIVITY MANAGEMENT PLATFORM
                    TABLE 42 CONNECTIVITY MANAGEMENT PLATFORM: MARKET, BY REGION, 2018–2022 (USD MILLION)
                    TABLE 43 CONNECTIVITY MANAGEMENT PLATFORM: MARKET, BY REGION, 2023–2028 (USD MILLION)
                    6.3.2.1 Network management software
                    6.3.2.2 Device provisioning and management
           6.3.3 DATA PROCESSING & ANALYTICS SOFTWARE
                    TABLE 44 DATA PROCESSING & ANALYTICS SOFTWARE: MARKET, BY REGION, 2018–2022 (USD MILLION)
                    TABLE 45 DATA PROCESSING & ANALYTICS SOFTWARE: MARKET, BY REGION, 2023–2028 (USD MILLION)
                    6.3.3.1 Edge computing software
                    6.3.3.2 Data analytics platform
                    6.3.3.3 Big data analytics
           6.3.4 SECURITY & ENCRYPTION SOFTWARE
                    TABLE 46 SECURITY & ENCRYPTION SOFTWARE: M2M SATELLITE COMMUNICATION MARKET,  BY REGION, 2018–2022 (USD MILLION)
                    TABLE 47 SECURITY & ENCRYPTION SOFTWARE: MARKET,  BY REGION, 2023–2028 (USD MILLION)
                    6.3.4.1 Data encryption software
                    6.3.4.2 Authentication mechanisms
                    6.3.4.3 Security protocols
                    6.3.4.4 VPNs
           6.3.5 REMOTE MONITORING & CONTROL SOFTWARE
                    TABLE 48 REMOTE MONITORING & CONTROL SOFTWARE: MARKET, BY REGION, 2018–2022 (USD MILLION)
                    TABLE 49 REMOTE MONITORING & CONTROL SOFTWARE: MARKET, BY REGION, 2023–2028 (USD MILLION)
                    6.3.5.1 SCADA (Supervisory Control and Data Acquisition) systems
                    6.3.5.2 Command and control software
           6.3.6 GEOSPATIAL ANALYSIS & MAPPING SOFTWARE
                    TABLE 50 GEOSPATIAL ANALYSIS & MAPPING: MARKET,  BY REGION, 2018–2022 (USD MILLION)
                    TABLE 51 GEOSPATIAL ANALYSIS & MAPPING: MARKET,  BY REGION, 2023–2028 (USD MILLION)
                    6.3.6.1 Geographic information system (GIS) software
                    6.3.6.2 Satellite imaging and interpretation tools
                    6.3.6.3 Geospatial software
           6.3.7 OTHER SOFTWARE
                    TABLE 52 OTHER SOFTWARE: MARKET, BY REGION, 2018–2022 (USD MILLION)
                    TABLE 53 OTHER SOFTWARE: MARKET, BY REGION, 2023–2028 (USD MILLION)
    6.4 SERVICES 
           6.4.1 INCREASING DEMAND FOR RELIABLE AND GLOBAL CONNECTIVITY IN REMOTE OR CHALLENGING ENVIRONMENTS TO DRIVE MARKET
                    FIGURE 41 SATELLITE SERVICES SEGMENT TO REGISTER HIGHEST CAGR DURING FORECAST PERIOD
                    TABLE 54 MARKET, BY SERVICES, 2018–2022 (USD MILLION)
                    TABLE 55 MARKET, BY SERVICES, 2023–2028 (USD MILLION)
                    TABLE 56 SERVICES: MARKET, BY REGION,  2018–2022 (USD MILLION)
                    TABLE 57 SERVICES: MARKET, BY REGION,  2023–2028 (USD MILLION)
           6.4.2 DATA SERVICES
                    TABLE 58 DATA SERVICES: M2M SATELLITE COMMUNICATION MARKET, BY REGION,  2018–2022 (USD MILLION)
                    TABLE 59 DATA SERVICES: MARKET, BY REGION,  2023–2028 (USD MILLION)
                    6.4.2.1 Data transmission services
                    6.4.2.2 Data analytics and reporting services
           6.4.3 VOICE SERVICES
                    TABLE 60 VOICE SERVICES: MARKET, BY REGION,  2018–2022 (USD MILLION)
                    TABLE 61 VOICE SERVICES: MARKET, BY REGION,  2023–2028 (USD MILLION)
                    6.4.3.1 Voice connectivity services
                    6.4.3.2 Push-to-talk services
           6.4.4 SATELLITE SERVICES
                    TABLE 62 SATELLITE SERVICES: MARKET, BY REGION, 2018–2022 (USD MILLION)
                    TABLE 63 SATELLITE SERVICES: MARKET, BY REGION,  2023–2028 (USD MILLION)
                    6.4.4.1 Telemetry and remote monitoring services
                    6.4.4.2 Satellite IoT platform services
                    6.4.4.3 Geospatial services
           6.4.5 SECURITY SERVICES
                    TABLE 64 SECURITY SERVICES: MARKET, BY REGION,  2018–2022 (USD MILLION)
                    TABLE 65 SECURITY SERVICES: MARKET, BY REGION,  2023–2028 (USD MILLION)
                    6.4.5.1 Device management services
                    6.4.5.2 Regulatory compliance services
           6.4.6 BUSINESS SERVICES
                    TABLE 66 BUSINESS SERVICES: MARKET, BY REGION,  2018–2022 (USD MILLION)
                    TABLE 67 BUSINESS SERVICES: MARKET, BY REGION,  2023–2028 (USD MILLION)
                    6.4.6.1 Custom application development services
                    6.4.6.2 Consulting and integration services
                    6.4.6.3 Training and support services
                    6.4.6.4 Cloud services
 
7 M2M SATELLITE COMMUNICATION MARKET, BY TECHNOLOGY (Page No. - 147)
    7.1 INTRODUCTION 
           7.1.1 TECHNOLOGY: MARKET DRIVERS
                    FIGURE 42 SATELLITE CONSTELLATION TECHNOLOGY TO ACCOUNT FOR LARGEST MARKET SHARE DURING FORECAST PERIOD
                    TABLE 68 MARKET, BY TECHNOLOGY, 2018–2022 (USD MILLION)
                    TABLE 69 MARKET, BY TECHNOLOGY,  2023–2028 (USD MILLION)
    7.2 SATELLITE CONSTELLATION 
           7.2.1 NEED FOR GLOBAL CONNECTIVITY TO DRIVE MARKET
                    TABLE 70 MARKET, BY SATELLITE CONSTELLATION,  2018–2022 (USD MILLION)
                    TABLE 71 MARKET, BY SATELLITE CONSTELLATION,  2023–2028 (USD MILLION)
                    TABLE 72 SATELLITE CONSTELLATION: MARKET, BY REGION, 2018–2022 (USD MILLION)
                    TABLE 73 SATELLITE CONSTELLATION: MARKET, BY REGION, 2023–2028 (USD MILLION)
           7.2.2 LOW EARTH ORBIT
                    TABLE 74 LOW EARTH ORBIT: MARKET, BY REGION,  2018–2022 (USD MILLION)
                    TABLE 75 LOW EARTH ORBIT: MARKET, BY REGION,  2023–2028 (USD MILLION)
           7.2.3 MEDIUM EARTH ORBIT
                    TABLE 76 MEDIUM EARTH ORBIT: MARKET, BY REGION,  2018–2022 (USD MILLION)
                    TABLE 77 MEDIUM EARTH ORBIT: MARKET, BY REGION,  2023–2028 (USD MILLION)
           7.2.4 GEOSTATIONARY ORBIT
                    TABLE 78 GEOSTATIONARY EARTH ORBIT: MARKET, BY REGION, 2018–2022 (USD MILLION)
                    TABLE 79 GEOSTATIONARY EARTH ORBIT: MARKET, BY REGION, 2023–2028 (USD MILLION)
    7.3 DATA TRANSMISSION 
           7.3.1 INCREASING ADOPTION OF M2M COMMUNICATION IN REAL-TIME APPLICATIONS TO BOOST MARKET
                    TABLE 80 DATA TRANSMISSION: MARKET, BY REGION,  2018–2022 (USD MILLION)
                    TABLE 81 DATA TRANSMISSION: MARKET, BY REGION,  2023–2028 (USD MILLION)
           7.3.2 MODULATION SCHEMES
           7.3.3 ERROR CORRECTION AND COMPRESSION
    7.4 VERY SMALL APERTURE TERMINAL 
           7.4.1 EASE OF DEPLOYMENT AND ADAPTABILITY TO FUEL MARKET
                    TABLE 82 VERY SMALL APERTURE TERMINAL: M2M SATELLITE COMMUNICATION MARKET,  BY REGION, 2018–2022 (USD MILLION)
                    TABLE 83 VERY SMALL APERTURE TERMINAL: MARKET,  BY REGION, 2023–2028 (USD MILLION)
    7.5 AUTOMATIC IDENTIFICATION SYSTEM 
           7.5.1 IMPERATIVE FOR IMPROVED MARITIME SAFETY AND NAVIGATION TO DRIVE MARKET
                    TABLE 84 AUTOMATIC IDENTIFICATION SYSTEM: MARKET,  BY REGION, 2018–2022 (USD MILLION)
                    TABLE 85 AUTOMATIC IDENTIFICATION SYSTEM: MARKET,  BY REGION, 2023–2028 (USD MILLION)
    7.6 NETWORKING 
           7.6.1 INCREASING DEMAND FOR GLOBAL AND RELIABLE CONNECTIVITY TO BOOST MARKET
                    TABLE 86 NETWORKING: MARKET, BY REGION,  2018–2022 (USD MILLION)
                    TABLE 87 NETWORKING: MARKET, BY REGION,  2023–2028 (USD MILLION)
           7.6.2 NARROWBAND IOT
           7.6.3 LONG-TERM EVOLUTION FOR MACHINES
           7.6.4 LONG-RANGE WIDE AREA NETWORK
    7.7 SATELLITE COMMUNICATION PROTOCOL 
           7.7.1 STANDARDIZATION AND INTEROPERABILITY OF COMMUNICATION PROTOCOLS TO DRIVE MARKET
                    TABLE 88 SATELLITE COMMUNICATION PROTOCOL: MARKET, BY REGION, 2018–2022 (USD MILLION)
                    TABLE 89 SATELLITE COMMUNICATION PROTOCOL: MARKET, BY REGION, 2023–2028 (USD MILLION)
           7.7.2 DIGITAL VIDEO BROADCASTING–SATELLITE–SECOND GENERATION
           7.7.3 DUAL-TONE MULTI-FREQUENCY SIGNALING
           7.7.4 SINGLE CHANNEL PER CARRIER
    7.8 OTHER TECHNOLOGIES 
           TABLE 90 OTHER TECHNOLOGIES: MARKET, BY REGION,  2018–2022 (USD MILLION)
           TABLE 91 OTHER TECHNOLOGIES: MARKET, BY REGION,  2023–2028 (USD MILLION)
 
8 M2M SATELLITE COMMUNICATION MARKET, BY VERTICAL (Page No. - 164)
    8.1 INTRODUCTION 
           8.1.1 VERTICAL: MARKET DRIVERS
                    FIGURE 43 MILITARY & DEFENSE VERTICAL TO REGISTER HIGHEST CAGR DURING FORECAST PERIOD
                    TABLE 92 MARKET, BY VERTICAL, 2018–2022 (USD MILLION)
                    TABLE 93 MARKET, BY VERTICAL, 2023–2028 (USD MILLION)
    8.2 MINING 
           TABLE 94 MINING: MARKET, BY APPLICATION,  2018–2022 (USD MILLION)
           TABLE 95 MINING: MARKET, BY APPLICATION,  2023–2028 (USD MILLION)
           TABLE 96 MINING: MARKET, BY REGION,  2018–2022 (USD MILLION)
           TABLE 97 MINING: MARKET, BY REGION,  2023–2028 (USD MILLION)
           8.2.1 ASSET TRACKING & MANAGEMENT
           8.2.2 SAFETY & EMERGENCY RESPONSE
           8.2.3 ENVIRONMENTAL MONITORING AND COMPLIANCE
           8.2.4 REMOTE OPERATIONS AND CONTROL
           8.2.5 OTHER MINING APPLICATIONS
    8.3 AGRICULTURE 
           TABLE 98 AGRICULTURE: M2M SATELLITE COMMUNICATION MARKET, BY APPLICATION,  2018–2022 (USD MILLION)
           TABLE 99 AGRICULTURE: MARKET, BY APPLICATION,  2023–2028 (USD MILLION)
           TABLE 100 AGRICULTURE: MARKET, BY REGION,  2018–2022 (USD MILLION)
           TABLE 101 AGRICULTURE: MARKET, BY REGION,  2023–2028 (USD MILLION)
           8.3.1 PRECISION FARMING
           8.3.2 CROP MONITORING
           8.3.3 LIVESTOCK TRACKING
           8.3.4 IRRIGATION CONTROL
           8.3.5 SOIL CONDITION MONITORING
           8.3.6 OTHERS
    8.4 ENERGY & UTILITIES 
           TABLE 102 ENERGY & UTILITIES: MARKET, BY APPLICATION, 2018–2022 (USD MILLION)
           TABLE 103 ENERGY & UTILITIES: MARKET, BY APPLICATION, 2023–2028 (USD MILLION)
           TABLE 104 ENERGY & UTILITIES: MARKET, BY REGION,  2018–2022 (USD MILLION)
           TABLE 105 ENERGY & UTILITIES: MARKET, BY REGION,  2023–2028 (USD MILLION)
           8.4.1 SMART GRID MONITORING
           8.4.2 OIL & GAS PIPELINE MONITORING
           8.4.3 REMOTE MONITORING OF ENERGY INFRASTRUCTURE
           8.4.4 WIND TURBINE CONDITION MONITORING
           8.4.5 SOLAR FARM PERFORMANCE MONITORING
           8.4.6 SMART METERING
           8.4.7 WATER RESOURCE MANAGEMENT
           8.4.8 GAS PIPELINE MONITORING
           8.4.9 UTILITY POLE MONITORING
           8.4.10 SUBSTATION MONITORING
           8.4.11 OTHERS
    8.5 GOVERNMENT & PUBLIC SECTOR 
           TABLE 106 GOVERNMENT & PUBLIC SECTOR: M2M SATELLITE COMMUNICATION MARKET, BY APPLICATION, 2018–2022 (USD MILLION)
           TABLE 107 GOVERNMENT & PUBLIC SECTOR: MARKET, BY APPLICATION, 2023–2028 (USD MILLION)
           TABLE 108 GOVERNMENT & PUBLIC SECTOR: MARKET, BY REGION, 2018–2022 (USD MILLION)
           TABLE 109 GOVERNMENT & PUBLIC SECTOR: MARKET, BY REGION, 2023–2028 (USD MILLION)
           8.5.1 ENVIRONMENTAL MONITORING
                    8.5.1.1 Weather station data collection
                    8.5.1.2 Air quality monitoring
                    8.5.1.3 Water quality monitoring
                    8.5.1.4 Forest fire detection
                    8.5.1.5 Natural disaster monitoring
                    8.5.1.6 Others
           8.5.2 DISASTER MANAGEMENT
                    8.5.2.1 Remote sensing for disaster assessment
                    8.5.2.2 Emergency communication
                    8.5.2.3 Search and rescue operations
                    8.5.2.4 Post-disaster infrastructure monitoring
                    8.5.2.5 Evacuation route monitoring
                    8.5.2.6 Others
           8.5.3 SMART CITIES MANAGEMENT
                    8.5.3.1 Traffic management
                    8.5.3.2 Public infrastructure monitoring
                    8.5.3.3 Waste management optimization
                    8.5.3.4 Environmental monitoring in urban areas
                    8.5.3.5 Smart street lighting
                    8.5.3.6 Others
           8.5.4 OTHERS
    8.6 AUTOMOTIVE & TRANSPORTATION 
           TABLE 110 AUTOMOTIVE & TRANSPORTATION: M2M SATELLITE COMMUNICATION MARKET,  BY APPLICATION, 2018–2022 (USD MILLION)
           TABLE 111 AUTOMOTIVE & TRANSPORTATION: MARKET,  BY APPLICATION, 2023–2028 (USD MILLION)
           TABLE 112 AUTOMOTIVE & TRANSPORTATION: MARKET,  BY REGION, 2018–2022 (USD MILLION)
           TABLE 113 AUTOMOTIVE & TRANSPORTATION: MARKET,  BY REGION, 2023–2028 (USD MILLION)
           8.6.1 FLEET MANAGEMENT
           8.6.2 SAFETY AND EMERGENCY RESPONSE
           8.6.3 ENVIRONMENTAL MONITORING AND COMPLIANCE
           8.6.4 REMOTE OPERATIONS AND CONTROL
           8.6.5 OTHER AUTOMOTIVE & TRANSPORTATION APPLICATIONS
    8.7 MARITIME 
           TABLE 114 MARITIME: MARKET, BY APPLICATION,  2018–2022 (USD MILLION)
           TABLE 115 MARITIME: MARKET, BY APPLICATION,  2023–2028 (USD MILLION)
           TABLE 116 MARITIME: MARKET, BY REGION,  2018–2022 (USD MILLION)
           TABLE 117 MARITIME: MARKET, BY REGION,  2023–2028 (USD MILLION)
           8.7.1 VESSEL TRACKING
           8.7.2 MARITIME SAFETY & NAVIGATION
           8.7.3 FISHERIES MONITORING
           8.7.4 OCEANOGRAPHIC DATA COLLECTION
           8.7.5 ICEBERG DETECTION
           8.7.6 OTHER MARITIME APPLICATIONS
    8.8 RETAIL 
           TABLE 118 RETAIL: M2M SATELLITE COMMUNICATION MARKET, BY APPLICATION,  2018–2022 (USD MILLION)
           TABLE 119 RETAIL: MARKET, BY APPLICATION,  2023–2028 (USD MILLION)
           TABLE 120 RETAIL: MARKET, BY REGION,  2018–2022 (USD MILLION)
           TABLE 121 RETAIL: MARKET, BY REGION,  2023–2028 (USD MILLION)
           8.8.1 SUPPLY CHAIN MONITORING
           8.8.2 INVENTORY MANAGEMENT
           8.8.3 POINT-OF-SALE DATA ANALYTICS
           8.8.4 SHELF AND MERCHANDISE TRACKING
           8.8.5 OTHER RETAIL APPLICATIONS
    8.9 MILITARY & DEFENSE 
           TABLE 122 MILITARY & DEFENSE: MARKET, BY APPLICATION, 2018–2022 (USD MILLION)
           TABLE 123 MILITARY & DEFENSE: MARKET, BY APPLICATION, 2023–2028 (USD MILLION)
           TABLE 124 MILITARY & DEFENSE: MARKET, BY REGION,  2018–2022 (USD MILLION)
           TABLE 125 MILITARY & DEFENSE: MARKET, BY REGION,  2023–2028 (USD MILLION)
           8.9.1 BORDER CONTROL & SURVEILLANCE
           8.9.2 MILITARY ASSET TRACKING
           8.9.3 DISASTER RESPONSE COORDINATION
           8.9.4 INTELLIGENCE GATHERING
           8.9.5 OTHER MILITARY & DEFENSE APPLICATIONS
    8.10 MANUFACTURING 
           TABLE 126 MANUFACTURING: M2M SATELLITE COMMUNICATION MARKET, BY APPLICATION,  2018–2022 (USD MILLION)
           TABLE 127 MANUFACTURING: MARKET, BY APPLICATION,  2023–2028 (USD MILLION)
           TABLE 128 MANUFACTURING: MARKET, BY REGION, 2018–2022 (USD MILLION)
           TABLE 129 MANUFACTURING: MARKET, BY REGION,  2023–2028 (USD MILLION)
           8.10.1 INVENTORY MANAGEMENT
           8.10.2 PREDICTIVE MAINTENANCE
           8.10.3 PROCESS MONITORING
           8.10.4 INTELLIGENCE GATHERING
           8.10.5 OTHER MANUFACTURING APPLICATIONS
    8.11 HEALTHCARE 
           TABLE 130 HEALTHCARE: MARKET, BY APPLICATION,  2018–2022 (USD MILLION)
           TABLE 131 HEALTHCARE: MARKET, BY APPLICATION,  2023–2028 (USD MILLION)
           TABLE 132 HEALTHCARE: MARKET, BY REGION,  2018–2022 (USD MILLION)
           TABLE 133 HEALTHCARE: MARKET, BY REGION,  2023–2028 (USD MILLION)
           8.11.1 TELEMEDICINE & REMOTE PATIENT MONITORING
           8.11.2 EMS CONNECTIVITY
           8.11.3 CONNECTED MEDICAL DEVICES
           8.11.4 DRUG & VACCINE SUPPLY CHAIN MANAGEMENT
           8.11.5 OTHER HEALTHCARE APPLICATIONS
    8.12 OTHER VERTICALS 
                    TABLE 134 OTHER VERTICALS: MARKET, BY REGION,  2018–2022 (USD MILLION)
                    TABLE 135 OTHER VERTICALS: MARKET, BY REGION,  2023–2028 (USD MILLION)
 
9 M2M SATELLITE COMMUNICATION MARKET, BY REGION (Page No. - 213)
    9.1 INTRODUCTION 
           FIGURE 44 INDIA TO WITNESS HIGHEST CAGR DURING FORECAST PERIOD
           FIGURE 45 ASIA PACIFIC TO REGISTER HIGHEST CAGR DURING FORECAST PERIOD
           TABLE 136 MARKET, BY REGION, 2018–2022 (USD MILLION)
           TABLE 137 MARKET, BY REGION, 2023–2028 (USD MILLION)
    9.2 NORTH AMERICA 
           9.2.1 NORTH AMERICA: MARKET DRIVERS
           9.2.2 NORTH AMERICA: IMPACT OF RECESSION
                    FIGURE 46 NORTH AMERICA: M2M SATELLITE COMMUNICATION MARKET SNAPSHOT
                    TABLE 138 NORTH AMERICA: MARKET, BY COUNTRY,  2018–2022 (USD MILLION)
                    TABLE 139 NORTH AMERICA: MARKET, BY COUNTRY,  2023–2028 (USD MILLION)
                    TABLE 140 NORTH AMERICA: MARKET, BY OFFERING,  2018–2022 (USD MILLION)
                    TABLE 141 NORTH AMERICA: MARKET, BY OFFERING,  2023–2028 (USD MILLION)
                    TABLE 142 NORTH AMERICA: MARKET, BY HARDWARE,  2018–2022 (USD MILLION)
                    TABLE 143 NORTH AMERICA: MARKET, BY HARDWARE,  2023–2028 (USD MILLION)
                    TABLE 144 NORTH AMERICA: MARKET, BY SOFTWARE, 2018–2022 (USD MILLION)
                    TABLE 145 NORTH AMERICA: MARKET, BY SOFTWARE,  2023–2028 (USD MILLION)
                    TABLE 146 NORTH AMERICA: MARKET, BY SERVICES,  2018–2022 (USD MILLION)
                    TABLE 147 NORTH AMERICA: MARKET, BY SERVICES,  2023–2028 (USD MILLION)
                    TABLE 148 NORTH AMERICA: MARKET, BY TECHNOLOGY,  2018–2022 (USD MILLION)
                    TABLE 149 NORTH AMERICA: MARKET, BY TECHNOLOGY,  2023–2028 (USD MILLION)
                    TABLE 150 NORTH AMERICA: MARKET, BY SATELLITE CONSTELLATION, 2018–2022 (USD MILLION)
                    TABLE 151 NORTH AMERICA: MARKET, BY SATELLITE CONSTELLATION, 2023–2028 (USD MILLION)
                    TABLE 152 NORTH AMERICA: MARKET, BY VERTICAL,  2018–2022 (USD MILLION)
                    TABLE 153 NORTH AMERICA: MARKET, BY VERTICAL,  2023–2028 (USD MILLION)
           9.2.3 US
                    9.2.3.1 Modernization of satellite infrastructure to propel growth of market
                               TABLE 154 US: MARKET, BY OFFERING,  2018–2022 (USD MILLION)
                               TABLE 155 US: MARKET, BY OFFERING,  2023–2028 (USD MILLION)
           9.2.4 CANADA
                    9.2.4.1 Strategic investments in satellite technology to foster market growth
                               TABLE 156 CANADA: MARKET, BY OFFERING,  2018–2022 (USD MILLION)
                               TABLE 157 CANADA: MARKET, BY OFFERING,  2023–2028 (USD MILLION)
    9.3 EUROPE 
           9.3.1 EUROPE: MARKET DRIVERS
           9.3.2 EUROPE: IMPACT OF RECESSION
                    TABLE 158 EUROPE: M2M SATELLITE COMMUNICATION MARKET, BY COUNTRY,  2018–2022 (USD MILLION)
                    TABLE 159 EUROPE: MARKET, BY COUNTRY,  2023–2028 (USD MILLION)
                    TABLE 160 EUROPE: MARKET, BY OFFERING,  2018–2022 (USD MILLION)
                    TABLE 161 EUROPE: MARKET, BY OFFERING,  2023–2028 (USD MILLION)
                    TABLE 162 EUROPE: MARKET, BY HARDWARE,  2018–2022 (USD MILLION)
                    TABLE 163 EUROPE: MARKET, BY HARDWARE,  2023–2028 (USD MILLION)
                    TABLE 164 EUROPE: MARKET, BY SOFTWARE,  2018–2022 (USD MILLION)
                    TABLE 165 EUROPE: MARKET, BY SOFTWARE,  2023–2028 (USD MILLION)
                    TABLE 166 EUROPE: MARKET, BY SERVICES,  2018–2022 (USD MILLION)
                    TABLE 167 EUROPE: MARKET, BY SERVICES,  2023–2028 (USD MILLION)
                    TABLE 168 EUROPE: MARKET, BY TECHNOLOGY,  2018–2022 (USD MILLION)
                    TABLE 169 EUROPE: MARKET, BY TECHNOLOGY,  2023–2028 (USD MILLION)
                    TABLE 170 EUROPE: MARKET, BY SATELLITE CONSTELLATION, 2018–2022 (USD MILLION)
                    TABLE 171 EUROPE: MARKET, BY SATELLITE CONSTELLATION, 2023–2028 (USD MILLION)
                    TABLE 172 EUROPE: MARKET, BY VERTICAL,  2018–2022 (USD MILLION)
                    TABLE 173 EUROPE: MARKET, BY VERTICAL,  2023–2028 (USD MILLION)
           9.3.3 UK
                    9.3.3.1 Strategic investments and innovations in satellite technology driving M2M communication growth in UK
                               TABLE 174 UK: MARKET, BY OFFERING, 2018–2022 (USD MILLION)
                               TABLE 175 UK: MARKET, BY OFFERING, 2023–2028 (USD MILLION)
           9.3.4 GERMANY
                    9.3.4.1 Advancements in hyperspectral satellite technology and strategic research propel to drive growth
                               TABLE 176 GERMANY: MARKET, BY OFFERING, 2018–2022 (USD MILLION)
                               TABLE 177 GERMANY: MARKET, BY OFFERING, 2023–2028 (USD MILLION)
           9.3.5 FRANCE
                    9.3.5.1 Advancements in military satellite technology and international collaborations to support market growth
                               TABLE 178 FRANCE: MARKET, BY OFFERING, 2018–2022 (USD MILLION)
                               TABLE 179 FRANCE: MARKET, BY OFFERING, 2023–2028 (USD MILLION)
           9.3.6 SPAIN
                    9.3.6.1 Focus on 5G, satellite upgrades, and space agency development to boost market
           9.3.7 ITALY
                    9.3.7.1 Vibrant tech ecosystem and strategic government initiatives to drive market
           9.3.8 REST OF EUROPE
    9.4 ASIA PACIFIC 
           9.4.1 ASIA PACIFIC: MARKET DRIVERS
           9.4.2 ASIA PACIFIC: IMPACT OF RECESSION
                    FIGURE 47 ASIA PACIFIC: M2M SATELLITE COMMUNICATION MARKET SNAPSHOT
                    TABLE 180 ASIA PACIFIC: MARKET, BY COUNTRY,  2018–2022 (USD MILLION)
                    TABLE 181 ASIA PACIFIC: MARKET, BY COUNTRY,  2023–2028 (USD MILLION)
                    TABLE 182 ASIA PACIFIC: MARKET, BY OFFERING,  2018–2022 (USD MILLION)
                    TABLE 183 ASIA PACIFIC: MARKET, BY OFFERING,  2023–2028 (USD MILLION)
                    TABLE 184 ASIA PACIFIC: MARKET, BY HARDWARE,  2018–2022 (USD MILLION)
                    TABLE 185 ASIA PACIFIC: MARKET, BY HARDWARE,  2023–2028 (USD MILLION)
                    TABLE 186 ASIA PACIFIC: MARKET, BY SOFTWARE,  2018–2022 (USD MILLION)
                    TABLE 187 ASIA PACIFIC: MARKET, BY SOFTWARE,  2023–2028 (USD MILLION)
                    TABLE 188 ASIA PACIFIC: MARKET, BY SERVICES,  2018–2022 (USD MILLION)
                    TABLE 189 ASIA PACIFIC: MARKET, BY SERVICES,  2023–2028 (USD MILLION)
                    TABLE 190 ASIA PACIFIC: MARKET, BY TECHNOLOGY,  2018–2022 (USD MILLION)
                    TABLE 191 ASIA PACIFIC: MARKET, BY TECHNOLOGY,  2023–2028 (USD MILLION)
                    TABLE 192 ASIA PACIFIC: MARKET, BY SATELLITE CONSTELLATION, 2018–2022 (USD MILLION)
                    TABLE 193 ASIA PACIFIC: MARKET, BY SATELLITE CONSTELLATION, 2023–2028 (USD MILLION)
                    TABLE 194 ASIA PACIFIC: MARKET, BY VERTICAL,  2018–2022 (USD MILLION)
                    TABLE 195 ASIA PACIFIC: MARKET, BY VERTICAL,  2023–2028 (USD MILLION)
           9.4.3 CHINA
                    9.4.3.1 Focus on IoT and machine-to-machine services driving MARKET
           9.4.4 JAPAN
                    9.4.4.1 Increasing reliance on IoT, smart city initiatives, and defense applications to drive growth
           9.4.5 INDIA
                    9.4.5.1 Expanding telecom sector and robust infrastructure of Indian National Satellite system promoting market growth
           9.4.6 SOUTH KOREA
                    9.4.6.1 Strategic push for advanced military surveillance driving demand for M2M satellite communication
           9.4.7 AUSTRALIA & NEW ZEALAND
                    9.4.7.1 Rising demand for remote enterprise connectivity and enhanced air traffic safety to drive market
           9.4.8 ASEAN COUNTRIES
                    9.4.8.1 Rapid digitalization fueling demand for M2M satellite communication
           9.4.9 REST OF ASIA PACIFIC
    9.5 MIDDLE EAST & AFRICA 
           9.5.1 MIDDLE EAST & AFRICA: MARKET DRIVERS
           9.5.2 MIDDLE EAST & AFRICA: IMPACT OF RECESSION
                    TABLE 196 MIDDLE EAST & AFRICA: M2M SATELLITE COMMUNICATION MARKET, BY COUNTRY, 2018–2022 (USD MILLION)
                    TABLE 197 MIDDLE EAST & AFRICA: MARKET, BY COUNTRY, 2023–2028 (USD MILLION)
                    TABLE 198 MIDDLE EAST & AFRICA: MARKET, BY OFFERING, 2018–2022 (USD MILLION)
                    TABLE 199 MIDDLE EAST & AFRICA: MARKET, BY OFFERING, 2023–2028 (USD MILLION)
                    TABLE 200 MIDDLE EAST & AFRICA: MARKET, BY HARDWARE, 2018–2022 (USD MILLION)
                    TABLE 201 MIDDLE EAST & AFRICA: MARKET, BY HARDWARE, 2023–2028 (USD MILLION)
                    TABLE 202 MIDDLE EAST & AFRICA: MARKET, BY SOFTWARE, 2018–2022 (USD MILLION)
                    TABLE 203 MIDDLE EAST & AFRICA: MARKET, BY SOFTWARE, 2023–2028 (USD MILLION)
                    TABLE 204 MIDDLE EAST & AFRICA: MARKET, BY SERVICES, 2018–2022 (USD MILLION)
                    TABLE 205 MIDDLE EAST & AFRICA: MARKET, BY SERVICES, 2023–2028 (USD MILLION)
                    TABLE 206 MIDDLE EAST & AFRICA: MARKET, BY TECHNOLOGY, 2018–2022 (USD MILLION)
                    TABLE 207 MIDDLE EAST & AFRICA: MARKET, BY TECHNOLOGY, 2023–2028 (USD MILLION)
                    TABLE 208 MIDDLE EAST & AFRICA: MARKET, BY SATELLITE CONSTELLATION, 2018–2022 (USD MILLION)
                    TABLE 209 MIDDLE EAST & AFRICA: MARKET, BY SATELLITE CONSTELLATION, 2023–2028 (USD MILLION)
                    TABLE 210 MIDDLE EAST & AFRICA: MARKET, BY VERTICAL, 2018–2022 (USD MILLION)
                    TABLE 211 MIDDLE EAST & AFRICA: MARKET, BY VERTICAL, 2023–2028 (USD MILLION)
           9.5.3 UAE
                    9.5.3.1 Strategic partnerships and government investments to propel growth in UAE
           9.5.4 SAUDI ARABIA
                    9.5.4.1 Enhanced satellite infrastructure to meet growing connectivity demands to drive market
           9.5.5 SOUTH AFRICA
                    9.5.5.1 Growing demand for local satellites fostering economic development
           9.5.6 EGYPT
                    9.5.6.1 Advancements in space program to drive M2M satellite communication growth
           9.5.7 TURKEY
                    9.5.7.1 Strong commitment to space innovation to drive growth of MARKET
           9.5.8 REST OF MIDDLE EAST & AFRICA
    9.6 LATIN AMERICA 
           9.6.1 LATIN AMERICA: MARKET DRIVERS
           9.6.2 LATIN AMERICA: IMPACT OF RECESSION
                    TABLE 212 LATIN AMERICA: M2M SATELLITE COMMUNICATION MARKET, BY COUNTRY,  2018–2022 (USD MILLION)
                    TABLE 213 LATIN AMERICA: MARKET, BY COUNTRY,  2023–2028 (USD MILLION)
                    TABLE 214 LATIN AMERICA: MARKET, BY OFFERING,  2018–2022 (USD MILLION)
                    TABLE 215 LATIN AMERICA: MARKET, BY OFFERING,  2023–2028 (USD MILLION)
                    TABLE 216 LATIN AMERICA: MARKET, BY HARDWARE,  2018–2022 (USD MILLION)
                    TABLE 217 LATIN AMERICA: MARKET, BY HARDWARE,  2023–2028 (USD MILLION)
                    TABLE 218 LATIN AMERICA: MARKET, BY SOFTWARE,  2018–2022 (USD MILLION)
                    TABLE 219 LATIN AMERICA: MARKET, BY SOFTWARE,  2023–2028 (USD MILLION)
                    TABLE 220 LATIN AMERICA: MARKET, BY SERVICES, 2018–2022 (USD MILLION)
                    TABLE 221 LATIN AMERICA: MARKET, BY SERVICES,  2023–2028 (USD MILLION)
                    TABLE 222 LATIN AMERICA: MARKET, BY TECHNOLOGY,  2018–2022 (USD MILLION)
                    TABLE 223 LATIN AMERICA: MARKET, BY TECHNOLOGY,  2023–2028 (USD MILLION)
                    TABLE 224 LATIN AMERICA: MARKET, BY SATELLITE CONSTELLATION, 2018–2022 (USD MILLION)
                    TABLE 225 LATIN AMERICA: MARKET, BY SATELLITE CONSTELLATION, 2023–2028 (USD MILLION)
                    TABLE 226 LATIN AMERICA: MARKET, BY VERTICAL,  2018–2022 (USD MILLION)
                    TABLE 227 LATIN AMERICA: MARKET, BY VERTICAL,  2023–2028 (USD MILLION)
           9.6.3 BRAZIL
                    9.6.3.1 Expansive territories and global coverage by key providers fueling market for M2M satellite communication
           9.6.4 MEXICO
                    9.6.4.1 Integration of MEXSAT satellites and SIRIS platform driving growth of M2M satellite communication
           9.6.5 ARGENTINA
                    9.6.5.1 Inter-American Development Bank investment to support Argentina's M2M satellite growth
           9.6.6 REST OF LATIN AMERICA
 
10 COMPETITIVE LANDSCAPE (Page No. - 268)
     10.1 OVERVIEW 
     10.2 KEY PLAYER STRATEGIES 
               TABLE 228 OVERVIEW OF STRATEGIES ADOPTED BY KEY M2M SATELLITE COMMUNICATION VENDORS
     10.3 REVENUE ANALYSIS 
               FIGURE 48 TOP 5 PLAYERS DOMINATED MARKET IN LAST 5 YEARS
     10.4 MARKET SHARE ANALYSIS 
               FIGURE 49 MARKET SHARE ANALYSIS FOR KEY PLAYERS, 2022
               TABLE 229 M2M SATELLITE COMMUNICATION MARKET: DEGREE OF COMPETITION
     10.5 BRAND/PRODUCT COMPARATIVE ANALYSIS 
               FIGURE 50 BRAND/PRODUCT COMPARATIVE ANALYSIS
     10.6 COMPANY EVALUATION MATRIX, 2022 
             10.6.1 STARS
             10.6.2 EMERGING LEADERS
             10.6.3 PERVASIVE PLAYERS
             10.6.4 PARTICIPANTS
                       FIGURE 51 MARKET: COMPANY EVALUATION MATRIX, 2022
             10.6.5 FOOTPRINT OF KEY PLAYERS
                       TABLE 230 PRODUCT FOOTPRINT (23 COMPANIES)
                       TABLE 231 VERTICAL FOOTPRINT (23 COMPANIES)
                       TABLE 232 REGION FOOTPRINT (23 COMPANIES)
                       TABLE 233 COMPANY FOOTPRINT (23 COMPANIES)
     10.7 STARTUP/SME EVALUATION MATRIX, 2022 
             10.7.1 PROGRESSIVE COMPANIES
             10.7.2 RESPONSIVE COMPANIES
             10.7.3 DYNAMIC COMPANIES
             10.7.4 STARTING BLOCKS
                       FIGURE 52 MARKET: STARTUP/SME EVALUATION MATRIX, 2022
             10.7.5 COMPETITIVE BENCHMARKING
                       TABLE 234 MARKET: DETAILED LIST OF KEY STARTUPS/SMES
                       TABLE 235 MARKET: COMPETITIVE BENCHMARKING OF STARTUPS/SMES
     10.8 COMPETITIVE SCENARIO AND TRENDS 
             10.8.1 PRODUCT LAUNCHES
                       TABLE 236 MARKET: PRODUCT LAUNCHES, 2021–2023
             10.8.2 DEALS
                       TABLE 237 M2M SATELLITE COMMUNICATION MARKET: DEALS, 2021–2023
             10.8.3 OTHERS
                       TABLE 238 MARKET: EXPANSIONS, 2021–2023
     10.9 VALUATION AND FINANCIAL METRICS OF KEY VENDORS 
               FIGURE 53 VALUATION AND FINANCIAL METRICS OF KEY VENDORS
     10.10 YTD PRICE TOTAL RETURN AND STOCK BETA OF KEY VENDORS 
               FIGURE 54 YTD PRICE TOTAL RETURN AND STOCK BETA OF KEY VENDORS
 
11 COMPANY PROFILES (Page No. - 288)
     11.1 INTRODUCTION 
     11.2 KEY PLAYERS 
(Business Overview, Products/Solutions/Services offered, Recent Developments, MnM View)*
             11.2.1 MARLINK
                       TABLE 239 MARLINK: COMPANY OVERVIEW
                       TABLE 240 MARLINK: PRODUCTS/SOLUTIONS/SERVICES OFFERED
                       TABLE 241 MARLINK: PRODUCT LAUNCHES AND ENHANCEMENTS
                       TABLE 242 MARLINK: DEALS
             11.2.2 VIASAT
                       TABLE 243 VIASAT: COMPANY OVERVIEW
                       FIGURE 55 VIASAT: COMPANY SNAPSHOT
                       TABLE 244 VIASAT: PRODUCTS/SOLUTIONS/SERVICES OFFERED
                       TABLE 245 VIASAT: PRODUCT LAUNCHES AND ENHANCEMENTS
                       TABLE 246 VIASAT: DEALS
             11.2.3 THALES
                       TABLE 247 THALES: COMPANY OVERVIEW
                       FIGURE 56 THALES: COMPANY SNAPSHOT
                       TABLE 248 THALES: PRODUCTS/SOLUTIONS/SERVICES OFFERED
                       TABLE 249 THALES: PRODUCT LAUNCHES AND ENHANCEMENTS
                       TABLE 250 THALES: DEALS
             11.2.4 ORBCOMM
                       TABLE 251 ORBCOMM: COMPANY OVERVIEW
                       TABLE 252 ORBCOMM: PRODUCTS/SOLUTIONS/SERVICES OFFERED
                       TABLE 253 ORBCOMM: PRODUCT LAUNCHES
                       TABLE 254 ORBCOMM: DEALS
             11.2.5 IRIDIUM COMMUNICATIONS
                       TABLE 255 IRIDIUM COMMUNICATIONS: COMPANY OVERVIEW
                       FIGURE 57 IRIDIUM COMMUNICATIONS: COMPANY SNAPSHOT
                       TABLE 256 IRIDIUM COMMUNICATIONS: PRODUCTS/ SOLUTIONS/SERVICES OFFERED
                       TABLE 257 IRIDIUM COMMUNICATIONS: PRODUCT LAUNCHES
                       TABLE 258 IRIDIUM COMMUNICATIONS: DEALS
             11.2.6 GLOBALSTAR
                       TABLE 259 GLOBALSTAR: COMPANY OVERVIEW
                       FIGURE 58 GLOBALSTAR: COMPANY SNAPSHOT
                       TABLE 260 GLOBALSTAR: PRODUCTS/SOLUTIONS/SERVICES OFFERED
                       TABLE 261 GLOBALSTAR: PRODUCT LAUNCHES
                       TABLE 262 GLOBALSTAR: DEALS
             11.2.7 ORANGE
                       TABLE 263 ORANGE: COMPANY OVERVIEW
                       FIGURE 59 ORANGE: COMPANY SNAPSHOT
                       TABLE 264 ORANGE: PRODUCTS/SOLUTIONS/SERVICES OFFERED
                       TABLE 265 ORANGE: DEALS
             11.2.8 ECHOSTAR
                       TABLE 266 ECHOSTAR: COMPANY OVERVIEW
                       FIGURE 60 ECHOSTAR: COMPANY SNAPSHOT
                       TABLE 267 ECHOSTAR: PRODUCTS/SOLUTIONS/SERVICES OFFERED
                       TABLE 268 ECHOSTAR: PRODUCT LAUNCHES AND ENHANCEMENTS
                       TABLE 269 ECHOSTAR: DEALS
             11.2.9 INTELSAT
                       TABLE 270 INTELSAT: COMPANY OVERVIEW
                       TABLE 271 INTELSAT: PRODUCTS/SOLUTIONS/SERVICES OFFERED
                       TABLE 272 INTELSAT: PRODUCT LAUNCHES AND ENHANCEMENTS
                       TABLE 273 INTELSAT: DEALS
                       TABLE 274 INTELSAT: EXPANSIONS
             11.2.10 ROGERS COMMUNICATIONS
                       TABLE 275 ROGERS COMMUNICATIONS: COMPANY OVERVIEW
                       FIGURE 61 ROGERS COMMUNICATIONS: COMPANY SNAPSHOT
                       TABLE 276 ROGERS COMMUNICATIONS: PRODUCTS/SOLUTIONS/SERVICES OFFERED
                       TABLE 277 ROGERS COMMUNICATIONS: DEALS
             11.2.11 SES
                       TABLE 278 SES: COMPANY OVERVIEW
                       FIGURE 62 SES: COMPANY SNAPSHOT
                       TABLE 279 SES: PRODUCTS/SOLUTIONS/SERVICES OFFERED
                       TABLE 280 SES: PRODUCT LAUNCHES AND ENHANCEMENTS
                       TABLE 281 SES: DEALS
                       TABLE 282 SES: EXPANSIONS
             11.2.12 GILAT
                       TABLE 283 GILAT: COMPANY OVERVIEW
                       FIGURE 63 GILAT: COMPANY SNAPSHOT
                       TABLE 284 GILAT: PRODUCTS/SOLUTIONS/SERVICES OFFERED
                       TABLE 285 GILAT: PRODUCT LAUNCHES AND ENHANCEMENTS
                       TABLE 286 GILAT: DEALS
     11.3 OTHER PLAYERS 
             11.3.1 TELIA
             11.3.2 KORE WIRELESS
             11.3.3 HONEYWELL
             11.3.4 QUALCOMM
             11.3.5 TELESAT
             11.3.6 WIRELESS LOGIC
             11.3.7 OUTERLINK GLOBAL SOLUTIONS
             11.3.8 NUPOINT SYSTEMS
             11.3.9 BUSINESSCOM NETWORKS
             11.3.10 SEMTECH
             11.3.11 YAHSAT
*Details on Business Overview, Products/Solutions/Services offered, Recent Developments, MnM View might not be captured in case of unlisted companies.
     11.4 STARTUPS/SMES 
             11.4.1 AST SPACEMOBILE
             11.4.2 ASTROCAST
             11.4.3 SKY AND SPACE GLOBAL
             11.4.4 SAT4M2M
             11.4.5 HIBER
             11.4.6 ALEN SPACE
             11.4.7 SATELIOT
 
12 ADJACENT AND RELATED MARKETS (Page No. - 379)
     12.1 ADJACENT AND RELATED MARKETS 
             12.1.1 INTRODUCTION
     12.2 SATELLITE IOT MARKET - GLOBAL FORECAST TO 2027 
             12.2.1 MARKET DEFINITION
             12.2.2 MARKET OVERVIEW
             12.2.3 SATELLITE IOT MARKET, BY SERVICE TYPE
                       TABLE 287 SATELLITE IOT MARKET, BY SERVICE TYPE, 2017–2021 (USD MILLION)
                       TABLE 288 SATELLITE IOT MARKET, BY SERVICE TYPE, 2022–2027 (USD MILLION)
             12.2.4 SATELLITE IOT MARKET, BY FREQUENCY BAND
                       TABLE 289 SATELLITE IOT MARKET, BY FREQUENCY BAND, 2017–2021 (USD MILLION)
                       TABLE 290 SATELLITE IOT MARKET, BY FREQUENCY BAND, 2022–2027 (USD MILLION)
             12.2.5 SATELLITE IOT MARKET, BY ORGANIZATION SIZE
                       TABLE 291 SATELLITE IOT MARKET, BY ORGANIZATION SIZE, 2017–2021 (USD MILLION)
                       TABLE 292 SATELLITE IOT MARKET, BY ORGANIZATION SIZE, 2022–2027 (USD MILLION)
             12.2.6 SATELLITE IOT MARKET, BY VERTICAL
                       TABLE 293 SATELLITE IOT MARKET, BY VERTICAL, 2017–2021 (USD MILLION)
                       TABLE 294 SATELLITE IOT MARKET, BY VERTICAL, 2022–2027 (USD MILLION)
             12.2.7 SATELLITE IOT MARKET, BY REGION
                       TABLE 295 SATELLITE IOT MARKET, BY REGION, 2017–2021 (USD MILLION)
                       TABLE 296 SATELLITE IOT MARKET, BY REGION, 2022–2027 (USD MILLION)
     12.3 METADATA MANAGEMENT MARKET - GLOBAL FORECAST TO 2026 
             12.3.1 MARKET DEFINITION
             12.3.2 MARKET OVERVIEW
                       TABLE 297 GLOBAL MARITIME SAFETY MARKET AND GROWTH RATE, 2016–2020 (USD MILLION, Y-O-Y %)
                       TABLE 298 GLOBAL MARITIME SAFETY MARKET AND GROWTH RATE,  2021–2026 (USD MILLION, Y-O-Y %)
             12.3.3 MARITIME SAFETY MARKET, BY COMPONENT
                       TABLE 299 MARITIME SAFETY MARKET, BY COMPONENT, 2016–2020 (USD MILLION)
                       TABLE 300 MARITIME SAFETY MARKET, BY COMPONENT, 2021–2026 (USD MILLION)
             12.3.4 MARITIME SAFETY MARKET, BY SECURITY TYPE
                       TABLE 301 MARITIME SAFETY MARKET, BY SECURITY TYPE, 2016–2020 (USD MILLION)
                       TABLE 302 MARITIME SAFETY MARKET, BY SECURITY TYPE, 2021–2026 (USD MILLION)
             12.3.5 MARITIME SAFETY MARKET, BY SYSTEM
                       TABLE 303 MARITIME SAFETY MARKET, BY SYSTEM, 2016–2020 (USD MILLION)
                       TABLE 304 MARITIME SAFETY MARKET, BY SYSTEM, 2021–2026 (USD MILLION)
             12.3.6 MARITIME SAFETY MARKET, BY APPLICATION
                       TABLE 305 MARITIME SAFETY MARKET, BY APPLICATION, 2016–2020 (USD MILLION)
                       TABLE 306 MARITIME SAFETY MARKET, BY APPLICATION, 2021–2026 (USD MILLION)
             12.3.7 MARITIME SAFETY MARKET, BY END-USER
                       TABLE 307 MARITIME SAFETY MARKET, BY END-USER, 2016–2020 (USD MILLION)
                       TABLE 308 MARITIME SAFETY MARKET, BY END-USER, 2021–2026 (USD MILLION)
             12.3.8 MARITIME SAFETY MARKET, BY REGION
                       TABLE 309 MARITIME SAFETY MARKET, BY REGION, 2016–2020 (USD MILLION)
                       TABLE 310 MARITIME SAFETY MARKET, BY REGION, 2021–2026 (USD MILLION)
 
13 APPENDIX (Page No. - 394)
     13.1 DISCUSSION GUIDE 
     13.2 KNOWLEDGESTORE: MARKETSANDMARKETS’  SUBSCRIPTION PORTAL 
     13.3 AVAILABLE CUSTOMIZATIONS 
     13.4 RELATED REPORTS 
     13.5 AUTHOR DETAILS 

The research study for the M2M satellite communication market involved extensive secondary sources, directories, and several journals. Primary sources were mainly industry experts from the core and related industries, preferred M2M satellite communication software providers, third-party service providers, consulting service providers, end users, and other commercial enterprises. In-depth interviews were conducted with various primary respondents, including key industry participants and subject matter experts, to obtain and verify critical qualitative and quantitative information, and assess the market’s prospects.

Secondary Research

The market size of companies offering M2M satellite communication hardware, software and services was arrived at based on secondary data available through paid and unpaid sources. It was also arrived at by analyzing the product portfolios of major companies and rating the companies based on their performance and quality.

In the secondary research process, various sources were referred to for identifying and collecting information for this study. Secondary sources included annual reports, press releases, and investor presentations of companies; white papers, journals, and certified publications; and articles from recognized authors, directories, and databases. The data was also collected from other secondary sources, such as journals, government websites, blogs, and vendor websites. Additionally, M2M satellite communication spending of various countries was extracted from the respective sources. Secondary research was mainly used to obtain key information related to the industry’s value chain and supply chain to identify key players based on hardware, software, services, market classification, and segmentation according to offerings of major players, industry trends related to hardware, software, services, technology, verticals, and regions, and key developments from both market- and technology-oriented perspectives.

Primary Research

In the primary research process, various primary sources from both the supply and demand sides were interviewed to obtain qualitative and quantitative information on the market. The primary sources from the supply side included various industry experts, including Chief Experience Officers (CXOs); Vice Presidents (VPs); directors from business development, marketing, and M2M satellite communication expertise; related key executives from M2M satellite communication solution vendors, SIs, professional service providers, and industry associations; and key opinion leaders.

Primary interviews were conducted to gather insights, such as market statistics, revenue data collected from solutions and services, market breakups, market size estimations, market forecasts, and data triangulation. Primary research also helped understand various trends related to technologies, applications, deployments, and regions. Stakeholders from the demand side, such as Chief Information Officers (CIOs), Chief Technology Officers (CTOs), Chief Strategy Officers (CSOs), and end users using M2M satellite communication, were interviewed to understand the buyer’s perspective on suppliers, products, service providers, and their current usage of M2M satellite communication hardware, software and services, which would impact the overall M2M satellite communication market.

The following is the breakup of primary profiles:
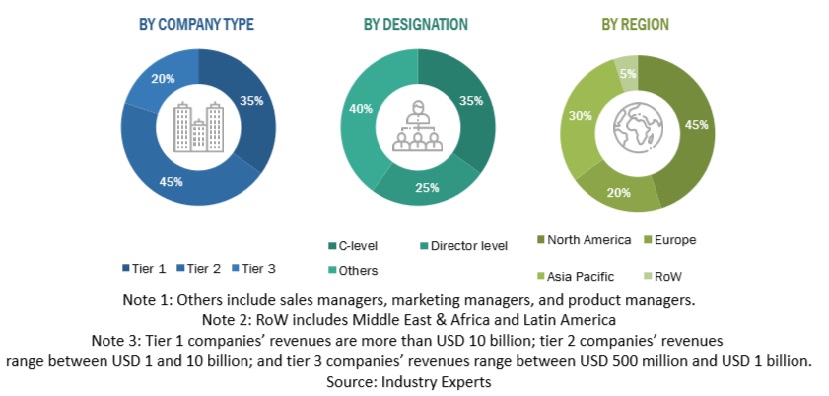
M2M Satellite Communication  Market Size, and Share

To know about the assumptions considered for the study, download the pdf brochure

Market Size Estimation

Multiple approaches were adopted for estimating and forecasting the M2M satellite communication market. The first approach involves estimating the market size by summation of companies’ revenue generated through the sale of solutions and services.

Market Size Estimation Methodology-Top-down Approach

In the top-down approach, an exhaustive list of all the vendors offering hardware, software type and services in the M2M satellite communication market was prepared. The revenue contribution of the market vendors was estimated through annual reports, press releases, funding, investor presentations, paid databases, and primary interviews. Each vendor’s offerings were evaluated based on the breadth of hardware, software and services, technology, verticals, and regions. The aggregate of all the companies’ revenue was extrapolated to reach the overall market size. Each subsegment was studied and analyzed for its global market size and regional penetration. The markets were triangulated through both primary and secondary research. The primary procedure included extensive interviews for key insights from industry leaders, such as CIOs, CEOs, VPs, directors, and marketing executives. The market numbers were further triangulated with the existing MarketsandMarkets repository for validation.

Market Size Estimation Methodology-Bottom-up Approach

In the bottom-up approach, the adoption rate of M2M satellite communication hardware, software and services among different end users in key countries with respect to their regions contributing the most to the market share was identified. For cross-validation, the adoption of M2M satellite communication hardware, software and services among industries, along with different use cases with respect to their regions, was identified and extrapolated. Weightage was given to use cases identified in different regions for the market size calculation.

Based on the market numbers, the regional split was determined by primary and secondary sources. The procedure included the analysis of the M2M satellite communication market’s regional penetration. Based on secondary research, the regional spending on Information and Communications Technology (ICT), socio-economic analysis of each country, strategic vendor analysis of major M2M satellite communication solution providers, and organic and inorganic business development activities of regional and global players were estimated. With the data triangulation procedure and data validation through primaries, the exact values of the overall M2M satellite communication market size and segments’ size were determined and confirmed using the study.

Top-down and Bottom-up Approaches
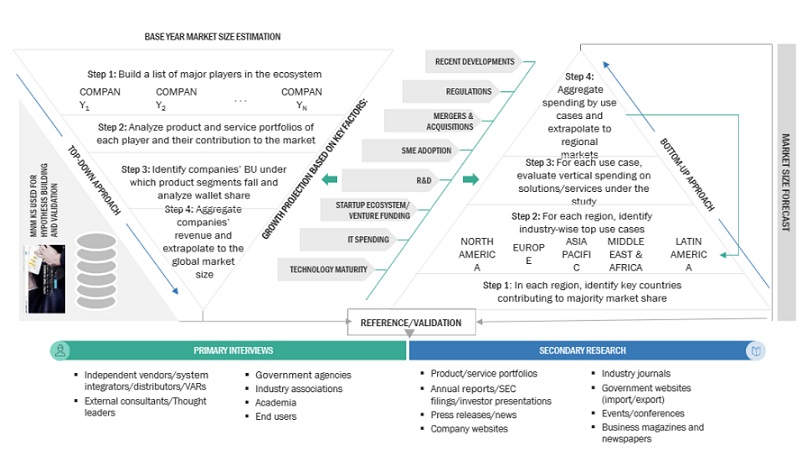
M2M Satellite Communication  Market Bottom Up Approach

To know about the assumptions considered for the study, Request for Free Sample Report

Data Triangulation

After arriving at the overall market size using the market size estimation processes as explained above, the market was split into several segments and subsegments. To complete the overall market engineering process and arrive at the exact statistics of each market segment and subsegment, data triangulation and market breakup procedures were employed, wherever applicable. The overall market size was then used in the top-down procedure to estimate the size of other individual markets via percentage splits of the market segmentation.


Market Definition

Machine-to-machine (M2M) satellite communication refers to the exchange of data between devices or systems through satellites, enabling remote and real-time communication. This technology enables seamless connectivity for applications such as IoT, asset tracking, and monitoring in areas with limited terrestrial infrastructure.

Stakeholders

  • Satellite Operators
  • Satellite Service Providers
  • Telecom Network Operators (TNOs)
  • Terrestrial-based M2M Service Providers
  • Satellite Equipment Manufacturers and Integrators
  • M2M satellite communication vendors
  • Business analysts
  • Technology providers
  • Internet Service Providers
  • Value Added Service (VAS) Providers/Manufacturers

Report Objectives

  • To define, describe, and predict the M2M satellite communication market by offering (hardware, software type and services), technology, vertical, and region
  • To provide detailed information related to major factors (drivers, restraints, opportunities, and industry-specific challenges) influencing the market growth
  • To analyze the micro markets with respect to individual growth trends, prospects, and their contribution to the total market
  • To analyze the opportunities in the market for stakeholders by identifying the high-growth segments of the market
  • To analyze opportunities in the market and provide details of the competitive landscape for stakeholders and market leaders
  • To forecast the market size of segments for five main regions: North America, Europe, Asia Pacific, Middle East & Africa, and Latin America
  • To profile key players and comprehensively analyze their market rankings and core competencies.
  • To analyze competitive developments, such as partnerships, new product launches, and mergers and acquisitions, in the market
  • To analyze the impact of recession across all the regions across the M2M satellite communication market.

Available Customizations

With the given market data, MarketsandMarkets offers customizations as per the company’s specific needs. The following customization options are available for the report:

Product Analysis

  • The product matrix provides a detailed comparison of the product portfolio of each company.

Geographic Analysis as per Feasibility

  • Further breakup of the North American M2M satellite communication Market
  • Further breakup of the European Market
  • Further breakup of the Asia Pacific Market
  • Further breakup of the Middle East & Africa Market
  • Further breakup of the Latin American M2M satellite communication Market

Company Information

  • Detailed analysis and profiling of additional market players (up to five)
Custom Market Research Services

We will customize the research for you, in case the report listed above does not meet with your exact requirements. Our custom research will comprehensively cover the business information you require to help you arrive at strategic and profitable business decisions.

Request Customization
Report Code
TC 2283
Published ON
Feb, 2024
Choose License Type
BUY NOW
  • SHARE
X
Request Customization
Speak to Analyst
Speak to Analyst
OR FACE-TO-FACE MEETING
PERSONALIZE THIS RESEARCH
  • Triangulate with your Own Data
  • Get Data as per your Format and Definition
  • Gain a Deeper Dive on a Specific Application, Geography, Customer or Competitor
  • Any level of Personalization
REQUEST A FREE CUSTOMIZATION
LET US HELP YOU!
  • What are the Known and Unknown Adjacencies Impacting the M2M Satellite Communication Market
  • What will your New Revenue Sources be?
  • Who will be your Top Customer; what will make them switch?
  • Defend your Market Share or Win Competitors
  • Get a Scorecard for Target Partners
CUSTOMIZED WORKSHOP REQUEST
+1-888-600-6441
  • Call Us
  • +1-888-600-6441 (Corporate office hours)
  • +1-888-600-6441 (US/Can toll free)
  • +44-800-368-9399 (UK office hours)
CONNECT WITH US
ABOUT TRUST ONLINE
©2024 MarketsandMarkets Research Private Ltd. All rights reserved
DMCA.com Protection Status Website Feedback