
Manufactured Soil (Soil Blends & Mixes) Market by Type (Garden Soil, Soil Mix, Manure & Compost), Application (Cultivation, Lawns, Commercial Developments, Sports Fields, Green Spaces), Material Input, & by Region - Global Forecast to 2021
Market Segmentation
| Report Metrics | Details |
|
Market size available for years |
2016 - 2021 |
|
CAGR % |
6.7 |
Top 10 companies in Manufactured Soil (Soil Blends & Mixes) Market


The manufactured soils market is projected to reach USD 7.8 Billion by 2021, at a CAGR of 6.7% from 2016 to 2021. The growth of this market is attributed to the increasing demand for organic products, the increasing global population, improved yield & productivity, and increasing trend towards modern farming practices such as controlled agriculture and urban farming. Increase in demand for organic foods, swift growth in the urban farming techniques, increased demand for horticulture along with the promotion and aid by government agencies have fueled the usage of soil blends & mixes among the modern agricultural practices. The years considered for the study are:
- Base Year: 2015
- Estimated Year: 2016
- Projected Year: 2021
- Forecast Period: 2016 to 2021
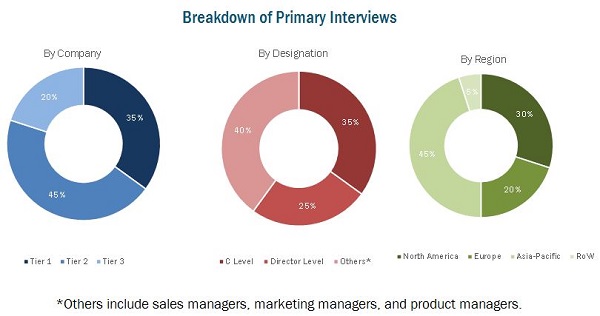
This report includes the estimation of market sizes for value (USD million). Top-down and bottom-up approaches have been used to estimate and validate the size of the manufactured soils market and to estimate the size of various other dependent submarkets. Key players in the market have been identified through secondary research, and their market share has been determined through primary and secondary research. All percentage shares, splits, and breakdowns have been determined using secondary sources and were verified through primary sources.
To know about the assumptions considered for the study, download the pdf brochure
Market Ecosystem
The manufactured soil value chain includes material input manufacturers that provides with soil, compost, sand, coir fiber, perlite, and vermiculite among others. Manufactured soil manufacturers include The Scotts Miracle-Gro Company (U.S.), Boxley Materials Company Inc. (U.S.), Resource Management Inc. (U.S.), and Boughton Loam & Turf Management Limited (U.K.). Other players include Casella Organics, Inc. (U.S.) Resource Management Inc. (U.S.), and Tim O�Hare Associates LLP (U.K.). Furthermore, the products manufactured by these companies are sold by either the manufacturers or through there dedicated distribution channels.
Target Audience:
- Raw material and ingredients suppliers
- Suppliers
- Agriculture institutes
- R&D institutes
- Technology providers
- Manufactured soil manufacturers/suppliers
- Raw material manufacturers/suppliers
- Intermediary suppliers
- Wholesalers
- Dealers
- Consumers
- Retailers
- Farmers
- Research institutes and organizations
- Government bodies, venture capitalists, and private equity firms
�The study answers several questions for stakeholders, primarily which market segments to focus on in the next two to five years for prioritizing efforts and investments.�
Get online access to the report on the World's First Market Intelligence Cloud
Request Sample Scope of the Report

On the basis of Type, the manufactured soils market has been segmented into:
- Garden soil
- Soil Mix
- Manure & compost
- Others (turf sand and organic soil improver)
On the basis of Application, the manufactured soils market has been segmented into:
- Cultivation
- Lawns
- Commercial developments
- Sports fields
- Green spaces
On the basis of Material Input, the manufactured soils market has been segmented into:
- Soil
- Compost
- Sand
- Coir fiber
- Perlite
- Vermiculite
- Others (horticulture sand and peat moss)
On the basis of Region, the manufactured soils market has been segmented into:
- North America
- Europe
- Asia-Pacific
- RoW (Brazil, Argentina, and South Africa)
Available Customizations
With the given market data, MarketsandMarkets offers customizations according to the client-specific scientific needs.
The following customization options are available for the report:
Regional Analysis
- Further breakdown of the Rest of Europe manufactured soils market into Turkey, Poland, the Netherlands, and Greece
- Further breakdown of the Rest of Asia-Pacific manufactured soils market into Indonesia, Myanmar, and Vietnam
- Further breakdown of the Rest of the World manufactured soils market into Paraguay, Uruguay, and Bolivia
Company Information
- Detailed analysis and profiling of additional market players (up to five)
The global manufactured soils market is projected to reach USD 7.8 Billion by 2021, at a CAGR of 6.7% from 2016 to 2021. The demand for manufactured soils is also fueled because major agriculture input firms intend to continue and preserve their market share; governmental regulatory bodies are actively participating in environmental conservation issues; growers are looking for fresh ways to generate higher yield; and there is an increased demand for agricultural products that ensure overall wellness of consumers.
In the global market for manufactured soils, garden soil dominates the manufactured soils market. There are various types of garden soils present in the market which include structured soil, moisture retentive soil, bedding soil, and lightweight soil. Soil mixes usually consist of different compositions of elements blended in a proportion suitable for the selected crop. The application of soil mixes in agriculture is constantly increasing with different soil mixes being used for different crop types. The growing market for lawns and garden consumables also plays an important role in driving the market for soil mixes across the globe.
The cultivation segment dominated the manufactured soils market in terms of application. The major factor driving the cultivation application is the increasing amount of organic farming practices across the globe, which largely uses manufactured soil mixes and blends for the same. The growing use of manufactured soils in controlled agriculture, along with the growing market for lawns and garden consumables, has played a significant role in factoring the growth of the manufactured soils market. The presence of major players from the manufactured soils market in North America and Europe have played a major role in driving the market in these regions.
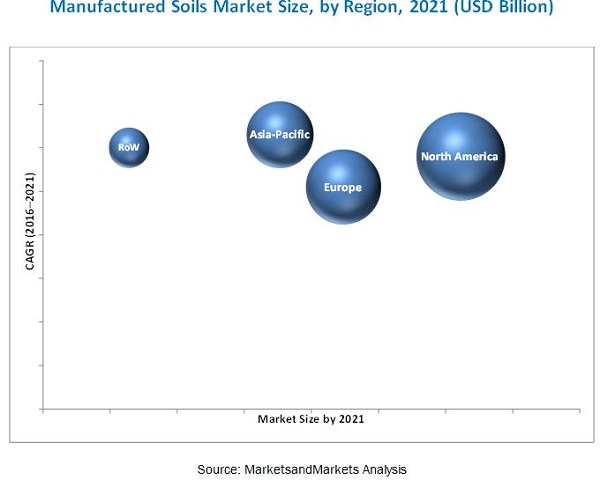
The global manufactured soils market is dominated by North America and is closely followed by Europe.
The presence of major players from the manufactured soils market in North America and Europe has played a major role in driving the market in these regions. Soil mixes can be customized based on the requirements of the crop considered, and its growing number of applications has made it the fastest-growing manufactured soil type across the globe. The Asia-Pacific region is projected to be the fastest-growing market for manufactured soils and is projected to grow at the highest CAGR during the forecast period. The rising global consumption of lawn and garden consumable products is driving the manufactured soils market.
Lack of awareness of manufactured soil products is leading to lower penetration of manufactured soils, and acts as a key restraint in the growth of the market. The saturated markets of developed economies compel manufacturers of manufactured soil blends and mixes to search for untapped markets and find new consumer bases. This requires substantial investments in many aspects of business expansion, especially when it comes to the establishment of new facilities in developing countries. Apart from internal investments in manufacturing facilities, manufacturers need to spend heavily on the development of an efficient supply chain management and storage of raw materials and finished goods. Though low raw material prices and labor costs benefit the manufactured soil producing companies, the investment costs for infrastructural development pose a bigger challenge for them.
Players in this market have adopted various strategies to increase their global footprint and their market share. Agreements & contracts, partnerships, new product launches, expansions & investments, and acquisitions are some of the key strategies adopted by players to achieve growth in the manufactured soils market. The global market for manufactured soils is dominated by top players such as The Scotts Miracle-Gro Company (U.S.), Boxley Materials Company Inc. (U.S.), Resource Management Inc. (U.S.), and Boughton Loam & Turf Management Limited (U.K.). Other players include Casella Organics, Inc. (U.S.) Resource Management Inc. (U.S.), and Tim O�Hare Associates LLP (U.K.).
To speak to our analyst for a discussion on the above findings, click Speak to Analyst
Table of Contents
1 Introduction (Page No. - 16)
1.1 Objectives of the Study
1.2 Market Definition
1.3 Market Scope
1.3.1 Markets Covered
1.3.2 Years Considered
1.4 Currency
1.5 Units
1.6 Stakeholders
2 Research Methodology (Page No. - 19)
2.1 Research Data
2.1.1 Secondary Data
2.1.1.1 Key Data From Secondary Sources
2.1.2 Primary Data
2.1.2.1 Key Data From Primary Sources
2.2 Factor Analysis
2.2.1 Introduction
2.2.2 Demand-Side Analysis
2.2.2.1 Increased Food Demand From the Ever-Growing Population
2.2.2.2 Growing Population and Urbanization
2.2.2.3 Shrinking Arable Land
2.2.2.4 Global Focus on Increasing Agricultural Output
2.2.3 Supply-Side Analysis
2.2.3.1 Research & Development
2.3 Market Size Estimation
2.4 Data Triangulation
2.5 Research Assumptions & Limitations
2.5.1 Assumptions
2.5.2 Research Limitations
3 Executive Summary (Page No. - 33)
4 Premium Insights (Page No. - 38)
4.1 Attractive Opportunities in the Manufactured Soil Market
4.2 Manufactured Soil Market: By Type
4.3 Manufactured Soil Market in North America
4.4 Manufactured Soil Market, By Material Input
4.5 Life Cycle Analysis: Manufactured Soil Market
5 Market Overview (Page No. - 42)
5.1 Introduction
5.2 Market Segmentation
5.3 Market Dynamics
5.3.1 Drivers
5.3.1.1 Growing Global Lawn and Garden Consumables Market
5.3.1.2 Growing Demand for Organic Farming Practices
5.3.1.3 Controlled Agriculture: Manufactured Soil Mixes in Greenhouses
5.3.1.4 Growing Market for Horticulture
5.3.2 Restraints
5.3.2.1 Lack of Awareness of Manufactured Soil Products
5.3.2.2 Low Adoption Rate
5.3.3 Opportunities
5.3.3.1 Innovations in Manufactured Soil Types
5.3.3.2 New Target Market: Asia-Pacific
5.3.3.3 Government Support and Initiatives
5.3.4 Challenges
5.3.4.1 Infrastructural Challenges in Developing Countries
6 Industry Trends (Page No. - 48)
6.1 Introduction
6.2 Supply Chain
6.3 Value Chain
6.4 Porter�s Five Forces Analysis: Manufactured Soil Market
6.4.1 Intensity of Competitive Rivalry
6.4.2 Bargaining Power of Buyers
6.4.3 Bargaining Power of Suppliers
6.4.4 Threat of Substitutes
6.4.5 Threat of New Entrants
6.5 Regulatory Framework
6.5.1 North America
6.5.2 Europe
6.5.3 Asia-Pacific
7 Manufactured Soil Market, By Brand (Page No. - 55)
7.1 Introduction
7.2 Miracle-Gro Organic Choice
7.3 Supersoil
7.4 Peaceful Valley Farm Supply
7.5 Ferry Morse Jiffy Mix
7.5.1 Hyponex
7.5.2 Black Gold
7.5.3 Fafard
7.5.4 Ultragrow
8 Manufactured Soil Market, By Type (Page No. - 57)
8.1 Introduction
8.2 Garden Soil
8.2.1 Garden Soil, By Sub-Type
8.2.2 Structured Soil
8.2.3 Moisture Retentive Soil
8.2.4 Lightweight Soil
8.2.5 Bedding Soil
8.3 Soil Mix
8.3.1 Soil Mix, By Sub-Type
8.3.2 Lawn Mix
8.3.3 Veggie Mix
8.4 Manure & Compost
8.4.1 Manure & Compost, By Sub-Type
8.4.2 Chicken Manure
8.4.3 Cow Manure
8.4.4 Mushroom Compost
8.5 Others
9 Manufactured Soil Market, By Material Input (Page No. - 76)
9.1 Introduction
9.2 Soil
9.3 Compost
9.4 Sand
9.5 Coir Fiber
9.6 Perlite
9.7 Vermiculite
9.8 Others
10 Manufactured Soil Market, By Application (Page No. - 86)
10.1 Introduction
10.2 Cultivation
10.3 Lawns
10.4 Commercial Developments
10.5 Sports Fields
10.6 Green Spaces
10.7 Others
11 Manufactured Soil Market, By Region (Page No. - 95)
11.1 Introduction
11.2 North America
11.2.1 U.S.
11.2.2 Canada
11.2.3 Mexico
11.3 Europe
11.3.1 Spain
11.3.2 Italy
11.3.3 France
11.3.4 Germany
11.3.5 U.K.
11.3.6 Rest of Europe
11.4 Asia-Pacific
11.4.1 China
11.4.2 India
11.4.3 Japan
11.4.4 Australia
11.4.5 Indonesia
11.4.6 Rest of Asia-Pacific
11.5 Rest of the World (RoW)
11.5.1 Brazil
11.5.2 Argentina
11.5.3 South Africa
11.5.4 Others in RoW
12 Competitive Landscape (Page No. - 145)
12.1 Overview
12.2 Competitive Situations & Trends
12.3 Product Mapping
12.4 Expansions & Investments
12.5 New Product Launches
12.6 Mergers & Acquisitions
13 Company Profiles (Page No. - 149)
(Company at A Glance, Recent Financials, Products & Services, Strategies & Insights, & Recent Developments)*
13.1 Introduction
13.2 The Scotts Miracle-GRO Company
13.3 Boxley Materials Company, Inc.
13.4 Casella Organics, Inc.
13.5 Resource Management, Inc. (RMI)
13.6 Tim O�hare Associates LLP
13.7 Peaceful Valley Farm & Garden Supply
13.8 B.D. White Top Soil Company Inc.
13.9 Jiffy International as
13.10 Boughton Loam & Turf Management Limited
13.11 London Rock Supplies Limited
*Details on Company at A Glance, Recent Financials, Products & Services, Strategies & Insights, & Recent Developments Might Not Be Captured in Case of Unlisted Companies.
14 Appendix (Page No. - 170)
14.1 Industry Insights From Experts
14.2 Discussion Guide
14.3 Knowledge Store: Marketsandmarkets� Subscription Portal
14.4 Introducing RT: Real-Time Market Intelligence
14.5 Available Customizations
14.6 Related Reports
List of Tables (138 Tables)
Table 1 Manufactured Soil Market Size, By Type, 2014-2021 (USD Million)
Table 2 Manufactured Soil Market Size, By Type, 2014-2021 (Kt)
Table 3 Garden Soil Market Size, By Region, 2014�2021 (USD Million)
Table 4 Garden Soil Market Size, By Region, 2014�2021 (Kt)
Table 5 Garden Soil Market Size, By Subtype, 2014�2021 (USD Million)
Table 6 Garden Soil Market Size, By Subtype, 2014�2021 (Kt)
Table 7 Structured Soil Market Size, By Region, 2014�2021 (USD Million)
Table 8 Structured Soil Market Size, By Region, 2014�2021 (Kt)
Table 9 Moisture Retentive Soil Market Size, By Region, 2014�2021 (USD Million)
Table 10 Moisture Retentive Soil Market Size, By Region, 2014�2021 (Kt)
Table 11 Lightweight Soil Market Size, By Region, 2014�2021 (USD Million)
Table 12 Lightweight Soil Market Size, By Region, 2014�2021 (Kt)
Table 13 Bedding Soil Market Size, By Region, 2014�2021 (USD Million)
Table 14 Bedding Soil Market Size, By Region, 2014�2021 (Kt)
Table 15 Soil Mix Market Size, By Region, 2014�2021 (USD Million)
Table 16 Soil Mix Market Size, By Region, 2014�2021 (Kt)
Table 17 Soil Mix Market Size, By Subtype, 2014�2021 (USD Million)
Table 18 Soil Mix Market Size, By Subtype, 2014�2021 (Kt)
Table 19 Lawn Mix Market Size, By Region, 2014�2021 (USD Million)
Table 20 Lawn Mix Market Size, By Region, 2014�2021 (Kt)
Table 21 Veggie Mix Market Size, By Region, 2014�2021 (USD Million)
Table 22 Veggie Mix Market Size, By Region, 2014�2021 (Kt)
Table 23 Manure & Compost Market Size, By Region, 2014�2021 (USD Million)
Table 24 Manure & Compost Market Size, By Region, 2014�2021 (Kt)
Table 25 Manure & Compost Market Size, By Subtype, 2014�2021 (USD Million)
Table 26 Manure & Compost Market Size, By Subtype, 2014�2021 (Kt)
Table 27 Chicken Manure Market Size, By Region, 2014�2021 (USD Million)
Table 28 Chicken Manure Market Size, By Region, 2014�2021 (Kt)
Table 29 Cow Manure Market Size, By Region, 2014�2021 (USD Million)
Table 30 Cow Manure Market Size, By Region, 2014�2021 (Kt)
Table 31 Mushroom Compost Market Size, By Region, 2014�2021 (USD Million)
Table 32 Mushroom Compost Market Size, By Region, 2014�2021 (Kt)
Table 33 Other Manufactured Soil Market Size, By Region, 2014�2021 (USD Million)
Table 34 Other Manufactured Soil Market Size, By Region, 2014�2021 (Kt)
Table 35 Manufactured Soil Market Size, By Material Input, 2014-2021 (USD Million)
Table 36 Soil Market Size, By Region, 2014�2021 (USD Million)
Table 37 Soil Market Size, By Region, 2014�2021 (Kt)
Table 38 Compost Market Size, By Region, 2014�2021 (USD Million)
Table 39 Compost Market Size, By Region, 2014�2021 (Kt)
Table 40 Sand Market Size, By Region, 2014�2021 (USD Million)
Table 41 Sand Market Size, By Region, 2014�2021 (Kt)
Table 42 Coir Fiber Market Size, By Region, 2014�2021 (USD Million)
Table 43 Coir Fiber Market Size, By Region, 2014�2021 (Kt)
Table 44 Perlite Market Size, By Region, 2014�2021 (USD Million)
Table 45 Perlite Market Size, By Region, 2014�2021 (Kt)
Table 46 Vermiculite Market Size, By Region, 2014�2021 (USD Million)
Table 47 Vermiculite Market Size, By Region, 2014�2021 (Kt)
Table 48 Manufactured Soil Market Size for Other Material Inputs, By Region, 2014�2021 (USD Million)
Table 49 Manufactured Soil Market Size for Other Material Inputs, By Region, 2014�2021 (Kt)
Table 50 Manufactured Soil Market Size, By Application, 2014�2021 (USD Million)
Table 51 Manufactured Soil Market Size, By Application, 2014�2021 (Kt)
Table 52 Cultivation Market Size, By Region, 2014�2021 (USD Million)
Table 53 Cultivation Market Size, By Region, 2014�2021 (Kt)
Table 54 Lawns Market Size, By Region, 2014�2021 (USD Million)
Table 55 Lawns Market Size, By Region, 2014�2021 (Kt)
Table 56 Commercial Developments Market Size, By Region, 2014�2021 (USD Million)
Table 57 Commercial Developments Market Size, By Region, 2014�2021 (Kt)
Table 58 Sports Fields Market Size, By Region, 2014�2021 (USD Million)
Table 59 Sports Fields Market Size, By Region, 2014�2021 (Kt)
Table 60 Green Spaces Market Size, By Region, 2014�2021 (USD Million)
Table 61 Green Spaces Market Size, By Region, 2014�2021 (Kt)
Table 62 Other Applications Market Size, By Region, 2014�2021 (USD Million)
Table 63 Other Applications Market Size, By Region, 2014�2021 (Kt)
Table 64 Manufactured Soil Market Size, By Region, 2014�2021 (USD Million)
Table 65 Manufactured Soil Market Size, By Region, 2014�2021 (Kt)
Table 66 North America: Manufactured Soil Market Size, By Application, 2014�2021 (USD Million)
Table 67 North America: Manufactured Soil Market Size, By Application, 2014�2021 (Kt)
Table 68 North America: Manufactured Soil Market Size, By Type, 2014�2021 (USD Million)
Table 69 North America: Manufactured Soil Market Size, By Type, 2014�2021 (Kt)
Table 70 North America: Manufactured Soil Market Size, By Material Input, 2014�2021 (USD Million)
Table 71 North America: Manufactured Soil Market Size, By Material Input, 2014�2021 (Kt)
Table 72 North America: Manufactured Soil Market Size, By Country, 2014�2021 (USD Million)
Table 73 North America: Manufactured Soil Market Size, By Country, 2014�2021 (USD Million)
Table 74 U.S.: Manufactured Soil Market Size, By Application, 2014�2021 (USD Million)
Table 75 U.S.: Manufactured Soil Market Size, By Application, 2014�2021 (Kt)
Table 76 Canada: Manufactured Soil Market Size, By Application, 2014�2021 (USD Million)
Table 77 Canada: Manufactured Soil Market Size, By Application, 2014�2021 (Kt)
Table 78 Mexico: Manufactured Soil Market Size, By Application, 2014�2021 (USD Million)
Table 79 Mexico: Manufactured Soil Market Size, By Application, 2014�2021 (Kt)
Table 80 Europe: Manufactured Soil Market Size, By Application, 2014�2021 (USD Million)
Table 81 Europe: Manufactured Soil Market Size, By Application, 2014�2021 (Kt)
Table 82 Europe: Manufactured Soil Market Size, By Type, 2014�2021 (USD Million)
Table 83 Europe: Manufactured Soil Market Size, By Type, 2014�2021 (Kt)
Table 84 Europe: Manufactured Soil Market Size, By Material Input, 2014�2021 (USD Million)
Table 85 Europe: Manufactured Soil Market Size, By Material Input, 2014�2021 (Kt)
Table 86 Europe: Manufactured Soil Market Size, By Country, 2014�2021 (USD Million)
Table 87 Europe: Manufactured Soil Market Size, By Country, 2014�2021 (Kt)
Table 88 Spain: Manufactured Soil Market Size, By Application, 2014�2021 (USD Million)
Table 89 Spain: Manufactured Soil Market Size, By Application, 2014�2021 (Kt)
Table 90 Italy: Manufactured Soil Market Size, By Application, 2014�2021 (USD Million)
Table 91 Italy: Manufactured Soil Market Size, By Application, 2014�2021 (Kt)
Table 92 France: Manufactured Soil Market Size, By Application, 2014�2021 (USD Million)
Table 93 France: Manufactured Soil Market Size, By Application, 2014�2021 (Kt)
Table 94 Germany: Manufactured Soil Market Size, By Application, 2014�2021 (USD Million)
Table 95 Germany: Manufactured Soil Market Size, By Application, 2014�2021 (Kt)
Table 96 U.K.: Manufactured Soil Market Size, By Application, 2014�2021 (USD Million)
Table 97 U.K.: Manufactured Soil Market Size, By Application, 2014�2021 (Kt)
Table 98 Rest of Europe: Manufactured Soil Market Size, By Application, 2014�2021 (USD Million)
Table 99 Rest of Europe: Manufactured Soil Market Size, By Application, 2014�2021 (Kt)
Table 100 Asia-Pacific: Manufactured Soil Market Size, By Application, 2014-2021 (USD Million)
Table 101 Asia-Pacific: Manufactured Soil Market Size, By Application, 2014-2021 (Kt)
Table 102 Asia-Pacific: Manufactured Soil Market Size, By Type, 2014-2021 (USD Million)
Table 103 Asia-Pacific: Manufactured Soil Market Size, By Type, 2014-2021 (Kt)
Table 104 Asia-Pacific: Manufactured Soil Market Size, By Material Input, 2014-2021 (USD Million)
Table 105 Asia-Pacific: Manufactured Soil Market Size, By Material Input, 2014-2021 (Kt)
Table 106 Asia-Pacific: Manufactured Soil Market Size, By Country, 2014-2021 (USD Million)
Table 107 Asia-Pacific: Manufactured Soil Market Size, By Country, 2014-2021 (Kt)
Table 108 China: Manufactured Soil Market Size, By Application, 2014-2021 (USD Million)
Table 109 China: Manufactured Soil Market Size, By Application, 2014-2021 (Kt)
Table 110 India: Manufactured Soil Market Size, By Application, 2014-2021 (USD Million)
Table 111 India: Manufactured Soil Market Size, By Application, 2014-2021 (Kt)
Table 112 Japan: Manufactured Soil Market Size, By Application, 2014-2021 (USD Million)
Table 113 Japan: Manufactured Soil Market Size, By Application, 2014-2021 (Kt)
Table 114 Australia: Manufactured Soil Market Size, By Application, 2014-2021 (USD Million)
Table 115 Australia: Manufactured Soil Market Size, By Application, 2014-2021 (Kt)
Table 116 Indonesia: Manufactured Soil Market Size, By Application, 2014-2021 (USD Million)
Table 117 Indonesia: Manufactured Soil Market Size, By Application, 2014-2021 (Kt)
Table 118 Rest of Asia-Pacific: Manufactured Soil Market Size, By Application, 2014-2021 (USD Million)
Table 119 Rest of Asia-Pacific: Manufactured Soil Market Size, By Application, 2014-2021 (Kt)
Table 120 RoW: Manufactured Soil Market Size, By Application, 2014-2021 (USD Million)
Table 121 RoW: Manufactured Soil Market Size, By Application, 2014-2021 (Kt)
Table 122 RoW: Manufactured Soil Market Size, By Type, 2014-2021 (USD Million)
Table 123 RoW: Manufactured Soil Market Size, By Type, 2014-2021 (Kt)
Table 124 RoW: Manufactured Soil Market Size, By Material Input, 2014-2021 (USD Million)
Table 125 RoW: Manufactured Soil Market Size, By Material Input, 2014-2021 (Kt)
Table 126 RoW: Manufactured Soil Market Size, By Country, 2014-2021 (USD Million)
Table 127 RoW: Manufactured Soil Market Size, By Country, 2014-2021 (Kt)
Table 128 Brazil: Manufactured Soil Market Size, By Application, 2014-2021 (USD Million)
Table 129 Brazil: Manufactured Soil Market Size, By Application, 2014-2021 (Kt)
Table 130 Argentina: Manufactured Soil Market Size, By Application, 2014-2021 (USD Million)
Table 131 Argentina: Manufactured Soil Market Size, By Application, 2014-2021 (Kt)
Table 132 South Africa: Manufactured Soil Market Size, By Application, 2014-2021 (USD Million)
Table 133 South Africa: Manufactured Soil Market Size, By Application, 2014-2021 (Kt)
Table 134 Others in RoW: Manufactured Soil Market Size, By Application, 2014-2021 (USD Million)
Table 135 Others in RoW: Manufactured Soil Market Size, By Application, 2014-2021 (Kt)
Table 136 Expansions & Investments
Table 137 New Product Launches
Table 138 Mergers & Acquisitions
List of Figures (37 Figures)
Figure 1 Manufactured Soil Market: Research Design
Figure 2 Growing Population to Contribute to Double-Digit Growth of Food Demand By 2030
Figure 3 Global Population Dynamics: Rising Urban Population, 1950�2030 (Percent)
Figure 4 Arable Land Per Capita (1960-2030)
Figure 5 Market Size Estimation Methodology: Bottom-Up Approach
Figure 6 Market Size Estimation Methodology: Top-Down Approach
Figure 7 Data Triangulation
Figure 8 Soil Mix Segment to Exhibit Fastest Growth From 2016 to 2021 (USD Million)
Figure 9 Commercial Development is Projected to Be Fastest Growing Market During the Forecast Period (2016-2021)
Figure 10 Soil Segment Held the Largest Share Among the Various Material Inputs Used in 2015
Figure 11 Manufactured Soil Market Share (Value), By Region, 2015: Asia-Pacific is Projected to Be the Fastest-Growing Between 2016 and 2021
Figure 12 Attractive Opportunities in the Manufactured Soil Market, 2016-2021
Figure 13 Soil Mix Segment is Expected to Be the Fastest-Growing By Type, During the Forecast Period (2015-2021)
Figure 14 Cultivation Segment to Capture Largest Share in North American Manufactured Soil Market in 2016
Figure 15 Soil Segment to Dominate the Manufactured Soil Market During the Forecast Period (2015-2021)
Figure 16 Manufactured Soil Market in Asia-Pacific Region is Experiencing High Growth
Figure 17 Manufactured Soil: Market Dynamics
Figure 18 Supply Chain for the Manufactured Soil Market
Figure 19 Value Chain Analysis for Manufactured Soil Market
Figure 20 Porter�s Five Forces Analysis � Manufactured Soil Market
Figure 21 Soil Mix Segment to Exhibit Highest Growth in the Manufactured Soil Market From 2016 to 2021
Figure 22 The Soil Segment Expected to Dominate the Manufactured Soil Market From 2016 to 2021
Figure 23 Cultivation Application Projected to Dominate the Manufactured Soil Market From 2016 to 2021
Figure 24 Manufactured Soil Market (Value), Geographic Snapshot, 2016�2021
Figure 25 North America: Manufactured Soil Market Snapshot
Figure 26 Asia-Pacific: Manufactured Soil Market Snapshot
Figure 27 Key Companies Preferred Expansions & Investments From 2012 to 2015
Figure 28 Expansions & Investments Have Led to Growth & Innovation (2012-2016)
Figure 29 Expansions & Investments: the Key Strategies, 2012-2016
Figure 30 Product Mapping of the Top Manufactured Soil Market Players, 2016
Figure 31 Geographical Revenue Mix of Top Five Players
Figure 32 The Scotts Miracle-GRO Company: Company Snapshot
Figure 33 The Scotts Miracle-GRO Company: SWOT Analysis
Figure 34 Boxley Materials Company, Inc.: SWOT Analysis
Figure 35 Resource Management, Inc.: SWOT Analysis
Figure 36 Tim O�hare Associates LLP: SWOT Analysis
Figure 37 Boughton Loam & Turf Management Limited: SWOT Analysis


Growth opportunities and latent adjacency in Manufactured Soil (Soil Blends & Mixes) Market