Marine Gensets Market by Vessel type (Commercial vessel, Defense vessel, & Offshore vessels), Fuel (Diesel fuel, Gas fuel, & Hybrid fuel), Rating (less than 1,000kW, 1,001-3,000 kW, 3,001-10,000kW & more than 10,000kW) & Region - Global Forecast to 2021


[157 Pages Report] The global marine gensets market was estimated at USD 4.35 Billion in 2015 and estimated to grow at a CAGR of 3.71% from 2016 to 2021. Rise in commercial vessels manufacturing and ship-building, are the major factors driving the growth in the marine gensets market.
The years considered for the study are as follows:
- Historical Year � 2014
- Base Year � 2015
- Estimated Year � 2016
- Projected Year � 2021
- Forecast Period � 2016 to 2021
2015 has been considered as the base year for company profiles. Whenever information was unavailable for the base year, the prior year has been considered.
Objectives of the Study
- To define, describe, and forecast the global market by vessel type, fuel, power, and region
- To provide detailed information regarding major factors influencing the growth of the market (drivers, restraints, opportunities, industry-specific challenges related to the market)
- To strategically analyze the market with respect to individual growth trends, current scenario, future prospects, and contribution of each segment to the market
- To strategically profile key players and comprehensively analyze their market shares and core competencies
- To track and analyze competitive developments such as contracts & agreements, expansions, new product launches, mergers & acquisitions, and joint ventures & collaborations in the market
Research Methodology
on organizations of companies, and organizations related to all the segments of this industry�s value chain. The points given below explain the research methodology. This research study involved the use of extensive secondary sources, directories, and databases such as Hoovers, Bloomberg Businessweek, Factiva, and OneSource to identify and collect information useful for a technical, market-oriented, and commercial study of the global marine gensets market. Primary sources are mainly industry experts from core and related industries, preferred suppliers, manufacturers, distributors, service providers, technology developers, standard and certificati
- Study of annual revenue and market developments of major players providing marine gensets
- Assessment of future trends and growth of these solutions
- Assessment of market with respect to the different fuel-type
- Study of market trends in various regions/countries by vessel typeof marine gensets in types of commercial vessels, offshore vessels, defense vessels and other vessel types.
- Study of growth strategies related to marine gensets for key players, across different regions
- Finalization of overall market sizes by triangulating the supply-side data, which includes product developments, supply chain, and annual revenues of companies manufacturing marine gensets across the globe
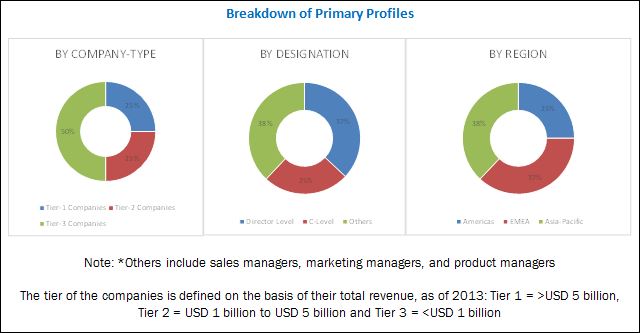
After arriving at the overall market size, the total market has been split into several segments and sub-segments. The figure given below shows the breakdown of primaries on the basis of company type, designation, and region, conducted during the research study.
To know about the assumptions considered for the study, download the pdf brochure
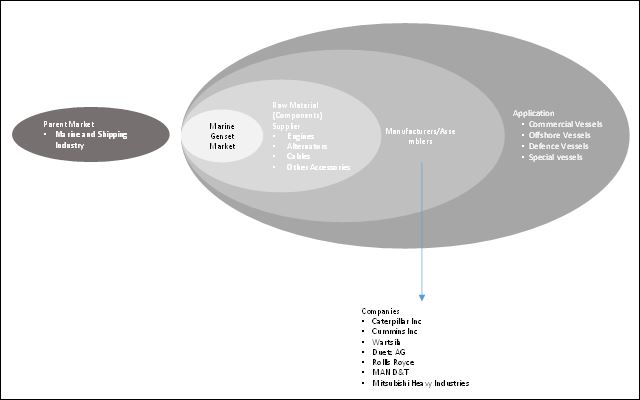
The ecosystem of the marine gensets market begins with raw material suppliers or ancillary parts, which include alternator and engines among others. In the later stage, manufacturing of marine gensets takes place where all ancillary parts are assembled. These gensets are then distributed to shipbuilding companies and installed for supplying power to the vessels.
Target audience
The report�s target audience includes:
- Marine gensets manufacturers
- Ship-building companies
- Marine gensets ancillary parts suppliers
- Government and Industry Associations
- Investment and Consulting Firms
Get online access to the report on the World's First Market Intelligence Cloud
- Easy to Download Historical Data & Forecast Numbers
- Company Analysis Dashboard for high growth potential opportunities
- Research Analyst Access for customization & queries
- Competitor Analysis with Interactive dashboard
- Latest News, Updates & Trend analysis
Request Sample Scope of the Report
:
Get online access to the report on the World's First Market Intelligence Cloud
- Easy to Download Historical Data & Forecast Numbers
- Company Analysis Dashboard for high growth potential opportunities
- Research Analyst Access for customization & queries
- Competitor Analysis with Interactive dashboard
- Latest News, Updates & Trend analysis

- Commercial vessels
- Offshore support vessels
- Defense vessels
- Others
- Diesel Fuel
- Gas Fuel
- Hybrid Fuel
- Others
- Up to 1,000 kW
- 1,001 HP to 3,000 kW
- 3,001 HP to 10,000 kW
- Above 10,001 kW
- North America
- Europe
- Asia-Pacific
- Latin America
- Middle East and Africa
By Vessel Type
By Fuel
By Power
By Region
Available Customizations:
With the given market data, MarketsandMarkets offers customizations as per the client�s specific needs. The following customization options are available for the report
Vendor Dive Matrix
Competitive Benchmarking of 25 players with respect to Product offering and Business strategy.
Regional Analysis
- Further breakdown of region/country-specific analysis
- Further breakdown of region based on sub-segment of application (by vessel type)
- Regional analysis of fuel type, and power
Company Information
- Detailed analysis and profiling of additional market players (Up to 5)
Power Rating-wise Analysis
- Further breakdown of HP range
- Detailed analysis as per speed of marine gensets for particular HP range
The global marine gensets market is forecasted to grow at a CAGR of 3.71% from 2016 to 2021 and reach a value of USD 5.40 Billion by 2021. The growth will be mainly driven by increased commercial vessels, and rise in ship-building activity. The new ship-buildings were dominated by dry bulk carriers and container ships in China and Japan with South Korea dominating in container ships and gas carrier.
Marine gensets are used in various vessel types such as commercial vessels, offshore support vessels, defense vessels and other vessel types. The report shows that there is high demand for commercial vessels, acts as a factors that will drive the growth of marine gensets market. The reports is further sub-segmented into commercial vessels by types such as bulkers, container ships, cargo vessels, LNG carriers, LPG carriers, pure car carriers, chemical carriers. The commercial vessel demand will grow because of maritime trade and increased world-wide demand for natural gas.
The report segments the market by fuel type. Diesel fuel dominates the marine gensets segment by fuel type. However, with stringent emission norms coming into effect, there will be an increase in the demand for cleaner-fuels such as IFO, MDO, and MGO..
The report segments the marine gensets market by power ratings. Up to 1,000 kW is the most prominent segment by power ratings. This range is used in commercial vessel and offshore vessel. Maritime trade accounted for nearly 90% of the global trade in 2015. Commercial vessels are used in maritime trade, which leads to an increase in market particularly for medium and low capacity.
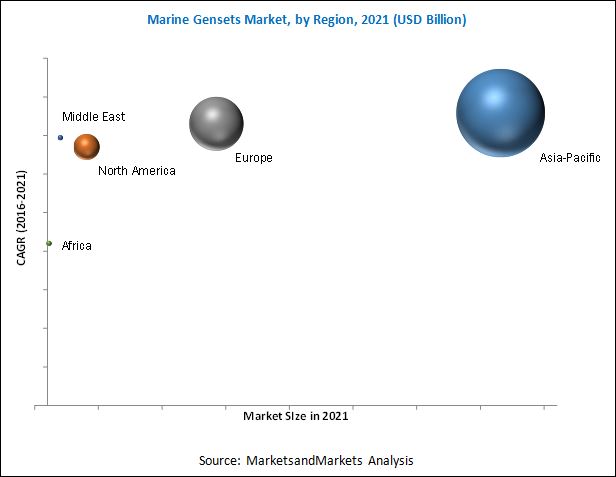
The report also segments the marine gensets market into six regions, namely, North America, Asia-Pacific, Europe, Middle East & Africa, and Latin America. Asia-Pacific region is expected to dominate the market and is also expected to be the fastest growing in the projected period. The market is mainly driven by the rise of ship-building industry, especially in China, South Korea, and Japan, which accounted for more than 80% of new-builds in 2015. China will be the fastest growing market for marine gensets with growing investments in the ship-building industry.
The marine gensets restraint mainly because of stringent emissions norms for diesel engine powered by marine gensets and decreased in oil and gas activity has resulted in reduction of FPSO and offshore vessel.
The marine gensets market is dominated by global players which include MAN Diesel & Turbo SE (Germany), W�rtsil� (Finland), Caterpillar, Inc. (U.S.), Mitsubishi Heavy Industries (Japan) and Rolls-Royce Power Systems AG (Germany). Key strategies adopted by various companies include contracts & agreements, new product launch, expansions, mergers & acquisitions and joint ventures. Contracts & agreements was the most commonly used strategy from 2014 to 2016, comprising of 57% of all developments, followed by new product launch which consisted of 24% of all developments during the same period.
To speak to our analyst for a discussion on the above findings, click Speak to Analyst
Table of Contents
1 Introduction (Page No. - 15)
1.1 Objectives of the Study
1.2 Market Definition
1.3 Market Scope
1.3.1 Markets Covered
1.3.2 Geographic Scope
1.3.3 Years Considered for the Study
1.4 Currency
1.5 Limitation
1.6 Stakeholders
2 Research Methodology (Page No. - 19)
2.1 Research Data
2.1.1 Secondary Data
2.1.1.1 Key Data From Secondary Sources
2.1.2 Primary Data
2.1.2.1 Key Data From Primary Sources
2.1.2.2 Key Industry Insights
2.1.2.3 Breakdown of Primaries
2.2 Market Size Estimation
2.2.1 Bottom-Up Approach
2.2.2 Top-Down Approach
2.3 Market Breakdown & Data Triangulation
2.4 Research Assumptions
2.4.1 Assumptions
3 Executive Summary (Page No. - 27)
3.1 Historical Backdrop
3.2 Current Scenario
3.3 Future Outlook
3.4 Conclusion
4 Premium Insights (Page No. - 32)
4.1 Market, By Capacity
4.2 Market, By Vessel Type
4.3 Asia-Pacific: the Largest Market During the Forecast Period
4.4 Marine Gensets, By Fuel
4.5 Life Cycle Analysis, By Region
5 Market Overview (Page No. - 37)
5.1 Introduction
5.2 Marine Gensets: Market Segmentation
5.3 Market Dynamics
5.3.1 Drivers
5.3.1.1 Increase in the Number of Container Ships & Gas Carrier Marine Freight Across the World
5.3.1.2 Rise in High Value Pleasure Vessels
5.3.2 Restraints
5.3.2.1 Stringent Emission Norms for Diesel-Engine Powered Marine Gensets
5.3.2.2 Decreased Oil & Gas Activity has Resulted in Reduction of Fpso and Offshore Vessels for the Oil & Gas Sector
5.3.3 Opportunities
5.3.3.1 Rising Demand for Hybrid-Fuel Powered Marine Gensets
5.3.4 Challenges
5.3.4.1 Competition From Low-Cost Vendors
5.3.4.2 Rise of Green Cell Shipping
6 Market, By Vessel Type (Page No. - 43)
6.1 Introduction
6.2 Commercial Vessels
6.3 Offshore Vessels
6.4 Defense Vessels
6.5 Other Vessels
7 Market, By Fuel (Page No. - 48)
7.1 Introduction
7.2 Diesel
7.3 Gas
7.4 Hybrid
8 Market, By Capacity (Page No. - 52)
8.1 Introduction
8.2 Up to 1,000kW Segment
8.3 1,001-3,000kW Segment
8.4 3,001-10,000kW Segment
8.5 Above 10,000kW Segment
9 Market, By Region (Page No. - 56)
9.1 Introduction
9.2 North America
9.2.1 By Capacity
9.2.2 By Vessel Type
9.2.3 By Fuel
9.2.4 By Country
9.2.4.1 The U.S.
9.2.4.2 Canada
9.2.4.3 Mexico
9.3 South America
9.3.1 By Capacity
9.3.2 By Vessel Type
9.3.3 By Fuel
9.3.4 By Country
9.3.4.1 Argentina
9.3.4.2 Brazil
9.4 Europe
9.4.1 By Capacity
9.4.2 By Vessel Type
9.4.3 By Fuel
9.4.4 By Country
9.4.4.1 Poland
9.4.4.2 Germany
9.4.4.3 The Netherlands
9.4.4.4 France
9.4.4.5 Italy
9.4.4.6 Rest of Europe
9.5 Asia-Pacific
9.5.1 By Capacity
9.5.2 By Vessel Type
9.5.3 By Fuel
9.5.4 By Country
9.5.4.1 China
9.5.4.2 Japan
9.5.4.3 India
9.5.4.4 Australia
9.5.4.5 South Korea
9.5.4.6 Rest of Asia-Pacific
9.6 Middle East
9.6.1 By Capacity
9.6.2 By Vessel Type
9.6.3 By Fuel
9.6.4 By Country
9.6.4.1 Saudi Arabia
9.6.4.2 UAE
9.6.4.3 Iran
9.6.4.4 Qatar
9.6.4.5 Rest of Middle East
9.7 Africa
9.7.1 By Capacity
9.7.2 By Vessel Type
9.7.3 By Fuel
9.7.4 By Country
9.7.4.1 Nigeria
9.7.4.2 South Africa
10 Competitive Landscape (Page No. - 88)
10.1 Overview
10.2 Competitive Situation & Trends
10.2.1 Contracts & Agreements
10.2.2 New Product/Technology Developments
10.2.3 Mergers & Acquisitions
10.2.4 Expansions
10.2.5 Joint Ventures & Partnerships and Others
11 Company Profile (Page No. - 95)
(Overview, Products & Services, Strategies & Insights, Developments and MnM View)*
11.1 Introduction
11.2 Cummins, Inc.
11.3 Mitsubishi Heavy Industries
11.4 Caterpillar, Inc.
11.5 Man Diesel & Turbo SE
11.6 Valley Power Systems, Inc.
11.7 Volvo Group
11.8 Kohler Co.
11.9 Deutz AG
11.10 Yanmar Co., Ltd.
11.11 ABB Ltd.
11.12 W�rtsil� Corporation
11.13 Dresser Rand
11.14 Daihatsu Diesel MFG. Co., Ltd.
11.15 Rolls-Royce Power System AG
11.16 Sol� Diesel
*Details on Overview, Products & Services, Strategies & Insights, Developments and MnM View Might Not Be Captured in Case of Unlisted Companies.
12 Appendix (Page No. - 149)
12.1 Insights of Industry Experts
12.2 Discussion Guide
12.3 Knowledge Store: Marketsandmarkets� Subscription Portal
12.4 Introducing RT: Real-Time Market Intelligence
12.5 Available Customizations
12.6 Related Reports
12.7 Author Details
List of Tables (71 Tables)
Table 1 Marine Gensets Market, By Vessel Type, 2014�2021 (USD Million)
Table 2 Commercial Vessel: Market, By Region, 2014�2021 (USD Million)
Table 3 Offshore Vessel: Market, By Region , 2014�2021 (USD Million)
Table 4 Defense Vessel: Market, By Region, 2014�2021(USD Million)
Table 5 Other Vessels: Market, By Region, 2014�2021(USD Million)
Table 6 Market, By Fuel, 2014�2021 (USD Million)
Table 7 Diesel: Market, By Region, 2014�2021 (USD Million)
Table 8 Gas: Market, By Region, 2014�2021 (USD Million)
Table 9 Hybrid: Market, By Region, 2014�2021 (USD Million)
Table 10 Marine Genset Market, By Capacity, 2014-2021 (USD Million)
Table 11 Market, 0�1,000kW, By Region, 2014�2021 (USD Million)
Table 12 Market, 1,001-3,000kW, By Region, 2014�2021 (USD Million)
Table 13 Market, 3,001-10,000kW, By Region, 2014�2021 (USD Million)
Table 14 Market, Above 10,000kW, By Region, 2014�2021 (USD Million)
Table 15 Marine Genset Market, By Region, 2014�2021 (USD Million)
Table 16 Diesel: Market, By Top Countries, 2014�2021 (USD Million)
Table 17 Gas: Market, By Top Countries, 2014�2021 (USD Million)
Table 18 Hybrid: Market, By Top Countries, 2014�2021 (USD Million)
Table 19 North America: Market, By Capacity, 2014�2021 (USD Million)
Table 20 North America: Market, By Vessel Type, 2014�2021 (USD Million)
Table 21 North America: Market, By Fuel, 2014�2021 (USD Million)
Table 22 North America: Market, By Country, 2014�2021 (USD Million)
Table 23 U.S.: Market, By Fuel, 2014�2021 (USD Million)
Table 24 Canada: Market, By Fuel, 2014�2021 (USD Million)
Table 25 Mexico: Market, By Fuel, 2014�2021 (USD Million)
Table 26 South America: Market, By Capacity, 2014�2021 (USD Million)
Table 27 South America: Market, By Vessel Type, 2014�2021 (USD Million)
Table 28 South America: Market, By Fuel, 2014�2021 (USD Million)
Table 29 South America: Market, By Country, 2014�2021 (USD Million)
Table 30 Argentina: Market, By Fuel, 2014�2021 (USD Million)
Table 31 Brazil: Market, By Fuel, 2014�2021 (USD Million)
Table 32 Europe: Market, By Capacity, 2014�2021 (USD Million)
Table 33 Europe: Market, By Vessel Type, 2014�2021 (USD Million)
Table 34 Europe: Market, By Fuel, 2014�2021 (USD Million)
Table 35 Europe: Market, By Country , 2014�2021 (USD Million)
Table 36 Poland: Market, By Fuel, 2014�2021 (USD Million)
Table 37 Germany: Market, By Fuel, 2014�2021 (USD Million)
Table 38 Netherlands: Market, By Fuel, 2014�2021 (USD Million)
Table 39 France: Market, By Fuel, 2014�2021 (USD Million)
Table 40 Italy: Market, By Fuel, 2014�2021 (USD Million)
Table 41 Rest of Europe: Market, By Fuel, 2014�2021 (USD Million)
Table 42 Asia-Pacific: Market, By Capacity, 2014�2021 (USD Million)
Table 43 Asia-Pacific: Market, By Vessel Type, 2014�2021 (USD Million)
Table 44 Asia-Pacific: Market, By Fuel, 2014�2021 (USD Million)
Table 45 Asia-Pacific: Market, By Country, 2014�2021 (USD Million)
Table 46 China: Market, By Fuel ,2014�2021 (USD Million)
Table 47 Japan: Market, By Fuel, 2014�2021 (USD Million)
Table 48 India: Market, By Fuel, 2014�2021 (USD Million)
Table 49 Australia: Market, By Fuel, 2014�2021 (USD Million)
Table 50 South Korea: Market, By Fuel, 2014�2021 (USD Million)
Table 51 Rest of the Asia-Pacific: Market, By Fuel, 2014�2021 (USD Million)
Table 52 Middle East: Market, By Capacity, 2014�2021 (USD Million)
Table 53 Middle East: Market, By Vessel Type, 2014�2021 (USD Million)
Table 54 Middle East: Market, By Fuel, 2014�2021 (USD Million)
Table 55 Middle East: Market, By Country, 2014�2021 (USD Million)
Table 56 Saudi Arabia: Market, By Fuel 2014�2021 (USD Million)
Table 57 UAE: Market, By Fuel, 2014�2021 (USD Million)
Table 58 Iran: Market, By Fuel, 2014�2021 (USD Million)
Table 59 Qatar: Market, By Fuel, 2014�2021 (USD Million)
Table 60 Rest of Middle East: Market, By Fuel, 2014�2021 (USD Million)
Table 61 Africa: Market, By Capacity, 2014�2021 (USD Thousand)
Table 62 Africa: Market, By Vessel Type, 2014�2021 (USD Thousand)
Table 63 Africa: Market, By Fuel, 2014�2021 (USD Thousand)
Table 64 Africa: Market, By Country, 2014�2021 (USD Thousand)
Table 65 Nigeria: Market, By Fuel, 2014�2021 (USD Thousands)
Table 66 South Africa: Market, By Fuel, 2014�2021 (USD Million)
Table 67 Contracts & Agreements, 2014-2016
Table 68 Product Developments, 2014�2015
Table 69 Mergers & Acquisitions, 2016
Table 70 Expansions, 2015
Table 71 Joint Ventures & Partnerships, 2013-2016
List of Figures (45 Figures)
Figure 1 Markets Covered: Marine Gensets Market
Figure 2 Market: Research Design
Figure 3 Breakdown of Primary Interviews: By Company Type, Designation, & Region
Figure 4 Market Size Estimation Methodology: Bottom-Up Approach
Figure 5 Market Size Estimation Methodology: Top-Down Approach
Figure 6 Data Triangulation Methodology
Figure 7 Asia�Pacific Was the Largest Market in 2015
Figure 8 Market, By Vessel Type, 2016 & 2021 (USD Million)
Figure 9 0-1000kW Segment is Expected to Account for the Maximum Share During the Forecast Period
Figure 10 Diesel Fuel is Expected to Be the Largest Service in 2021
Figure 11 Marine Genset Market Snapshot: Asia-Pacific is Expected to Exhibit the Highest Growth Rate in Next 5 Years
Figure 12 Top Market Development (2014�2016)
Figure 13 Attractive Market Opportunities in the Market
Figure 14 Commercial Vessels to Lead the Market During 2016�2021
Figure 15 Commercial Vessels Segment is Estimated to Dominate the Market By 2021
Figure 16 India and Germany are Expected to Have the Highest Growth Rate During the Forecast Period
Figure 17 Diesel Fuel is Expected to Dominate the Market During the Forecast Period
Figure 18 Asia-Pacific is in Growth Stage While Europe is Moving Towards Maturity
Figure 19 Marine Genset Market Segmentation: By Rated Capacity, Vessel Type, Fuel, & Region
Figure 20 Market Dynamics for Market
Figure 21 Growth By Shipping Vessel Type By Dead Weight Tonnage From 2015 to 2016
Figure 22 Regional Snapshot: Growth Rate of Market in Key Countries, From 2016 to 2021
Figure 23 The European Market is Expected to See Significant Growth From 2016 to 2021
Figure 24 Asia-Pacific: Regional Snapshot
Figure 25 Companies Adopted Contracts & Agreements and New Product/Service/Technology Developments to Capture the Market
Figure 26 Battle for Market Share: Contracts & Agreements Was the Key Strategy, 2013�2016
Figure 27 Caterpillar Accounted for the Maximum Share in the Market, 2015
Figure 28 Market Evaluation Framework: Contracts & Agreements, Expansions & Investments, and Joint Ventures & Partnerships Fueled the Growth of Companies From 2013 to 2016
Figure 29 Regional Revenue Mix of Top Five Players
Figure 30 Cummins, Inc.: Company Snapshot
Figure 31 Cummins, Inc.: SWOT Analysis
Figure 32 Mitsubishi Heavy Industries: Company Snapshot
Figure 33 Mitsubishi Heavy Industries: SWOT Analysis
Figure 34 Caterpillar, Inc.: Company Snapshot
Figure 35 Caterpillar Inc.: SWOT Analysis
Figure 36 Man Diesel & Turbo SE: Company Snapshot
Figure 37 Man Diesel & Turbo SE: SWOT Analysis
Figure 38 Volvo Group: Company Snapshot
Figure 39 Deutz Ag.: Company Snapshot
Figure 40 Yanmar Co., Ltd.: Company Snapshot
Figure 41 ABB Ltd.: Company Snapshot
Figure 42 W�rtsil� Corporation: Company Snapshot
Figure 43 W�rtsil� Corporation: SWOT Analysis
Figure 44 Daihatsu Diesel MFG. Co., Ltd.: Company Snapshot
Figure 45 Rolls-Royce Power System AG: Company Snapshot


Growth opportunities and latent adjacency in Marine Gensets Market