Medical Gas Market by Type (Oxygen, Nitrous Oxide, Carbon Dioxide, Gas Mixture, Vacuum System, Manifold, VIPR, Hose) Application (Respiratory, Anesthesia, Medical Imaging, Cryosurgery) End User (Hospital, Home Healthcare) - Forecast to 2023


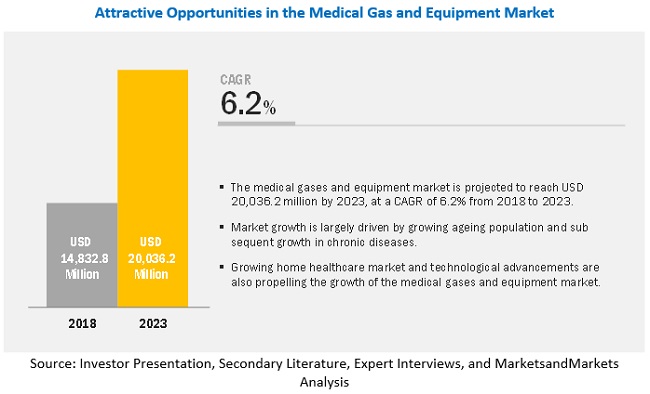
The global medical gas market is projected to reach USD 20.0 billion by 2023, at a CAGR of 6.2 %. The medical gas and equipment market has evolved significantly owing to various technological advancements. Factors such as increasing prevalence of chronic diseases, increasing incidence of respiratory diseases as a result of the high prevalence of tobacco use and rising pollution levels, rapid growth in the geriatric population, rising incidence of preterm births, and growing demand for home healthcare are expected to drive market growth in the coming years. Market expansion in emerging countries across APAC and technological advancements are also expected to present a wide range of opportunities for players in the market.
Medical Gas Market Growth Dynamics
Drivers: Increasing prevalence of chronic diseases
With changes in lifestyle and eating habits, the number of people suffering from obesity and related disorders across the globe has increased significantly in the last few years. The global prevalence of obesity nearly tripled between 1975 and 2016 According to the WHO, in 2016, more than 1.9 billion adults (18 years and older) were reportedly overweight, globally. Of these, over 650 million were found to be obese. Additionally, in 2016, ~340 million children and adolescents aged 5–19 were found to be overweight/obese across the globe.
Obesity is regarded as one of the major factors responsible for the increasing prevalence of chronic disorders, including heart disorders and diabetes. The WHO has stated that in the last two decades, there has been a significant increase in the prevalence of diabetes, heart diseases, and other non-communicable diseases, globally. According to the American Hospital Association, in 2015, ~149 million individuals in the US suffered from at least one chronic illness, such as hypertension, heart disease, and respiratory diseases. By 2030, this number is expected to reach 171 million. Since medical gases form a critical component of various long-term care treatments for several chronic conditions, including cardiovascular diseases, chronic respiratory diseases, and cancer, the rising prevalence of lifestyle diseases is expected to play a pivotal role in the growth of the medical gases and equipment market in the coming years.
Restraints: Global helium shortage
In the healthcare industry, helium is widely used for a number of applications, such as in medical imaging (to cool MRI systems) and as a carrier gas in GC and GC-MS procedures. Currently, medical applications such as MRI account for around 20% of the overall helium consumption. Globally, the US accounts for a majority share of helium production. Since the early 1960s, the US government stored helium in the federal helium reserve, which is managed by the US Bureau of Land Management. The helium taken out of the stockpiled federal helium reserve accounted for over one-third of the global helium supplies in 2012. However, in 2012, the US government planned to shut down the oldest helium reservoir in Texas; in 2013, a legislation was passed that overturned the decision to shut down the reserve. This legislation emphasized that helium from the reserve should be drawn down at a slower rate and at higher prices to facilitate a smoother transition and prevent the rapid decline in the price of helium in the global market. However, even with the availability of helium from the U.S., there is still approximately a 5–10% shortage of helium for its critical application areas in aerospace & defense and medical applications. Thus, helium prices in the global markets are expected to increase in the coming years. The helium shortage has compelled MRI equipment manufacturers to look for alternate gases to cool MRI systems. This can negatively affect the growth of the overall medical gases market.
Opportunities: Technological advancements
Technological advancements have provided a growing range of functionality options for various medical gas handling equipment used in hospital care and home care. As opposed to earlier equipment, the latest technologically advanced equipment provides a complementary system of monitoring and therapy delivery, coupled with educational content and communication flow between patients and healthcare providers. In addition, currently, various associated medical gas equipment are gradually being improved to offer a better quality of care. The development of lightweight and portable medical gas handling equipment has emerged as a boon to the growing home healthcare market. Currently, several companies offering medical gas equipment are focusing on developing smaller and portable gas delivery systems that can be carried by patients. The nature of the medical gas equipment market for home care, in particular, is continuously changing owing to the availability of smaller and less-expensive equipment in the market. Considering the growth opportunities in this market space, several players are focusing on launching advanced products. In 2017, Atlas Copco opened a manufacturing plant in the US to manufacture portable compressors and generators for the construction market as well as medical gas products for hospitals. Similarly, in 2016, GCE Healthcare launched the GCE Healthcare range of respiratory care products, including GCE Portable Oxygen Concentrators, Oxygen Conserving Devices, Oxygen Regulators, and High Purity Gas Control products, in the US and Canada. This development helped the company to expand its offerings for the home care therapy market in the US and Canada. In a competitive environment, technological innovation in terms of the development of lighter and more portable equipment for the homecare market and the integration of various types of gas handling equipment are expected to provide significant growth opportunities to market players.
Challenges: Changes in medical gas calibration standards
The medical gas industry is vulnerable to shifts in the Good Manufacturing Practice (GMP) policies established worldwide. Earlier, the FDA had come to an agreement with the medical gas industry that expiration dating and stability testing were not warranted for medical gases. As a result, most medical gas producers stopped putting an expiration date on their high-pressure and cryogenic liquid cylinders. However, the FDA now intends to reject the Compressed Gas Association’s (CGA's) exemption petition and re-establish the expiration dating requirement. The procedure of putting an expiration date on cylinders is difficult. As per the rule, expiration dates must be supported by accurate stability studies. This would require both medical gas manufacturers and medical gas packers and distributors to have a quality control team with them to establish the expiry date for each cylinder delivered to their clients. The Centers for Medicare & Medicaid Services (CMS) has declared that it will be mandating hospitals and health care facilities to meet the new conditions of participation, which include adherence to the 2012 edition of the National Fire Protection Association’s NFPA 99, Health Care Facilities Code. The Joint Commission and other accreditation agencies are following suit, and the Joint Commission has a working draft of new elements of performance for the medical gas and vacuum systems included in the environment of care section of the accreditation manual. In previous editions (2005), the code generally had been applied to new or altered facilities; however, in 2012, regulations established the importance of maintenance and periodic testing of medical gas and vacuum systems. Such legislative changes are adding to the operating costs and creating pricing pressure on medical gas manufacturers and distributors. This, in turn, is expected to adversely affect the profit margin of medical gas and equipment manufacturers and medical gas distributors.
By pure gases type, the oxygen segment is expected to grow at the highest growth rate during the forecast period
Among the type of pure gases used in the medical gas and equipment market, the oxygen segment is expected to grow at the highest CAGR during the forecast period. Growth in this segment can mainly be attributed to the presence of a large patient base suffering from respiratory diseases and the increasing number of patients undergoing emergency medical care.
By form of delivery, the pure gases in high-pressure cylinders segment to record the highest CAGR during the forecast period
The pure gases in high-pressure cylinders is expected to dominate the market in the coming years. This is mainly due to the widespread use of these devices in home healthcare setups and hospitals. Many of the major players in the medical gases and equipment market also offer products in high-pressure cylinders.
By medical gas mixtures type, the therapeutic applications segment to accounted for the largest share of the market
On the basis of type, the lung diffusion mixtures segment accounted for the largest share of the medical gas mixtures market in 2017. This can primarily be attributed to the increase in the number of chronic diseases, the high proportion of untreated patients, and the growing aging population.
By application, the lung diffusion mixtures segment to accounted for the largest share of the market
Based on applications, the therapeutic applications segment accounted for the highest share of the medical gases and equipment market in 2017. This is mainly due to the high prevalence of respiratory and cardiovascular diseases, which has resulted in increased consumption of medical gases and equipment.
By end user, the hospitals segment accounted for the largest share of the market
Based on end users, the hospitals segment accounted for the largest share of the medical gases and equipment market in 2017. This is mainly due to the high utilization of medical gases and equipment by hospitals due to the large patient pool.
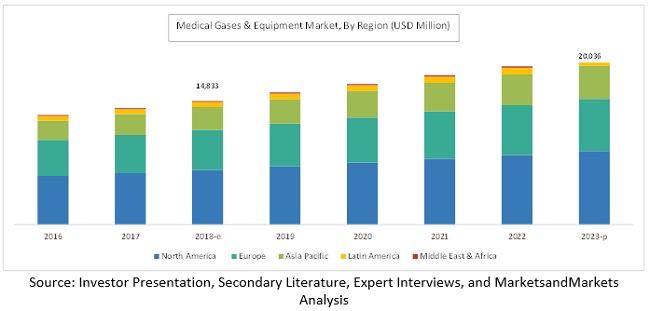
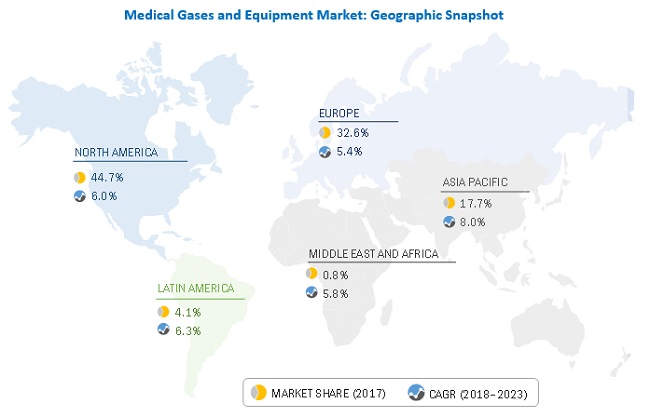
North America to account for the largest market size during the forecast period.
North America is expected to hold the largest market size in the medical gases and equipment market during the forecast period, followed by the European region. On the other hand, the Asia Pacific market is expected to witness the highest growth during the forecast period. The rapid growth in the developing healthcare industry across China and India is expected to offer significant growth opportunities for players operating in this market during the forecast period. In addition, factors such as increasing incidence of respiratory diseases as well as growth in the healthcare infrastructure and the per capita income in this region are also expected to drive the growth of the medical gases and equipment market in this region.
Get online access to the report on the World's First Market Intelligence Cloud
- Easy to Download Historical Data & Forecast Numbers
- Company Analysis Dashboard for high growth potential opportunities
- Research Analyst Access for customization & queries
- Competitor Analysis with Interactive dashboard
- Latest News, Updates & Trend analysis
Request Sample Scope of the Report
Get online access to the report on the World's First Market Intelligence Cloud
- Easy to Download Historical Data & Forecast Numbers
- Company Analysis Dashboard for high growth potential opportunities
- Research Analyst Access for customization & queries
- Competitor Analysis with Interactive dashboard
- Latest News, Updates & Trend analysis

|
Report Metric |
Details |
|
Market size available for years |
2016–2023 |
|
Base year considered |
2017 |
|
Forecast period |
2018–2023 |
|
Forecast units |
Value (USD) |
|
Segments covered |
Type, Application, End User, and Region |
|
Geographies covered |
North America, Europe, Asia Pacific, Latin America, and the Middle East and Africa |
|
Companies covered |
Air Products and Chemicals, Inc. (US), Linde Group (Germany), Air Liquide (France), Praxair, Inc. (US), Taiyo Nippon Sanso Corp. (Japan), SOL SpA (Italy), Atlas Copco (Sweden), Messer Group GmbH (Germany), and GCE Holding AB (Sweden) |
The research report categorizes the medical gases and equipment market to forecast the revenues and analyze the trends in each of the following sub-segments:
By Type
-
Medical Gas
-
Pure Medical Gases, By Type
- Oxygen
- Carbon Dioxide
- Nitrous Oxide
- Nitrogen
- Medical Air
- Helium
-
Pure Medical Gases, By Form of Delivery
- High Pressure Cylinders
- Liquid Tanks
- Bulk Delivery
-
Medical Gas Mixtures
- Blood-gas Mixtures
- Lung Diffusion Mixtures
- Nitrous oxide-oxygen Mixtures
- Carbon dioxide-oxygen Mixtures
- Laser-gas Mixtures
- Aerobic Mixtures
- Anaerobic Mixtures
- Ethylene Oxide
- Helium-oxygen Mixtures
-
Pure Medical Gases, By Type
-
Medical gas equipment
-
Equipment Accessories
- Hoses
- Manifolds
- Regulators
- Flowmeters
- Suction Regulators
- Vacuum Systems
- Outlets
- Monitoring Systems
- Valve with Integrated Pressure Regulator
- Medical Air Compressors
- Cryogenic Products
- Gas Delivery Systems
-
Equipment Accessories
By Application
-
Therapeutic
- Respiratory Diseases
- Cardiovascular Diseases
- Anesthesia
- Cryosurgery
- Others
-
Diagnostics
- Medical Imaging
- General laboratory Use
-
Pharmaceutical manufacturing and research
- Drug Discovery
- Process Development
- Pharmaceutical Manufacturing
- Quality Control
- Other Therapeutic Applications (Tissue and Platelet Preservation)
By End User
- Hospitals
- Home Healthcare
- Pharmaceutical and Biopharmaceutical Companies
- Diagnostic and Research Laboratories
- Academic Institutes and Research Institutes
By Region
-
North America
- US
- Canada
-
Europe
- Germany
- UK
- France
- Italy
- Spain
- Rest of Europe
-
Asia Pacific
- China
- Japan
- India
- Australia
- South Korea
- Rest of Asia Pacific
-
Latin America
- Brazil
- Mexico
- Argentina
- Rest of Latin America
- Middle East and Africa
Key Market Players
- The Linde Group (Germany)
- Air Liquide (France)
- Air Products and Chemicals, Inc. (US)
- Praxair, Inc. (US)
The Linde Group (Germany) dominated the global medical gases and equipment market in 2017. The company has a diversified product portfolio, which includes a wide range of medical gases and equipment such as medical oxygen, nitrous oxide, medical nitrous oxide/oxygen mixtures, hospital equipment for hospitals, and home care and emergency care services. Linde Group has a strong presence in more than 100 countries through its strong manufacturing and distribution facilities, which enables it to cater to a large customer base across the globe. Furthermore, in order to gain a competitive edge over other players in this market, the company focuses on acquisitions of similar players and in strengthening and streamlining its product portfolio for the healthcare industry. For instance, in 2017, Linde and Praxair, Inc. entered into a definitive business combination agreement (BCA) to increase presence in all key geographies and end-markets, which would result in a more diverse and balanced global portfolio as well as increased exposure to long-term macroeconomic growth trends.
Recent Developments
- In 2018, Air Liquide acquired EOVE (France) to increase its presence in the home healthcare market. EOVE is a startup company specialized in the manufacturing of ventilators for home-based patients suffering from chronic respiratory failure.
- In 2018, GCE introduced MediVitop, a new One-Knob Cylinder Valve with Integrated Pressure Regulator.
- In 2018, Ceodeux Meditec launched ALPIFLOW, a next-generation flow meter with over ten years lifetime without additional maintenance. The product is attached directly to the Ceodeux Meditec ALPICONNECT or ALPINOX and MINIOX to regulate oxygen-flow from the hospital pipeline system and from portable oxygen cylinders.
- In 2018, Atlas Copco opened an expanded innovation center in Bretten, Germany to meet growing customer demand for testing and developing innovative joining technologies.
- In 2018, Linde entered into an agreement with Messer Group and CVC Capital Partners Fund VII to sell the majority of Linde’s gases business in North America and certain business activities in South America.
Critical questions the report answers:
- Where will all these developments take the industry in the long term?
- What are the upcoming trends in the medical gases and equipment market?
- Which segment provides the most opportunity for growth?
- Who are the leading vendors operating in this market?
- What are the opportunities for new market entrants?
Frequently Asked Questions (FAQ):
How big is the Medical Gas and Equipment Market?
Medical Gas and Equipment Market worth $20.04 billion by 2023.
What is the growth rate of Medical Gas and Equipment Market?
Medical Gas and Equipment Market grows at a CAGR of 6.2% during the forecast period.
To speak to our analyst for a discussion on the above findings, click Speak to Analyst
Table of Contents
1 Medical Gas Market: Introduction (Page No. - 30)
1.1 Objectives of the Study
1.2 Market Definition
1.3 Market Scope
1.3.1 Markets Covered
1.3.2 Years Considered for the Study
1.4 Limitations
1.5 Currency
1.6 Stakeholders
2 Research Methodology (Page No. - 34)
2.1 Research Approach
2.1.1 Secondary Data
2.1.1.1 Key Data From Secondary Sources
2.1.2 Primary Data
2.1.2.1 Key Data From Primary Sources
2.1.2.2 Key Industry Insights
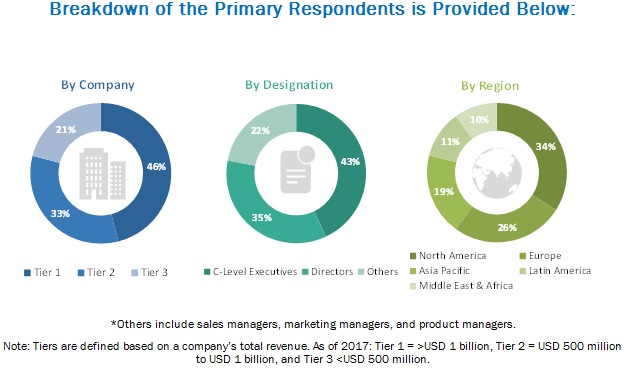
2.1.2.3 Breakdown of Primaries
2.2 Market Size Estimation
2.3 Market Breakdown and Data Triangulation
2.4 Assumptions for the Study
3 Executive Summary (Page No. - 43)
4 Premium Insights (Page No. - 48)
4.1 Medical Gases & Equipment Market Overview
4.2 Asia Pacific: Medical Gases & Equipment Market, By Equipment Type and Country, 2018
4.3 Geographic Snapshot of the Medical Gases & Equipment Market
4.4 Geographic Mix: Medical Gases & Equipment Market
4.5 Medical Gases & Equipment Market: Developing vs Developed Markets
5 Overview (Page No. - 53)
5.1 Introduction
5.2 Market Dynamics
5.2.1 Market Drivers
5.2.1.1 Increasing Prevalence of Chronic Diseases
5.2.1.2 Increasing Incidence of Respiratory Diseases as A Result of the High Prevalence of Tobacco Use and Rising Pollution Levels
5.2.2 Rising Incidence of Preterm Births
5.2.2.1 Growing Demand for Home Healthcare
5.2.3 Market Restraints
5.2.3.1 Declining Federal Reimbursements for Respiratory Diagnostics and Therapies
5.2.3.2 Global Helium Shortage
5.2.4 Market Opportunities
5.2.4.1 Market Expansion in Emerging Countries Across APAC
5.2.4.2 Technological Advancements
5.2.5 Market Challenges
5.2.5.1 Changes in Medical Gas Calibration Standards
5.2.5.2 Lack of Awareness and Large Untreated Population
6 Industry Insights (Page No. - 61)
6.1 Introduction
6.2 Industry Trends
6.2.1 Focus on Equipment Integration and Convenience
6.2.2 Inclination Towards Modern Bulk Gas Supply Chains— Microbulk and Small Bulk
6.2.3 Consolidation
6.3 Regulatory Analysis
6.3.1 North America
6.3.1.1 US
6.3.1.2 Canada
6.3.2 Europe
6.3.3 Asia Pacific
6.3.3.1 Japan
6.3.3.2 China
6.3.3.3 India
6.4 Product Portfolio Analysis
7 By Type (Page No. - 71)
7.1 Introduction
7.2 Medical Gases
7.2.1 Pure Medical Gases
7.2.2 Pure Medical Gases Market, By Type
7.2.2.1 Oxygen
7.2.2.1.1 Hospitals
7.2.2.1.1.1 Improving Healthcare Infrastructure to Drive the Demand for Oxygen Gas in Hospitals
7.2.2.1.2 Home Care Settings
7.2.2.1.2.1 Rising Healthcare Costs and Rapid Growth in the Aging Population Globally Led to the Emergence of the Home Care Settings Market
7.2.2.2 Carbon Dioxide
7.2.2.2.1 Rise in Surgeries Performed Augments the Demand for Medical-Grade Co2
7.2.2.3 Nitrogen
7.2.2.3.1 Growing Number of Cryopreservation and Biopreservation Procedures to Drive the Nitrogen Market
7.2.2.4 Nitrous Oxide
7.2.2.4.1 Growing Number of Preterm Births to Drive the Nitrous Oxide Market
7.2.2.5 Medical Air
7.2.2.5.1 Growing Use of Medical Air as an Alternative to Anesthetic Gases to Drive the Growth of This Market
7.2.2.6 Helium
7.2.2.6.1 Shortage of Helium Could Slow the Growth of This Market
7.2.3 Pure Medical Gases Market, By Form of Delivery
7.2.3.1 High-Pressure Cylinders
7.2.3.1.1 Growing Preference for Home Treatment Among Patients to Propel the Growth of This Segment
7.2.3.2 Liquid Tanks
7.2.3.2.1 Rising Use of Oxygen, Carbon Dioxide, and Nitrogen in Various Clinical Applications to Drive the Adoption of Liquid Tanks
7.2.3.3 Bulk Delivery
7.2.3.3.1 Growing Need of an Uninterrupted Supply of Gas to Drive the Adoption of Bulk Delivery
7.2.4 Medical Gas Mixtures
7.2.4.1 Blood-Gas Mixtures
7.2.4.1.1 Blood-Gas Mixtures to Account for the Largest Market Share in 2018
7.2.4.2 Lung Diffusion Mixtures
7.2.4.2.1 Rising Prevalence of Respiratory, Gastrointestinal, and Cardiovascular Disorders to Drive the Demand for Lung Diffusion Mixtures
7.2.4.3 Nitrous Oxide-Oxygen Mixtures
7.2.4.3.1 Growing Prevalence of Cardiovascular Diseases Driving the Demand for Carbon Dioxide-Oxygen Mixtures
7.2.4.4 Carbon Dioxide-Oxygen Mixtures
7.2.4.4.1 Various Applications From Dental Procedures to Obstetric Procedures Drive the Demand for Nitrous Oxide-Oxygen Mixtures
7.2.4.5 Laser-Gas Mixtures
7.2.4.5.1 Wide Applications of Laser-Gas Mixtures in Skin and Ophthalmic Surgeries to Propel the Growth of This Market
7.2.4.6 Aerobic Gas Mixtures
7.2.4.6.1 Aerobic Gas Mixtures are Essential for Controlling the Atmosphere of Cell Cultures, A Key Factor Driving Demand Growth
7.2.4.7 Anaerobic Gas Mixtures
7.2.4.7.1 Rising Demand From Laboratories for the Incubation of Microorganisms to Drive the Growth of This Segment
7.2.4.8 Ethylene Oxide/Sterilant Gas Mixtures
7.2.4.8.1 Wide Usage of Ethylene Oxide as A Sterilizing Agent to Drive the Growth of This Segment
7.2.4.9 Helium-Oxygen Mixtures
7.2.4.9.1 High Costs Restrain the Widespread Use of Heliox in Medical Applications
7.3 Medical Gas Equipment
7.3.1 Equipment Accessories
7.3.1.1 Vacuum Systems
7.3.1.1.1 Vacuum Systems to Account for the Largest Share in 2018
7.3.1.2 Manifolds
7.3.1.2.1 Significantly Increased Workplace Safety and Reduced Accidents Involving Contamination to Drive the Adoption of Manifolds
7.3.1.3 Regulators
7.3.1.3.1 New Product Launches to Drive the Adoption of Regulators
7.3.1.4 Flowmeters
7.3.1.4.1 Increasing Efforts to Calculate Smaller Proportions of Gases to Ensure Patient Safety are Driving the Adoption of Flowmeters
7.3.1.5 Suction Regulators
7.3.1.5.1 Rising Use in Healthcare Facilities for Surgeries and Other Medical Applications to Propel Market Growth
7.3.1.6 Hoses
7.3.1.6.1 Significant Use in A Number of Medical Applications to Drive the Growth of This Segment
7.3.1.7 Valves With Integrated Pressure Regulators (VIPRS)
7.3.1.7.1 Technological Advancements to Drive the Adoption of Valves With Integrated Pressure Regulators
7.3.1.8 Outlets
7.3.1.8.1 Outlets to Register the Highest Growth Between 2018 and 2023
7.3.1.9 Monitoring Systems (Alarms & Monitors)
7.3.1.9.1 Recent Advances in Gas Monitoring Systems to Drive Adoption During the Forecast Period
7.3.1.10 Medical Air Compressors
7.3.1.10.1 Growing Use of Energy-Efficient and Cost-Effective Products to Propel Market Growth
7.3.2 Gas Delivery Systems
7.3.2.1 Cost-Effective and Safe Alternatives to Gas Cylinders in Hospitals and Laboratory Environments to Drive Market Growth
7.3.3 Cryogenic Products (Freezers)
7.3.3.1 Growing Use in Various Application to Drive the Adoption of Cryogenic Products
8 Medical Gas Market: By Application (Page No. - 140)
8.1 Introduction
8.2 Therapeutic Applications
8.2.1 Respiratory Therapies
8.2.1.1 Prevalence of Asthma and Allergic Diseases has Increased Over the Years
8.2.2 Cardiovascular Therapies
8.2.2.1 Market Growth Will Be Driven By the Growing Disease Incidence and Importance of Medical Gases in Their Treatment
8.2.3 Anesthesia Delivery
8.2.3.1 Nitrous Oxide, Among Others, is Often Used as an Inhalation Anesthetic
8.2.4 Cryosurgery
8.2.4.1 Painlessness of Cryosurgical Procedures Driving Their Adoption
8.2.5 Other Therapeutic Applications
8.2.5.1 Rising Incidence of Neurological Disorders and Traumatic Brain Injuries to Increase the Demand for Medical Gases
8.3 Pharmaceutical Manufacturing & Research
8.3.1 Drug Discovery
8.3.1.1 Growing Use of Gases and Gas Mixtures, Increasing Investments in R&D Will Contribute to the Growth of This Application Segment
8.3.2 Pharmaceutical Manufacturing
8.3.2.1 Regulatory Concerns Have Driven the Demand for Pure Medical Gases for Pharmaceutical Manufacturing
8.3.3 Process Development
8.3.3.1 Growing Use of Process Development Technologies Will Support Market Growth
8.3.4 Quality Control
8.3.4.1 Ensuring Purity of Specialty and Medical Gases is Crucial
8.4 Diagnostic Applications
8.4.1 Medical Imaging
8.4.1.1 Companies are Focusing on Bundling Product & Service Offerings for Diagnostic Imaging
8.4.2 General Laboratory Applications
8.4.2.1 Growing Focus on Cryobiology and Cell-Based Research Will Support Segmental Growth
8.5 Other Applications
9 Medical Gas Market, By End User (Page No. - 166)
9.1 Introduction
9.1.1 Hospitals
9.1.1.1 Hospitals are the Major End Users of Medical Gases and Equipment
9.1.2 Home Healthcare
9.1.2.1 Home Healthcare Segment to Witness the Highest Growth During the Forecast Period, Primarily Due to the Rising Global Prevalence of Chronic Diseases
9.1.3 Pharmaceutical & Biotechnology Companies
9.1.3.1 Pharmaceutical & Biotechnology Companies Use Medical Gases to Process Active Substances, Medicaments, and Medicinal Products
9.1.4 Academic & Research Institutions
9.1.4.1 Growing Number of Companies are Increasingly Opting to Outsource Their Research Functions to Academic and Research Institutes
9.1.5 Emergency Services
9.1.5.1 Emergency Services Mainly Rely on Oxygen and Nitronox
10 Medical Gas Market, By Region (Page No. - 176)
10.1 Introduction
10.2 North America
10.2.1 US
10.2.1.1 US has the Highest Healthcare Expenditure Among Oecd Countries
10.2.2 Canada
10.2.2.1 Changes in Demographics and Care Patterns Have Favored the Growth of the Canadian Home Care Market
10.3 Europe
10.3.1 Germany
10.3.1.1 Approximately 85% of the German Population has Insurance Coverage
10.3.2 UK
10.3.2.1 Mhra Regulates Medical Gas Equipment in the Country
10.3.3 France
10.3.3.1 Well-Established French Healthcare System is Ranked Among the World’s Best
10.3.4 Italy
10.3.4.1 Rapid Growth in Geriatric Population and Rising Life Expectancy Have Driven the Demand for Healthcare
10.3.5 Spain
10.3.5.1 Government Debt, Shortcomings of Spain’s Medical Devices Sector Will Negatively Affect the Market
10.3.6 Rest of Europe
10.4 Asia Pacific
10.4.1 Japan
10.4.1.1 Mandatory Enrolment in Healthcare Insurance Program Ensures Widespread Access to Quality Care
10.4.2 China
10.4.2.1 Lifestyle Changes and Growing Air Pollution Levels Have Contributed to Disease Incidence in China
10.4.3 India
10.4.3.1 Acute Respiratory Disease is A Major Concern in India
10.4.4 Australia
10.4.4.1 Rising Disease Prevalence, Geriatric Population, and Infrastructural Development Will Ensure Steady Market Growth
10.4.5 South Korea
10.4.5.1 The Country is Gaining Prominence as A Medical Tourism Hub
10.4.6 Rest of Asia Pacific
10.5 Latin America
10.5.1 Brazil
10.5.1.1 Only Half of Brazil’s Population Can Access Universal Healthcare
10.5.2 Argentina
10.5.2.1 Long Waiting Times and Varying Quality of Healthcare Services in Public Hospitals May Hinder Market Prospects
10.5.3 Mexico
10.5.3.1 Mexico is the Second-Most-Popular Medical Tourism Hub for US Patients
10.5.4 Rest of Latin America
10.6 Middle East and Africa
10.6.1 Market to Receive A Boost Due to Ongoing Infrastructural Development Activity
11 Medical Gas Market: Competitive Landscape (Page No. - 336)
11.1 Overview
11.2 Market Share Analysis
11.3 Competitive Situation and Trends
11.3.1 New Product Launches
11.3.2 Expansions
11.3.3 Agreements, Partnerships, and Joint Ventures
11.3.4 Others
12 Company Profiles (Page No. - 345)
12.1 Air Liquide
12.1.1 Business Overview
12.1.2 Products and Services Offered
12.1.3 Recent Developments
12.1.4 SWOT Analysis
12.1.5 MnM View
12.2 The Linde Group
12.2.1 Business Overview
12.2.2 Products Offered
12.2.3 Recent Developments
12.2.4 SWOT Analysis
12.2.5 MnM View
12.3 Air Products and Chemicals, Inc.
12.3.1 Business Overview
12.3.2 Products Offered
12.3.3 Recent Developments
12.3.4 SWOT Analysis
12.3.5 MnM View
12.4 Praxair, Inc.
12.4.1 Business Overview
12.4.2 Products Offered
12.4.3 Recent Developments
12.4.4 SWOT Analysis
12.4.5 MnM View
12.5 Taiyo Nippon Sanso Corporation (Matheson Tri-Gas Inc.)
12.5.1 Business Overview
12.5.2 Products Offered
12.5.3 Recent Developments
12.5.4 SWOT Analysis
12.5.5 MnM View
12.6 Atlas Copco AB
12.6.1 Business Overview
12.6.2 Products Offered
12.6.3 Recent Developments
12.6.4 MnM View
12.7 Gce Holding AB
12.7.1 Business Overview
12.7.2 Products Offered
12.7.3 Recent Developments
12.7.4 MnM View
12.8 Messer Group GmbH
12.8.1 Business Overview
12.8.2 Products Offered
12.8.3 Recent Developments
12.8.4 MnM View
12.9 SOL SPA
12.9.1 Business Overview
12.9.2 Products Offered
12.9.3 Recent Developments
12.9.4 MnM View
12.10 Rotarex S.A.
12.10.1 Business Overview
12.10.2 Products Offered
12.10.3 Recent Developments
12.10.4 MnM View
12.11 Additional Company Profiles
12.11.1 Medical Gas Solutions Limited
12.11.1.1 Business Overview
12.11.1.2 Products Offered
12.11.2 Sci Analytical
12.11.2.1 Business Overview
12.11.2.2 Products Offered
12.11.3 Amico Corporation
12.11.3.1 Business Overview
12.11.3.2 Products Offered
13 Appendix (Page No. - 391)
13.1 Insights of Industry Experts
13.2 Discussion Guide
13.3 Knowledge Store: Marketsandmarkets’ Subscription Portal
13.4 Available Customizations
13.5 Related Reports
13.6 Author Details
List of Tables (387 Tables)
Table 1 Medical Gas Market Snapshot, 2018 vs 2023
Table 2 Market Dynamics: Impact Analysis
Table 3 Respiratory Disease Prevalence in Emerging Countries
Table 4 Key Acquisitions By Leading Players in the Medical Gases and Gas Equipment Market
Table 5 Stringency of Regulations for Medical Gases and Gas Handling Equipment, By Country
Table 6 Color Coding of Medical Gases
Table 7 China: Standards for Medical Gas Equipment
Table 8 India: Standards for Medical Gas Equipment
Table 9 Market: Product Portfolio Analysis
Table 10 Market, By Type, 2016–2023 (USD Million)
Table 11 Medical Gas Market, By Type, 2016–2023 (USD Million)
Table 12 Medical Gases Market, By Country, 2016–2023 (USD Million)
Table 13 Pure Medical Gas Market, By Type, 2016–2023 (USD Million)
Table 14 Pure Medical Gases Market, By Country, 2016–2023 (USD Million)
Table 15 Players Offering Oxygen Gas in the Market
Table 16 Pure Medical Oxygen Market, By Country, 2016–2023 (USD Million)
Table 17 Pure Medical Oxygen Market for Hospitals, By Country, 2016–2023 (USD Million)
Table 18 Pure Medical Oxygen Market for Home Care Settings, By Country, 2016–2023 (USD Million)
Table 19 Players Offering Carbon Dioxide Gas in the Market
Table 20 Pure Medical Carbon Dioxide Market, By Country, 2016–2023 (USD Million)
Table 21 Players Offering Nitrogen Gas in the Market
Table 22 Pure Medical Nitrogen Market, By Country, 2016–2023 (USD Million)
Table 23 Players Offering Nitrous Oxide Gas in the Market
Table 24 Pure Medical Nitrous Oxide Market, By Country, 2016–2023 (USD Million)
Table 25 Players Offering Medical Air in the Market
Table 26 Pure Medical Air Market, By Country, 2016–2023 (USD Million)
Table 27 Players Offering Helium in the Market
Table 28 Pure Medical Helium Market, By Country, 2016–2023 (USD Million)
Table 29 Pure Medical Gas Market, By Form of Delivery, 2016–2023 (USD Million)
Table 30 Pure Medical Gases in High-Pressure Cylinders Market, By Country, 2016–2023 (USD Million)
Table 31 Pure Medical Gases in Liquid Tanks Market, By Country, 2016–2023 (USD Million)
Table 32 Pure Medical Gas Bulk Delivery Market, By Country, 2016–2023 (USD Million)
Table 33 Medical Gas Mixtures Market, By Type, 2016–2023 (USD Million)
Table 34 Medical Gas Mixtures Market, By Country, 2016–2023 (USD Million)
Table 35 Blood-Gas Mixtures Market, By Country, 2016–2023 (USD Million)
Table 36 Lung Diffusion Mixtures Market, By Country, 2016–2023 (USD Million)
Table 37 Nitrous Oxide-Oxygen Mixtures Market, By Country, 2016–2023 (USD Million)
Table 38 Carbon Dioxide-Oxygen Mixtures Market, By Country, 2016–2023 (USD Million)
Table 39 Laser-Gas Mixtures Market, By Country, 2016–2023 (USD Million)
Table 40 Aerobic Gas Mixtures Market, By Country, 2016–2023 (USD Million)
Table 41 Anaerobic Gas Mixtures Market, By Country, 2016–2023 (USD Million)
Table 42 Ethylene Oxide/Sterilant Gas Mixtures Market, By Country, 2016–2023 (USD Million)
Table 43 Players Offering Helium-Oxygen Mixtures in the Market
Table 44 Helium-Oxygen Mixtures Market, By Country, 2016–2023 (USD Million)
Table 45 Medical Gas Equipment Market, By Type, 2016–2023 (USD Million)
Table 46 Medical Gas Equipment Market, By Country, 2016–2023 (USD Million)
Table 47 Equipment Accessories Market, By Type, 2016–2023 (USD Million)
Table 48 Equipment Accessories Market, By Country, 2016–2023 (USD Million)
Table 49 Players Offering Vacuum Systems in the Market
Table 50 Vacuum Systems Market, By Country, 2016–2023 (USD Million)
Table 51 Players Offering Manifolds in the Market
Table 52 Manifolds Market, By Country, 2016–2023 (USD Million)
Table 53 Players Offering Regulators in the Market
Table 54 Regulators Market, By Country, 2016–2023 (USD Million)
Table 55 Players Offering Flowmeters in the Market
Table 56 Flowmeters Market, By Country, 2016–2023 (USD Million)
Table 57 Players Offering Suction Regulators in the Market
Table 58 Suction Regulators Market, By Country, 2016–2023 (USD Million)
Table 59 Players Offering Hoses in the Market
Table 60 Hoses Market, By Country, 2016–2023 (USD Million)
Table 61 Players Offering Valves With Integrated Pressure Regulators in the Market
Table 62 Valves With Integrated Pressure Regulators Market, By Country, 2016–2023 (USD Million)
Table 63 Players Offering Outlets in the Market
Table 64 Outlets Market, By Country, 2016–2023 (USD Million)
Table 65 Players Offering Monitoring Systems in the Market
Table 66 Monitoring Systems Market, By Country, 2016–2023 (USD Million)
Table 67 Players Offering Medical Air Compressors in the Market
Table 68 Medical Air Compressors Market, By Country, 2016–2023 (USD Million)
Table 69 Players Offering Gas Delivery Systems in the Market
Table 70 Gas Delivery Systems Market, By Country, 2016–2023 (USD Million)
Table 71 Players Offering Cryogenic Products (Freezers) in the Market
Table 72 Cryogenic Products Market, By Country, 2016–2023 (USD Million)
Table 73 Market, By Application, 2016–2023 (USD Million)
Table 74 Medical Gas Market for Therapeutic Applications, By Type, 2016–2023 (USD Million)
Table 75 Market for Therapeutic Applications, By Country, 2016–2023 (USD Million)
Table 76 Medical Gas Market for Respiratory Therapies, By Country, 2016–2023 (USD Million)
Table 77 Medical Gas Market for Cardiovascular Therapies, By Country, 2016–2023 (USD Million)
Table 78 Market for Anesthesia Delivery, By Country, 2016–2023 (USD Million)
Table 79 Market for Cryosurgery, By Country, 2016–2023 (USD Million)
Table 80 Market for Other Therapeutic Applications, By Country, 2016–2023 (USD Million)
Table 81 Market for Pharmaceutical Manufacturing and Research, By Type, 2016–2023 (USD Million)
Table 82 Market for Pharmaceutical Manufacturing and Research, By Country, 2016–2023 (USD Million)
Table 83 Market for Drug Discovery, By Country, 2016–2023 (USD Million)
Table 84 Market for Pharmaceutical Manufacturing, By Country, 2016–2023 (USD Million)
Table 85 Market for Process Development, By Country, 2016–2023 (USD Million)
Table 86 Medical Gases and Equipment Market for Quality Control, By Country, 2016–2023 (USD Million)
Table 87 Market for Diagnostic Applications, By Type, 2016–2023 (USD Million)
Table 88 Market for Diagnostic Applications, By Country, 2016–2023 (USD Million)
Table 89 Market for Medical Imaging, By Country, 2016–2023 (USD Million)
Table 90 Market for General Laboratory Applications, By Country, 2016–2023 (USD Million)
Table 91 Medical Gas Market for Other Applications, By Country, 2016–2023 (USD Million)
Table 92 Market, By End User, 2016–2023 (USD Million)
Table 93 Market for Hospitals, By Country, 2016–2023 (USD Million)
Table 94 Market for Home Healthcare, By Country, 2016–2023 (USD Million)
Table 95 Market for Pharmaceutical & Biotechnology Companies, By Country, 2016–2023 (USD Million)
Table 96 Market for Academic & Research Institutions, By Country, 2016–2023 (USD Million)
Table 97 Medical Equipment Market for Emergency Services, By Country, 2016–2023 (USD Million)
Table 98 Medical Equipment Market, By Region, 2016–2023 (USD Million)
Table 99 North America: Medical Equipment Market, By Country, 2016–2023 (USD Million)
Table 100 North America: Medical Equipment Market, By Product, 2016–2023 (USD Million)
Table 101 North America: Medical Gas Market, By Type, 2016–2023 (USD Million)
Table 102 North America: Pure Medical Gas Market, By Type, 2016–2023 (USD Million)
Table 103 North America: Medical Gas Mixtures Market, By Type, 2016–2023 (USD Million)
Table 104 North America: Market, By Form of Delivery, 2016–2023 (USD Million)
Table 105 North America: Medical Gas Equipment Market, By Type, 2016–2023 (USD Million)
Table 106 North America: Equipment Accessories Market, By Type, 2016–2023 (USD Million)
Table 107 North America: Medical Equipment Market, By Application, 2016–2023 (USD Million)
Table 108 North America: Market for Therapeutic Applications, By Type, 2016–2023 (USD Million)
Table 109 North America: Market for Diagnostic Applications, By Type, 2016–2023 (USD Million)
Table 110 North America: Medical Gases and Equipment for Pharmaceutical Manufacturing and Research, By Type, 2016–2023 (USD Million)
Table 111 North America: Market, By End User, 2016–2023 (USD Million)
Table 112 US: Macroeconomic Indicators for the Market
Table 113 US: Market, By Product, 2016–2023 (USD Million)
Table 114 US: Medical Gas Market, By Type, 2016–2023 (USD Million)
Table 115 US: Medical Pure Gases Market, By Type, 2016–2023 (USD Million)
Table 116 US: Medical Gas Mixtures Market, By Type, 2016–2023 (USD Million)
Table 117 US: Market, By Form of Delivery, 2016–2023 (USD Million)
Table 118 US: Medical Gas Equipment Market, By Type, 2016–2023 (USD Million)
Table 119 US: Equipment Accessories Market, By Type, 2016–2023 (USD Million)
Table 120 US: Medical Equipment Market, By Application, 2016–2023 (USD Million)
Table 121 US: Market for Therapeutic Applications, By Type, 2016–2023 (USD Million)
Table 122 US: Medical Equipment Market for Diagnostic Applications, By Type, 2016–2023 (USD Million)
Table 123 US: Medical Gases and Equipment Pharmaceutical Manufacturing and Research Market, By Type, 2016–2023 (USD Million)
Table 124 US: Medical Gas Market, By End-User, 2016–2023 (USD Million)
Table 125 Canada: Macroeconomic Indicators for the Medical Equipment Market
Table 126 Canada: Market, By Product, 2016–2023 (USD Million)
Table 127 Canada: Medical Gas Market, By Type, 2016–2023 (USD Million)
Table 128 Canada: Medical Pure Gases Market, By Type, 2016–2023 (USD Million)
Table 129 Canada: Medical Gas Mixtures Market, By Type, 2016–2023 (USD Million)
Table 130 Canada: Market, By Form of Delivery, 2016–2023 (USD Million)
Table 131 Canada: Medical Gas Equipment Market, By Type, 2016–2023 (USD Million)
Table 132 Canada: Equipment Accessories Market, By Type, 2016–2023 (USD Million)
Table 133 Canada: Medical Gas Market, By Application, 2016–2023 (USD Million)
Table 134 Canada: Medical Equipment Market for Therapeutic Applications, By Type, 2016–2023 (USD Million)
Table 135 Canada: Medical Equipment Market for Diagnostic Applications, By Type, 2016–2023 (USD Million)
Table 136 Canada: Medical Gases and Equipment Pharmaceutical Manufacturing and Research Market, By Type, 2016–2023 (USD Million)
Table 137 Canada: Medical Gas Market, By End-User, 2016–2023 (USD Million)
Table 138 Europe: Medical Equipment Market, By Country, 2016–2023 (USD Million)
Table 139 Europe: Medical Equipment Market, By Product, 2016–2023 (USD Million)
Table 140 Europe: Medical Gas Market, By Type, 2016–2023 (USD Million)
Table 141 Europe: Medical Pure Gases Market, By Type, 2016–2023 (USD Million)
Table 142 Europe: Medical Pure Gases Market, By Form of Delivery, 2016–2023 (USD Million)
Table 143 Europe: Medical Gas Mixtures Market, By Type, 2016–2023 (USD Million)
Table 144 Europe: Medical Gas Equipment Market, By Type, 2016–2023 (USD Million)
Table 145 Europe: Medical Gas Market, By Application, 2016–2023 (USD Million)
Table 146 Europe: Medical Gases and Equipment Diagnostics Market, By Type, 2016–2023 (USD Million)
Table 147 Europe: Medical Gases and Equipment Pharmaceutical Manufacturing and Research Market, By Type, 2016–2023 (USD Million)
Table 148 Europe: Medical Gas Market, By End User, 2016–2023 (USD Million)
Table 149 Germany: Macroeconomic Indicators for the Market
Table 150 Germany: Market, By Product, 2016–2023 (USD Million)
Table 151 Germany: Medical Gas Market, By Type, 2016–2023 (USD Million)
Table 152 Germany: Medical Pure Gases Market, By Type, 2016–2023 (USD Million)
Table 153 Germany: Medical Pure Gases Market, By Form of Delivery, 2016–2023 (USD Million)
Table 154 Germany: Medical Gas Mixtures Market, By Type, 2016–2023 (USD Million)
Table 155 Germany: Medical Gas Equipment Market, By Type, 2016–2023 (USD Million)
Table 156 Germany: Medical Gas Accessories Market, By Type, 2016–2023 (USD Million)
Table 157 Germany: Market, By Application, 2016–2023 (USD Million)
Table 158 Germany: Medical Gas Market for Therapeutic Application, By Type, 2016–2023 (USD Million)
Table 159 Germany: Market for Diagnostic Application, By Type, 2016–2023 (USD Million)
Table 160 Germany: Medical Gas Market for D Pharmaceutical Manufacturing and Research Application, By Type, 2016–2023 (USD Million)
Table 161 Germany: Market, By End User, 2016–2023 (USD Million)
Table 162 UK: Macroeconomic Indicators for the Medical Gas Market
Table 163 UK: Medical Gas Market, By Type, 2016–2023 (USD Million)
Table 164 UK: Medical Gas Market, By Type, 2016–2023 (USD Million)
Table 165 UK: Medical Pure Gases Market, By Type, 2016–2023 (USD Million)
Table 166 UK: Medical Pure Gases Market, By Form of Delivery, 2016–2023 (USD Million)
Table 167 UK: Medical Gas Mixtures Market, By Type, 2016–2023 (USD Million)
Table 168 UK: Medical Gas Equipment Market, By Type, 2016–2023 (USD Million)
Table 169 UK: Medical Gas Equipment Accessories Market, By Type, 2016–2023 (USD Million)
Table 170 UK: Market, By Application, 2016–2023 (USD Million)
Table 171 UK: Medical Gases and Equipment for Therapeutic Application Market, By Type, 2016–2023 (USD Million)
Table 172 UK: Medical Gases and Equipment for Diagnostic Application Market, By Type, 2016–2023 (USD Million)
Table 173 UK: Medical Gases and Equipment for Pharmaceutical Manufacturing and Research Application Market, By Type, 2016–2023 (USD Million)
Table 174 UK: Market, By End User, 2016–2023 (USD Million)
Table 175 France: Macroeconomic Indicators for the Market
Table 176 France: Market, By Type, 2016–2023 (USD Million)
Table 177 France: Medical Gas Market, By Type, 2016–2023 (USD Million)
Table 178 France: Medical Pure Gases Market, By Type, 2016–2023 (USD Million)
Table 179 France: Medical Pure Gases Market, By Form of Delivery, 2016–2023 (USD Million)
Table 180 France: Medical Gas Mixtures Market, By Type, 2016–2023 (USD Million)
Table 181 France: Medical Gas Equipment Market, By Type, 2016–2023 (USD Million)
Table 182 France: Market, By Application, 2016–2023 (USD Million)
Table 183 France: Medical Gases and Equipment Market for Therapeutics, By Application, 2016–2023 (USD Million)
Table 184 France: Market for Diagnostics, By Application, 2016–2023 (USD Million)
Table 185 France: Market for Pharmaceutical Manufacturing and Research, By Application, 2016–2023 (USD Million)
Table 186 France: Market, By End User, 2016–2023 (USD Million)
Table 187 Italy: Macroeconomic Indicators for the Market
Table 188 Italy: Market, By Type, 2016–2023 (USD Million)
Table 189 Italy: Medical Gas Market, By Type, 2016–2023 (USD Million)
Table 190 Italy: Medical Pure Gases Market, By Type, 2016–2023 (USD Million)
Table 191 Italy: Medical Pure Gases Market, By Form of Delivery, 2016–2023 (USD Million)
Table 192 Italy: Medical Gas Mixtures Market, By Type, 2016–2023 (USD Million)
Table 193 Italy: Medical Gas Equipment Market, By Type, 2016–2023 (USD Million)
Table 194 Italy: Medical Gas Equipment Accessories Market, By Type, 2016–2023 (USD Million)
Table 195 Italy: Medical Gas Market, By Application, 2016–2023 (USD Million)
Table 196 Taly: Market for Therapeutic Applications, By Type, 2016–2023 (USD Million)
Table 197 Taly: Medical Gases and Equipment Market for Diagnostic Applications, By Type, 2016–2023 (USD Million)
Table 198 Taly: Market for Pharmaceutical Manufacturing and Research Applications, By Type, 2016–2023 (USD Million)
Table 199 Italy: Market, By End User, 2016–2023 (USD Million)
Table 200 Spain: Macroeconomic Indicators for the Medical Equipment Market
Table 201 Spain: Market, By Type, 2016–2023 (USD Million)
Table 202 Spain: Medical Gas Market, By Type, 2016–2023 (USD Million)
Table 203 Spain: Medical Pure Gases Market, By Type, 2016–2023 (USD Million)
Table 204 Spain: Medical Pure Gases Market, By Form of Delivery, 2016–2023 (USD Million)
Table 205 Spain: Medical Gas Mixtures Market, By Type, 2016–2023 (USD Million)
Table 206 Spain: Medical Gas Equipment Market, By Type, 2016–2023 (USD Million)
Table 207 Spain: Medical Gas Equipment Accessories Market, By Type, 2016–2023 (USD Million)
Table 208 Spain: Medical Gas Market, By Application, 2016–2023 (USD Million)
Table 209 Spain: Market for Therapeutic Application, By Type, 2016–2023 (USD Million)
Table 210 Spain: Medical Gases and Equipment Market for Diagnostic Application, By Type, 2016–2023 (USD Million)
Table 211 Spain: Medical Equipment Market for Pharmaceutical Manufacturing and Research Application, By Type, 2016–2023 (USD Million)
Table 212 Spain: Market, By End User, 2016–2023 (USD Million)
Table 213 RoE: Market, By Type, 2016–2023 (USD Million)
Table 214 RoE: Medical Gas Market, By Type, 2016–2023 (USD Million)
Table 215 RoE: Medical Pure Gases Market, By Type, 2016–2023 (USD Million)
Table 216 RoE: Medical Pure Gases Market, By Form of Delivery, 2016–2023 (USD Million)
Table 217 RoE: Medical Gas Mixtures Market, By Type, 2016–2023 (USD Million)
Table 218 RoE: Medical Gas Equipment Market, By Type, 2016–2023 (USD Million)
Table 219 RoE: Medical Gas Equipment Accessories Market, By Type, 2016–2023 (USD Million)
Table 220 RoE: Medical Gases and Equipment Market, By Application, 2016–2023 (USD Million)
Table 221 RoE: Market for Therapeutic Application, By Type, 2016–2023 (USD Million)
Table 222 RoE: Market for Diagnostic Application, By Type, 2016–2023 (USD Million)
Table 223 RoE: Market for Pharmaceutical Manufacturing and Research Application, By Type, 2016–2023 (USD Million)
Table 224 RoE: Medical Gases and Equipment Market, By End User, 2016–2023 (USD Million)
Table 225 Asia Pacific: Market, By Country, 2016–2023 (USD Million)
Table 226 Asia Pacific: Market, By Type, 2016–2023 (USD Million)
Table 227 Asia Pacific: Medical Gas Market, By Type, 2016–2023 (USD Million)
Table 228 Asia Pacific: Medical Pure Gases Market, By Type, 2016–2023 (USD Million)
Table 229 Asia Pacific: Medical Pure Gases Market, By Form of Delivery, 2016–2023 (USD Million)
Table 230 Asia Pacific: Medical Gas Mixtures Market, By Type, 2016–2023 (USD Million)
Table 231 Asia Pacific: Medical Gas Equipment Market, By Type, 2016–2023 (USD Million)
Table 232 Asia Pacific: Medical Gases and Equipment Market, By Application, 2016–2023 (USD Million)
Table 233 Asia Pacific: Market for Therapeutic Application, By Type, 2016–2023 (USD Million)
Table 234 Asia Pacific: Market for Diagnostics Application, By Type, 2016–2023 (USD Million)
Table 235 Asia Pacific: Market for Pharmaceutical Manufacturing and Research Application, By Type, 2016–2023 (USD Million)
Table 236 Asia Pacific: Market, By End User, 2016–2023 (USD Million)
Table 237 Japan: Macroeconomic Indicators for the Medical Gases and Equipment Market
Table 238 Japan: Market, By Product, 2016–2023 (USD Million)
Table 239 Japan: Medical Gas Market, By Type, 2016–2023 (USD Million)
Table 240 Japan: Medical Pure Gases Market, By Type, 2016–2023 (USD Million)
Table 241 Japan: Medical Pure Gases Market, By Form of Delivery, 2016–2023 (USD Million)
Table 242 Japan: Medical Gas Mixtures Market, By Type, 2016–2023 (USD Million)
Table 243 Japan: Medical Gas Equipment Market, By Type, 2016–2023 (USD Million)
Table 244 Japan: Market, By Application, 2016–2023 (USD Million)
Table 245 Japan: Medical Gases and Equipment Market for Therapeutic Application, By Type, 2016–2023 (USD Million)
Table 246 Japan: Market for Diagnostics Application, By Type, 2016–2023 (USD Million)
Table 247 Japan: Market for Pharmaceutical Manufacturing and Research Application, By Type, 2016–2023 (USD Million)
Table 248 Japan: Market, By End User, 2016–2023 (USD Million)
Table 249 China: Macroeconomic Indicators for the Market
Table 250 China: Market, By Product, 2016–2023 (USD Million)
Table 251 China: Medical Gas Market, By Type, 2016–2023 (USD Million)
Table 252 China: Medical Pure Gases Market, By Type, 2016–2023 (USD Million)
Table 253 China: Medical Pure Gases Market, By Form of Delivery, 2016–2023 (USD Million)
Table 254 China: Medical Gas Mixtures Market, By Type, 2016–2023 (USD Million)
Table 255 China: Medical Gas Equipment Market, By Type, 2016–2023 (USD Million)
Table 256 China: Market, By Application, 2016–2023 (USD Million)
Table 257 China: Market for Therapeutic Application, By Type, 2016–2023 (USD Million)
Table 258 China: Market for Diagnostics Application, By Type, 2016–2023 (USD Million)
Table 259 China: Market for Pharmaceutical Manufacturing and Research Application, By Type, 2016–2023 (USD Million)
Table 260 China: Market, By End User, 2016–2023 (USD Million)
Table 261 India: Macroeconomic Indicators for the Market
Table 262 India: Medical Equipment Market, By Type, 2016–2023 (USD Million)
Table 263 India: Medical Gas Market, By Type, 2016–2023 (USD Million)
Table 264 India: Medical Pure Gases Market, By Type, 2016–2023 (USD Million)
Table 265 India: Medical Pure Gases Market, By Form of Delivery, 2016–2023 (USD Million)
Table 266 India: Medical Gas Mixtures Market, By Type, 2016–2023 (USD Million)
Table 267 India: Medical Gas Equipment Market, By Type, 2016–2023 (USD Million)
Table 268 India: Market, By Application, 2016–2023 (USD Million)
Table 269 India: Market for Therapeutic Application, By Type, 2016–2023 (USD Million)
Table 270 India: Market for Diagnostics Application, By Type, 2016–2023 (USD Million)
Table 271 India: Medical Equipment Market for Pharmaceutical Manufacturing and Research Application, By Type, 2016–2023 (USD Million)
Table 272 India: Market, By End User, 2016–2023 (USD Million)
Table 273 Australia: Market, By Type, 2016–2023 (USD Million)
Table 274 Australia: Medical Gas Market, By Type, 2016–2023 (USD Million)
Table 275 Australia: Medical Pure Gases Market, By Type, 2016–2023 (USD Million)
Table 276 Australia: Medical Pure Gases Market, By Form of Delivery, 2016–2023 (USD Million)
Table 277 Australia: Medical Gas Mixtures Market, By Type, 2016–2023 (USD Million)
Table 278 Australia: Medical Gas Equipment Market, By Type, 2016–2023 (USD Million)
Table 279 Australia: Market, By Application, 2016–2023 (USD Million)
Table 280 Australia: Market for Therapeutic Application, By Type, 2016–2023 (USD Million)
Table 281 Australia: Medical Equipment Market for Diagnostics Application, By Type, 2016–2023 (USD Million)
Table 282 Australia: Market for Pharmaceutical Manufacturing and Research Application, By Type, 2016–2023 (USD Million)
Table 283 Australia:Market, By End User, 2016–2023 (USD Million)
Table 284 South Korea: Market, By Type, 2016–2023 (USD Million)
Table 285 South Korea: Medical Gas Market, By Type, 2016–2023 (USD Million)
Table 286 South Korea: Medical Pure Gases Market, By Type, 2016–2023 (USD Million)
Table 287 South Korea: Medical Pure Gases Market, By Form of Delivery, 2016–2023 (USD Million)
Table 288 South Korea: Medical Gas Mixtures Market, By Type, 2016–2023 (USD Million)
Table 289 South Korea: Medical Gas Equipment Market, By Type, 2016–2023 (USD Million)
Table 290 South Korea: Medical Gases and Equipment Market, By Application, 2016–2023 (USD Million)
Table 291 South Korea: Market for Therapeutic Application, By Type, 2016–2023 (USD Million)
Table 292 South Korea: Market for Diagnostics Application, By Type, 2016–2023 (USD Million)
Table 293 South Korea: Market for Pharmaceutical Manufacturing and Research Application, By Type, 2016–2023 (USD Million)
Table 294 South Korea: Market, By End User, 2016–2023 (USD Million)
Table 295 Rest of Asia Pacific: Market, By Type, 2016–2023 (USD Million)
Table 296 RoAPAC: Medical Gas Market, By Type, 2016–2023 (USD Million)
Table 297 RoAPAC: Medical Pure Gases Market, By Type, 2016–2023 (USD Million)
Table 298 RoAPAC: Medical Pure Gases Market, By Form of Delivery, 2016–2023 (USD Million)
Table 299 RoAPAC: Medical Gas Mixtures Market, By Type, 2016–2023 (USD Million)
Table 300 RoAPAC: Medical Gas Equipment Market, By Type, 2016–2023 (USD Million)
Table 301 RoAPAC: Market, By Application, 2016–2023 (USD Million)
Table 302 RoAPAC: Market for Therapeutic Application, By Type, 2016–2023 (USD Million)
Table 303 RoAPAC: Market for Diagnostics Application, By Type, 2016–2023 (USD Million)
Table 304 RoAPAC: Market for Pharmaceutical Manufacturing and Research Application, By Type, 2016–2023 (USD Million)
Table 305 RoAPAC: Medical Gas Market, By End User, 2014–2021 (USD Million)
Table 306 Latin America: Medical Equipment Market, By Country, 2016–2023 (USD Million)
Table 307 Latin America: Market, By Product, 2016–2023 (USD Million)
Table 308 Latin America: Medical Gas Market, By Type, 2016–2023 (USD Million)
Table 309 Latin America: Medical Pure Gases Market, By Type, 2016–2023 (USD Million)
Table 310 Latin America: Medical Gas Mixtures Market, By Type, 2016–2023 (USD Million)
Table 311 Latin America: Market, By Form of Delivery, 2016–2023 (USD Million)
Table 312 Latin America: Medical Gas Equipment Market, By Type, 2016–2023 (USD Million)
Table 313 Latin America: Equipment Accessories Market, By Type, 2016–2023 (USD Million)
Table 314 Latin America: Market, By Application, 2016–2023 (USD Million)
Table 315 Latin America: Market for Therapeutic Applications, By Type, 2016–2023 (USD Million)
Table 316 Latin America: Medical Gases and Equipment Diagnostic Market, By Type 2016–2023 (USD Million)
Table 317 Latin America: Medical Gases and Equipment Pharmaceutical Manufacturing and Research Market, By Type 2016–2023 (USD Million)
Table 318 Latin America: Market, By End-User, 2016–2023 (USD Million)
Table 319 Brazil: Macroeconomic Indicators for the Medical Gases and Equipment Market
Table 320 Brazil: Market, By Product, 2016–2023 (USD Million)
Table 321 Brazil: Medical Gas Market, By Type, 2016–2023 (USD Million)
Table 322 Brazil: Medical Pure Gases Market, By Type, 2016–2023 (USD Million)
Table 323 Brazil: Medical Gas Mixtures Market, By Type, 2016–2023 (USD Million)
Table 324 Brazil: Market, By Form of Delivery, 2016–2023 (USD Million)
Table 325 Brazil: Medical Gas Equipment Market, By Type, 2016–2023 (USD Million)
Table 326 Brazil: Equipment Accessories Market, By Type, 2016–2023 (USD Million)
Table 327 Brazil: Medical Gases and Equipment Market, By Application, 2016–2023 (USD Million)
Table 328 Brazil: Market for Therapeutic Applications, By Type, 2016–2023 (USD Million)
Table 329 Brazil: Medical Gases and Equipment Diagnostic Market, By Type, 2016–2023 (USD Million)
Table 330 Brazil: Medical Gases and Equipment Pharmaceutical Manufacturing and Research Market, By Type, 2016–2023 (USD Million)
Table 331 Brazil: Market, By End-User, 2016–2023 (USD Million)
Table 332 Argentina: Macroeconomic Indicators for the Medical Gases and Equipment Market
Table 333 Argentina: Market, By Product, 2016–2023 (USD Million)
Table 334 Argentina: Medical Gas Market, By Type, 2016–2023 (USD Million)
Table 335 Argentina: Medical Pure Gases Market, By Type, 2016–2023 (USD Million)
Table 336 Argentina: Medical Gas Mixtures Market, By Type, 2016–2023 (USD Million)
Table 337 Argentina: Medical Gases and Equipment Market, By Form of Delivery, 2016–2023 (USD Million)
Table 338 Argentina: Medical Gas Equipment Market, By Type, 2016–2023 (USD Million)
Table 339 Argentina: Equipment Accessories Market, By Type, 2016–2023 (USD Million)
Table 340 Argentina: Market, By Application, 2016–2023 (USD Million)
Table 341 Argentina: Market for Therapeutic Applications, By Type, 2016–2023 (USD Million)
Table 342 Argentina: Market for Diagnostic Applications, By Type, 2016–2023 (USD Million)
Table 343 Argentina: Medical Gases and Equipment Pharmaceutical Manufacturing and Research Market, By Type, 2016–2023 (USD Million)
Table 344 Argentina: Market, By End-User, 2016–2023 (USD Million)
Table 345 Mexico: Macroeconomic Indicators for the Medical Gases and Equipment Market
Table 346 Mexico: Market, By Type, 2016–2023 (USD Million)
Table 347 Mexico: Medical Gas Market, By Type, 2016–2023 (USD Million)
Table 348 Mexico: Medical Pure Gases Market, By Type, 2016–2023 (USD Million)
Table 349 Mexico: Medical Gas Mixtures Market, By Type, 2016–2023 (USD Million)
Table 350 Mexico: Market, By Form of Delivery, 2016–2023 (USD Million)
Table 351 Mexico: Medical Gas Equipment Market, By Type, 2016–2023 (USD Million)
Table 352 Mexico: Equipment Accessories Market, By Type, 2016–2023 (USD Million)
Table 353 Mexico: Market, By Application, 2016–2023 (USD Million)
Table 354 Mexico: Market for Therapeutic Applications, By Type, 2016–2023 (USD Million)
Table 355 Mexico: Medical Gases and Equipment Market for Diagnostic Applications, By Type, 2016–2023 (USD Million)
Table 356 Mexico: Medical Gases and Equipment Pharmaceutical Manufacturing and Research Market, By Type, 2016–2023 (USD Million)
Table 357 Mexico: Medical Gases and Equipment Market, By End-User, 2016–2023 (USD Million)
Table 358 RoLA: Market, By Product, 2016–2023 (USD Million)
Table 359 RoLA: Medical Gas Market, By Type, 2016–2023 (USD Million)
Table 360 RoLA: Medical Pure Gases Market, By Type, 2016–2023 (USD Million)
Table 361 RoLA: Medical Gas Mixtures Market, By Type, 2016–2023 (USD Million)
Table 362 RoLA: Market, By Form of Delivery, 2016–2023 (USD Million)
Table 363 RoLA: Medical Gas Equipment Market, By Type, 2016–2023 (USD Million)
Table 364 RoLA: Equipment Accessories Market, By Type, 2016–2023 (USD Million)
Table 365 RoLA: Market, By Application, 2016–2023 (USD Million)
Table 366 RoLA: Medical Gases and Equipment Market for Therapeutic Applications, By Type, 2016–2023 (USD Million)
Table 367 RoLA: Medical Gases and Equipment Market for Diagnostic Applications, By Type, 2016–2023 (USD Million)
Table 368 RoLA: Medical Gases and Equipment Pharmaceutical Manufacturing and Research Market, By Type, 2016–2023 (USD Million)
Table 369 RoLA: Market, By End-User, 2016–2023 (USD Million)
Table 370 Middle East and Africa: Medical Gases and Equipment Market, By Product, 2016–2023 (USD Million)
Table 371 Middle East and Africa: Medical Gas Market, By Type, 2016–2028 (USD Million)
Table 372 Middle East and Africa: Medical Pure Gases Market, By Type, 2016–2023 (USD Million)
Table 373 Middle East and Africa: Medical Gas Mixtures Market, By Type, 2016–2022 (USD Million)
Table 374 Middle East and Africa: Medical Gases and Equipment Market, By Form of Delivery, 2016–2023 (USD Million)
Table 375 Middle East and Africa: Medical Gas Equipment Market, By Type, 2016–2023 (USD Million)
Table 376 Middle East and Africa: Equipment Accessories Market, By Type, 2016–2023 (USD Million)
Table 377 Middle East and Africa: Medical Gases and Equipment Market, By Application, 2016–2023 (USD Million)
Table 378 Middle East and Africa: Market for Therapeutic Applications, By Type, 2016–2023 (USD Million)
Table 379 Middle East and Africa: Market for Diagnostic Applications, By Type, 2016–2023 (USD Million)
Table 380 Middle East and Africa: Medical Gases and Equipment Pharmaceutical Manufacturing and Research Market, By Type, 2018–2023 (USD Million)
Table 381 Middle East and Africa: Market, By End-User, 2016–2023 (USD Million)
Table 382 Growth Strategy Matrix, 2015–2018
Table 383 Acquisitions, 2015-2018
Table 384 New Product Launches, 2015-2018
Table 385 Expansions, 2015-2018
Table 386 Agreements, Partnerships, and Joint Ventures, 2015-2018
Table 387 Others, 2015-2018
List of Figures (53 Figures)
Figure 1 Medical Gases and Equipment Market Segmentation
Figure 2 Research Design
Figure 3 Primary Sources
Figure 4 Breakdown of Primary Interviews: By Company Type, Designation, and Region
Figure 5 Bottom-Up Approach
Figure 6 Top-Down Approach
Figure 7 Data Triangulation Methodology
Figure 8 Pure Medical Gas Market, By Type, 2018 vs 2023
Figure 9 Pure Medical Gases Market, By Form of Delivery, 2018 vs 2023
Figure 10 Medical Gas Mixtures Market, By Type, 2018 vs 2023
Figure 11 Medical Gas Equipment Market, By Type, 2018 vs 2023
Figure 12 Medical Gases and Gas Equipment Market, By Application, 2018 vs 2023
Figure 13 Medical Gases and Equipment Market, By End User, 2018 vs 2023
Figure 14 North America to Dominate the Market During the Forecast Period
Figure 15 Increasing Incidence of Respiratory Diseases as A Result of the High Prevalence of Tobacco Use and Rising Pollution Levels is A Major Growth Driver
Figure 16 Cryogenic Products and China Registered Highest CAGRs During the Forecast Period
Figure 17 The US Accounted for the Largest Share of the Medical Gases & Equipment Market
Figure 18 Asia Pacific to Grow at the Highest CAGR in the Forecast Period
Figure 19 Developing Markets to Register Higher Growth During the Forecast Period
Figure 20 Obesity Statistics, By Country, 2012 vs 2015 (% of Total Adult Population)
Figure 21 Smoking Prevalence (%), By Country, 2015
Figure 22 Growth of the Above-65 Age Group, By Country (% of Total Population)
Figure 23 Preterm Birth Statistics (Developed Markets, Latin America, and Caribbean), 2010–2025
Figure 24 Major Trends in the Medical Gas and Gas Equipment Market
Figure 25 Medical Gases to Dominate the Medical Gases and Equipment Market During the Forecast Period
Figure 26 Oxygen Segment to Grow at the Highest CAGR During the Forecast Period
Figure 27 Number of Hospital Admissions for Asthma and Copd in 2013
Figure 28 Pure Medical Gases in High-Pressure Cylinders to Dominate the Market, By Form of Delivery
Figure 29 Lung Diffusion Mixtures to Grow at the Highest CAGR During the Forecast Period
Figure 30 Equipment Accessories Accounted for the Largest Share of the Medical Gas Equipment Market in 2017
Figure 31 Therapeutic Applications Segment to Account for the Largest Share in 2018
Figure 32 Respiratory Therapies Segment is Expected to Grow at the Highest CAGR During the Forecast Period
Figure 33 Global Deaths From Respiratory Diseases, 2000 vs 2012 (Thousand Individuals)
Figure 34 US: Prevalence of Cardiovascular Diseases, 2015–2035
Figure 35 Pharmaceutical Manufacturing and Research Segment is Expected to Grow at the Highest CAGR During the Forecast Period
Figure 36 Medical Imaging to Lead the Diagnostic Applications Market in 2018
Figure 37 Home Healthcare Segment to Witness the Highest Growth During the Forecast Period
Figure 38 Number of Hospitals, By Country/Region (2015)
Figure 39 Medical Gases & Equipment Market Snapshot
Figure 40 Germany – A Major Market for Medical Gases and Equipment
Figure 41 Japan – A Major Market for Medical Gas and Equipment
Figure 42 Latin America Medical Gases & Equipment Market Snapshot
Figure 43 Acquisitions—Key Growth Strategy Adopted By Market Players Between 2015 & 2018
Figure 44 Global Medical Gas Market Share Analysis, By Key Player, 2017
Figure 45 Battle for Market Share: Acquisitions Was the Key Strategy Adopted By Prominent Players
Figure 46 Company Snapshot: Air Liquide
Figure 47 Company Snapshot: the Linde Group
Figure 48 Company Snapshot: Air Products and Chemicals, Inc.
Figure 49 Company Snapshot: Praxair, Inc.
Figure 50 Company Snapshot: Taiyo Nippon Sanso Corporation
Figure 51 Company Snapshot: Atlas Copco AB
Figure 52 Company Snapshot: Messer Group GmbH
Figure 53 Company Snapshot: SOL SPA
This study involved the extensive use of both primary and secondary sources. The research process involved the study of various factors affecting the industry to identify the segmentation types, industry trends, key players, competitive landscape, key market dynamics, and key player strategies.
Secondary Research
Secondary research process involves the widespread use of secondary sources, directories, databases (such as Bloomberg Business, Factiva, and D&B Hoovers), white papers, annual reports, companies house documents, investor presentations, and SEC filings of companies. Secondary research was used to identify and collect information useful for the extensive, technical, market-oriented, and commercial study of the medical gas market. It was also used to obtain important information about the key players and market classification & segmentation according to industry trends to the bottom-most level, and key developments related to market and technology perspectives. A database of the key industry leaders was also prepared using secondary research.
Primary Research
In the primary research process, industry experts from both the supply and demand sides were interviewed to obtain qualitative and quantitative information for this report. Industry experts from the supply side include CEOs, vice presidents, marketing and sales directors, business development managers, technology and innovation directors of companies manufacturing medical gases and gas equipment, key opinion leaders, and suppliers and distributors, whereas, the industry experts from the demand side include hospital directors, pharmaceutical R&D directors, researchers, biotechnologists, and related key personnel.
To know about the assumptions considered for the study, download the pdf brochure
Market Size Estimation
The market size estimates and forecasts provided in this study are derived through a mix of the bottom-up approach (revenue share analysis of leading players) and top-down approach (assessment of utilization/adoption/penetration trends, by product, application, end user, and region).
Data Triangulation
After arriving at the market size, the total medical equipment market was divided into several segments and subsegments. To complete the overall market engineering process and arrive at the exact statistics for all segments & subsegments, data triangulation, and market breakdown procedures were employed, wherever applicable.
Objectives of the Study
- To define, describe, and forecast the medical gas market, by product, application, end user, and region
- To provide detailed information regarding factors influencing market growth (such as drivers, restraints, opportunities, challenges, and industry trends)
- To analyze micromarkets with respect to individual growth trends, prospects, and contributions to the overall market
- To analyze market opportunities for stakeholders and provide details of the competitive landscape for key players
- To strategically profile the key players in this market and comprehensively analyze their market shares and core competencies
- To strategically analyze different geographical regions such as North America, Europe, the Asia Pacific, Latin America, and the Middle East & Africa
- To track and analyze competitive developments such as mergers and acquisitions, product developments and approvals, agreements, collaborations, partnerships, expansions, and funding activities in the medical gases and equipment market
Scope of the Report:
|
Report Metric |
Details |
|
Market size available for years |
2016–2023 |
|
Base year considered |
2017 |
|
Forecast period |
2018–2023 |
|
Forecast units |
Value (USD) |
|
Segments covered |
By Product, By Application, and By End User |
|
Geographies covered |
North America, Europe, APAC, Latin America, Middle East, and Africa. |
|
Companies covered |
Air Products and Chemicals, Inc. (U.S.), The Linde Group (Germany), Taiyo Nippon Sanso Corp. (Japan), SOL-SpA (Italy), Air Liquide (France), Praxair, Inc. (U.S.), Atlas Copco (Sweden), Messer Group (Germany), and GCE Holding AB (Sweden). |
The research report categorizes the market into the following segments and subsegments:
Medical gases and equipment Market, By Product
-
Medical Gas
-
Pure Medical Gases, By Type
- Oxygen
- Carbon Dioxide
- Nitrous Oxide
- Nitrogen
- Medical Air
- Helium
-
Pure Medical Gases, By Form of Delivery
- High Pressure Cylinders
- Liquid Tanks
- Bulk Delivery
-
Medical Gas Mixtures
- Blood-gas Mixtures
- Lung Diffusion Mixtures
- Nitrous oxide-oxygen Mixtures
- Carbon dioxide-oxygen Mixtures
- Laser-gas Mixtures
- Aerobic Mixtures
- Anaerobic Mixtures
- Ethylene Oxide
- Helium-oxygen Mixtures
-
Pure Medical Gases, By Type
-
Medical gas equipment
-
Equipment Accessories
- Hoses
- Manifolds
- Regulators
- Flowmeters
- Suction Regulators
- Vacuum Systems
- Outlets
- Monitoring Systems
- Valve with Integrated Pressure Regulator
- Medical Air Compressors
- Cryogenic Products
- Gas Delivery Systems
-
Equipment Accessories
Medical gases and equipment Market, By Application
-
Therapeutic
- Respiratory Diseases
- Cardiovascular Diseases
- Anesthesia
- Cryosurgery
- Others
-
Diagnostics
- Medical Imaging
- General laboratory Use
-
Pharmaceutical manufacturing and research
- Drug Discovery
- Process Development
- Pharmaceutical Manufacturing
- Quality Control
- Other Therapeutic Applications (Tissue and Platelet Preservation)
Medical gases and equipment Market, By End User
- Hospitals
- Home Healthcare
- Pharmaceutical and Biopharmaceutical Companies
- Diagnostic and Research Laboratories
- Academic Institutes and Research Institutes
Medical gases and equipment Market, by Region
-
North America
- US
- Canada
-
Europe
- Germany
- UK
- France
- Italy
- Spain
- Rest of Europe
-
Asia Pacific
- China
- Japan
- India
- Australia
- South Korea
- Rest of Asia Pacific
-
Latin America
- Brazil
- Mexico
- Argentina
- Rest of Latin America
- Middle East and Africa
Available Customizations
With the given market data, MarketsandMarkets offers customizations as per the company’s specific needs. The following customization options are available for the report:
Product Analysis
- Product matrix which gives a detailed comparison of the further segmentation of medical gases and equipment portfolios of the top companies
Company Information
- Detailed analysis and profiling of additional market players
Geographic Analysis
- Further breakdown of the Middle East & Africa medical gas market into GCC countries, South Africa, and rest of Middle East and Africa.

 Generating Response ...


Growth opportunities and latent adjacency in Medical Gas Market