Metal Packaging Market by Type (Cans, Caps & Closures, Barrels & Drums, & Others), Raw Material (Steel, Aluminum, & Others), & by Application (Food , Beverages, Healthcare, Personal Care & Others) - Trends and Forecast to 2020


[210 Pages Report] The global market is projected to reach $135.69 Billion by 2020, with a CAGR of 3.0% from 2015 to 2020. The North America region accounted for around 34.4 % of the total market share in terms of value, followed by the European and Asia-Pacific regions. In the recent years, Asia-Pacific has tremendously progressed in the metal packaging market which primarily includes emerging markets such as India and China. The North America realm held the majority of share in 2015 and accounted 34.4% of the total market, followed by Europe and Asia-pacific market with the share of 31.6% and 22.5% respectively. The main driving force in North America region is the changing lifestyle and convenience of packaged products. The emerging economies such as India and China have played a vital role in the rising growth rate of the industry.
Increased urbanization and the need to maintain a healthy lifestyle has led to an increased demand for use of metal packaging. The driver for global market is the increase in consumer preference for processed and packaged foods. Metal packaging is attaining popularity because of changing consumer taste, rising sale of grocery products including frozen and chilled food, and changing lifestyle. Improving standard of living, rising income, steadily growing economies, and increasing alcoholic consumption represent key growth drivers in the Asia-Pacific region.
Pharmaceuticals and cosmetics industry is propelling the growth of this market as metal protects the content from external environment. Increasing beverage and canned food stimulate demand of the metal packaging market. Recycling of the end product ( can, metal container, drums, and others) in the product life cycle without degradation in the quality, adds to an advantage over other packaging material like plastic and paper.
Metal cans are the most recycled packaging containers across the globe. In several countries such as Germany, Brazil, Switzerland, and China, the recycling rate of metal packaging product is 90% or more. By using recycled aluminum, greenhouse gas emission is reduced by 95%.
Metal Packaging Market Share, by Region, 2014 ($Million)
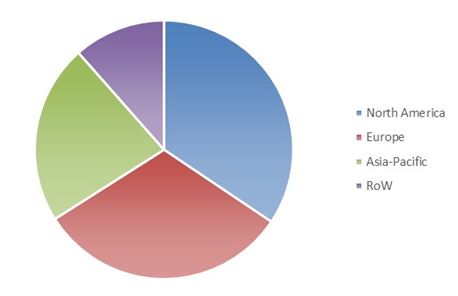
Source: Expert Interviews and MarketsandMarkets Analysis
This report estimates the market size of the global market in terms of value ($million) and volume (KT). In this report, the market is broadly segmented based on type, material, application, and region. Market drivers, restraints, challenges, raw material, and product price trends are discussed in detail. Market share, by participant, for the overall market is discussed in detail. The global market has grown significantly in the last few years and this trend is expected to continue. Increasing urbanized population, rising food and beverage industry, increasing consumption of canned product, and increasing use of recyclable raw material drive the growth of the metal packaging market.
Get online access to the report on the World's First Market Intelligence Cloud
Request Sample Scope of the Report

This research study categorizes the global market based on type, material, application, and region:
Based on Type:
- Cans
- Caps & Closures
- Barrels & Drums
- Others (Others include aerosol, tube, and lid)
Based on Raw Material:
- Steel
- Aluminum
- Others (Others include tin)
Based on Application:
- Beverage
- Food
- Healthcare
- Personal care
- Other (others includes industrial bulk, shipping, and cosmetic)
Based on Region:
- North America
- Europe
- Asia-Pacific
- Rest of the World (RoW)
The metal packaging market has been growing in accordance with the construction industry. With increasing urbanized population, increasing consumption pattern of canned food, developing economics, increase in the usage of recycled material in the manufacturing process, and significantly increased demand for packaged food are the main aspects which would drive this market
Increasing urbanization, demand of packaged food and aerosol products, consumption of canned food, and recycling rate are propelling the growth of this market . The competition from paper and plastic packaging poses a challenge to the metal packaging market.
Metal Packaging Market Size (Value), by Type, 2014-2020 ($Million)
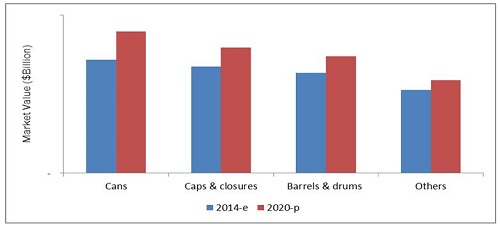
E- Estimated, P-Projected
Source: Expert Interviews and MarketsandMarkets Analysis
The global market is projected to be valued at $135.69 billion by 2020. The Asia-Pacific region is projected to grow at the highest CAGR of 4.4% during the review period, that is, from 2015 to 2020.
The growth of this market is primarily driven by the following:
- Increasing urbanized population
- Developing economies and GDP
- Increasing consumption of canned food
- Rising demand of packaged food
The food segment is projected to grow at the highest CAGR of 4.0% from 2015 to 2020. The metal packaging market was dominated by steel material segments, which accounted for 68% of the total market in 2014.
The global market is marked with intense competition due to the presence of a large number of both big and small firms. New product launches, mergers & acquisitions, and partnerships and expansions are the key strategies adopted by market players to ensure their growth in the market. The key players in this market are Alcoa Incorporated (U.S.), Amcor Limited (Australia), Ardagh Group (Europe), Ball Corporation (U.S.), CPMC (China), Crown Holdings (Europe), Greif Incorporated (U.S.), Silgan Holdings (Connecticut, U.S.), Rexam Plc (U.K.), and Ton Yi Industrial (China).
Table of Contents
1 Introduction (Page No. - 19)
1.1 Objectives of the Study
1.2 Market Definition
1.3 Study Scope
1.3.1 Markets Covered
1.3.2 Years Considered for the Study
1.4 Currency
1.5 Limitations
1.6 Stakeholders
2 Research Methodoloy (Page No. - 22)
2.1 Research Data
2.1.1 Secondary Data
2.1.1.1 Key Data From Secondary Sources
2.1.2 Primary Data
2.1.2.1 Key Data From Primary Sources
2.1.2.2 Breakdown of Primary Interviews
2.2 Demand-Side Analysis
2.2.1 Increasing Population
2.2.2 Increasing Expenditure
2.3 Market Size Estimation
2.4 Market Breakdown and Data Triangulation
2.5 Market Share Estimation
2.6 Research Assumptions and Limitations
2.6.1 Asssumptions
2.6.2 Limitations
3 Executive Summary (Page No. - 32)
4 Premium Insights (Page No. - 36)
4.1 India & China: Fastest Growing Markets in the Coming Years for the Metal Packaging Market
4.2 CANS Segment Would Lead the Metal Packaging Market in 2015
4.3 Makrets in Japan & China Captured Largest Share in the Emerging Asia-Pacific Market in 2014
4.4 Asia-Pacific & North America Will Be Prime Revenue Generators for the Metal Packaging Market By 2020
4.5 Metal Packaging Market: Developed vs Developing Nations
4.6 Metal Packaging Market Size, By Application, 2020
4.7 Lifecycle Analysis, By Region
5 Market Overview (Page No. - 44)
5.1 Introduction
5.2 Market Evolution
5.3 Market Segmentation
5.3.1 By Type
5.3.2 By Raw Material
5.3.3 By Application
5.3.4 By Region
5.4 Market Dynamics
5.4.1 Drivers
5.4.1.1 Increasing Urbanized Population
5.4.1.2 Rising Demand for Packaged Food
5.4.1.3 Rising Demand for Aerosol Products
5.4.1.4 Increasing Consumption of Canned Food
5.4.1.5 Recyclability of Steel and Aluminium
5.4.2 Restraint
5.4.2.1 Introduction of Pet Bottles
5.4.3 Opportunities
5.4.3.1 Growing Food Market
5.4.3.2 Growing Beverages Market
5.4.4 Challenges
5.4.4.1 Competition From Plastic Packaging
6 Industry Trends (Page No. - 55)
6.1 Introduction
6.2 Value Chain Analysis
6.3 Porter’s Five Forces Analysis
6.3.1 Threat of New Entrants
6.3.1.1 High Capital Requirement
6.3.1.2 High Product Differentiation Requirement
6.3.2 Threat of Substitutes
6.3.2.1 Availability of Plastic and Glass
6.3.3 Bargaining Power of Suppliers
6.3.3.1 Few and Large Suppliers
6.3.4 Bargaining Power of Buyers
6.3.4.1 Ability of Buyers to Integrate Backwards
6.3.5 Intensity of Competitive Rivalry
6.3.5.1 Excess Capacity
7 Metal Packaging Market,By Type (Page No. - 60)
7.1 Introduction
7.2 CANS
7.2.1 CANS in Metal Packaging Market, By Application
7.2.1.1 Beverage Application has Largest Share in Can Type Market
7.2.2 CANS in Metal Packaging Market, By Region
7.2.2.1 Asia-Pacific Region has the Largest Can Market
7.3 Caps & Closures
7.3.1 Caps & Closures Market, By Application
7.3.1.1 Innovations and Inclination Towards Convenient Packaging are Main Drivers of Caps & Closures Market
7.3.2 Caps & Closures Market, By Region
7.3.2.1 Asia-Pacific Region is the Fastest Growing Beckoned By Developing Nations Like India, and China
7.4 Barrels & Drums
7.4.1 Barrels & Drums in Metal Packaging Market, By Application
7.4.1.1 Food Application Accounted for the Largest Share in the Barrels & Drums Type
7.4.2 Barrels & Drums in Metal Packaging Market, By Region
7.4.2.1 Asia-Pacific Accounted for the Largest Share in the Barrels & Drums Metal Packaging Type
7.5 Others
7.5.1 Others in Metal Packaging Market, By Application
7.5.1.1 Food Application Accounted for the Largest Share in the Others Metal Packaging Type
7.5.2 Others in Metal Packaging Market, By Region
7.5.2.1 North America Accounted for the Largest Share in Other Metal Packaging Application
8 Metal Packaging Market, By Material (Page No. - 75)
8.1 Introduction
8.2 Aluminum
8.2.1 Aluminum in Metal Packaging Market, By Application
8.2.1.1 Food Industry are Increasingly Adopting Aluminum as Metal Packaging Solutions
8.2.2 Aluminum in Metal Packaging Market, By Region
8.2.2.1 North America is Projected to Grow at the Highest CAGR in the Aluminum Segment
8.3 Steel
8.3.1 Steel in Metal Packaging Market, By Application:
8.3.1.1 Growing Demand of Tin-Plate is Driving the Growth of the Steel Market
8.3.2 Steel in Metal Packaging Market, By Region
8.3.2.1 North America Dominated the Steel Segment in the Metal Packaging Market
8.4 Others
8.4.1 Others in Metal Packaging Market, By Application
8.4.1.1 Food and Beverage are Growing at A Healthy CAGR in the Others Metal Packaging Material Market
8.4.2 Others in Metal Packaging Market, By Region
8.4.2.1 North America Dominates the Others Metal Packaging Market
9 Metal Packaging Market, By Application (Page No. - 86)
9.1 Introduction
9.2 Food
9.2.1 Metal Packaging in Food Market, By Type
9.2.1.1 Can Type is Projected to Grow at the Highest CAGR in the Food Application
9.2.2 Metal Packaging in Food Market, By Material
9.2.2.1 Aluminum Accounted for the Largest Share in the Food Application
9.2.3 Metal Packaging in Food Market, By Region
9.2.3.1 North America and Asia-Pacific are Growing at Highest CAGR in the Food Application
9.3 Beverage
9.3.1 Metal Packaging in Beverage Market, By Type
9.3.1.1 Caps & Closures Type is Expected to Grow at the Second Highest CAGR in the Beverage Application
9.3.2 Metal Packaging in Beverage Market, By Material
9.3.2.1 Aluminum is the Most Preferred Raw Material in the Beverage Application
9.3.3 Metal Packaging in Beverage Market, By Region
9.3.3.1 Asia-Pacific is the Dominant Region as Far as the Beverage Market Metal Packaging Segment
9.4 Healthcare
9.4.1 Metal Packaging in Healthcare Market, By Type
9.4.1.1 CANS Type is Projected to Grow at the Highest CAGR in the Healthcare Application
9.4.2 Healthcare, By Material
9.4.2.1 Steel Accounted for the Second Largest Share in the Healthcare Application
9.4.3 Metal Packaging in Healthcare Market, By Region
9.4.3.1 North America is Growing at the Highest CAGR in the Healthcare Application
9.5 Personal Care
9.5.1 Metal Packaging in Personal Care Market, By Type
9.5.1.1 Caps & Closures is Projected to Grow at the Second Highest CAGR in the Personal Care Application
9.5.2 Metal Packaging in Personal Care Market, By Material
9.5.2.1 Steel is the Most Preferred Raw Material in the Personal Care Application
9.5.3 Metal Packaging in Personal Care Market, By Region
9.5.3.1 RoW is the Second Largest Region as Far the Personal Care Metal Packaging Application Segment
9.6 Others
9.6.1 Others, By Type
9.6.1.1 CANS is the Expected to Grow at the Highest CAGR in the Others Application
9.6.2 Metal Packaging in Others Market, By Material
9.6.2.1 Steel Accounted for the Second Largest Share in the Others Application
9.6.3 Others, By Region
9.6.3.1 North America is Growing at the Highest CAGR in the Others Application
10 Metal Packaging, By Region (Page No. - 106)
10.1 Introduction
10.1.1 Metal Packaging is Projected to Grow at A Healthy CAGR During the Forecast Period
10.2 Asia-Pacific
10.2.1 China
10.2.1.1 China, By Type
10.2.1.1.1 CANS Segment is the Dominating Metal Packaging Type in China
10.2.1.2 China, By Application
10.2.1.2.1 The Growing Demand for Canned Food and Beverages are Driving Food Segment Application
10.2.2 India
10.2.2.1 India, By Type
10.2.2.1.1 CANS Segment is Projected to Grow at A Highest CAGR By 2020, in India
10.2.2.2 India, By Application
10.2.2.2.1 The Food Segment is Dominating in India, at A Healthy CAGR%
10.2.3 Japan
10.2.3.1 Japan, By Type
10.2.3.1.1 The Rising Demand for Canned Sea-Food is Driving the CANS Segment
10.2.3.2 Japan, By Application
10.2.3.2.1 The Food and Beverages Segments are Dominating in Japan
10.2.4 Australia
10.2.4.1 Australia, By Type
10.2.4.1.1 The Rising Demand for Canned Food is Driving the CANS Segment
10.2.4.2 Australia, By Application
10.2.4.2.1 The Demand for Food Segment is Estimated to Increase Over the Projected Period
10.2.5 Rest of Asia-Pacific
10.2.5.1 Rest of Asia-Pacific: By Type
10.2.5.1.1 The Rising Demand for Canned Food is Driving the CANS Segment
10.2.5.2 Asia-Pacific Metal Packaging Market, By Application
10.2.5.2.1 The Rising Demand for Canned Food is Driving the Food Segment
10.3 Europe
10.3.1 Germany
10.3.1.1 Germany Metal Packaging Market, By Type
10.3.1.1.1 The CANS Segment is Largest in Germany
10.3.1.2 Germany Metal Packaging Market, By Application
10.3.1.2.1 The Rising Demand for Alcohol is Driving the Segment
10.3.2 U.K.
10.3.2.1 U.K. Metal Packaging Market, By Type
10.3.2.1.1 The Increasing Alcohol Consumption is Driving CANS Segment in U.K.
10.3.2.2 U.K. Metal Packaging Market, By Application
10.3.2.2.1 The Increasing Demand for Canned Food is Driving Food Segment in U.K.
10.3.3 Italy
10.3.3.1 Italy Metal Packaging Market, By Type
10.3.3.1.1 CANS Segment is the Largest Segment in Italy
10.3.3.2 Italy: Metal Packaging Market, By Application
10.3.3.2.1 CANS Segment is the Largest Segment in Italy
10.3.4 France
10.3.4.1 France Metal Packaging Market, By Type
10.3.4.1.1 Rising Demand for Canned Vegetables and Foods is Driving CANS Segment in France
10.3.4.2 France Metal Packaging Market, By Application
10.3.4.2.1 Food Segment is the Largest Segment in France
10.3.5 Rest of Europe
10.3.5.1 Rest of Europe Metal Packaging Market, By Type
10.3.5.1.1 CANS is the Largest Segment in Rest of Europe
10.3.5.2 Rest of Europe Metal Packaging Market, By Application
10.3.5.2.1 Food Segment is the Largest Segment in Rest of Europe
10.4 North America
10.4.1 U.S.
10.4.1.1 U.S. Metal Packaging Market, By Type
10.4.1.1.1 CANS Segment is the Largest Segment in U.S.
10.4.1.2 U.S. Metal Packaging Market, By Application
10.4.1.2.1 Increased Demand in Canned Food is Driving U.S. Market
10.4.2 Canada
10.4.2.1 Canada Metal Packaging Market, By Type
10.4.2.1.1 CANS is the Largest Segment in Canada
10.4.2.2 Canada Metal Packaging Market, By Application
10.4.2.2.1 CANS is the Largest Segment in Canada
10.4.3 Mexico
10.4.3.1 Mexico Metal Packaging Market, By Type
10.4.3.1.1 CANS Segment is Projected to Be the Largest Market By 2020
10.4.3.2 Mexico Metal Packaging Market, By Application
10.4.3.2.1 Food Segment is the Largest Market in Mexico
10.5 Rest of the World (RoW)
10.5.1 Latin America
10.5.1.1 Latin America Metal Packaging Market, By Type
10.5.1.1.1 CANS Segment is Projected to Be the Largest Market By 2020
10.5.1.2 Latin America Metal Packaging Market, By Application
10.5.1.2.1 Food Segment is Projected to Be the Largest Market By 2020
10.5.2 The Middle East
10.5.2.1 The Middle East Metal Packaging Market, By Type
10.5.2.1.1 The Rising Demand of Canned Foods and Aerosol Products are Driving the Middle East Market
10.5.2.2 The Middle East Metal Packaging Market, By Application
10.5.2.2.1 Food Segment is Projected to Be the Largest Market By 2020 in the Middle East
10.5.3 Others in RoW
10.5.3.1 Others in RoW Metal Packaging Market, By Type
10.5.3.1.1 The Canned Foods and Vegetables is Driving the Others in RoW
10.5.3.2 The Others in RoW Metal Packaging Market, By Application
10.5.3.2.1 Food Segment is the Largest Market in the Others in RoW
11 Competitive Landscape (Page No. - 165)
11.1 Overview
11.2 Market Share Analysis
11.3 Competitive Situation & Trends
11.4 Mergers & Acquistions
11.5 New Product Launches
11.6 New Capacity
11.7 Divestitures
12 Company Profiles (Page No. - 173)
(Company at A Glance, Recent Financials, Products & Services, Strategies & Insights, & Recent Developments)*
12.1 Introduction
12.2 Alcoa Incorporated
12.3 Amcor Limited
12.4 Ardagh Group
12.5 Ball Corporation
12.6 Crown Holdings, Incorporated
12.7 Bway Corporation
12.8 CPMC Holdings Limited
12.9 Greif Incorporated
12.10 Rexam PLC
12.11 Silgan Holdings, Incorporated
12.12 Ton YI Industrial Corporation
*Details on Company at A Glance, Recent Financials, Products & Services, Strategies & Insights, & Recent Developments Might Not Be Captured in Case of Unlisted Companies.
13 Appendix (Page No. - 205)
13.1 Insights of Industry Experts
13.2 Discussion Guide
13.3 Introducing RT: Real Time Market Intelligence
13.4 Available Customizations
13.5 Related Reports
List of Tables (172 Tables)
Table 1 Regional Urbanization Prospects
Table 2 Increasing Urbanization, Demand for Packaged Food & Aerosol Products,Consumption of Canned Food, and Recycling Rate are Propelling the Growth of the Metal Packaging Market
Table 3 Introduction of Pet Bottles Restrain Market Growth
Table 4 Growing Food & Beverages Markets are Opportunities for the Metal Packaging Market
Table 5 Facing Competition From Plastic Packaging
Table 6 Size, By Type, 2013–2020 (Kilo Tons)
Table 7 Size, By Type, 2013–2020 ($Billion)
Table 8 CANS Size, By Application, 2013–2020 (Kilo Tons)
Table 9 CANSSize , By Application, 2013–2020 ($Billion)
Table 10 CANS, By Region, 2013–2020 (Kilo Tons)
Table 11 CANS Size, By Region, 2013–2020 ($Billion)
Table 12 Caps & Closures Market Size, By Application, 2013–2020 (Kilo Tons)
Table 13 Caps & Closure Market Size , By Application, 2013–2020 ($Billion)
Table 14 Caps & Closures Market, By Region, 2013–2020 (Kilo Tons)
Table 15 Caps & Closure Market Size, By Region, 2013–2020 ($Billion)
Table 16 Barrels & Drums in Metal Packaging Market Size, By Application, 2013–2020 (Kilo Tons)
Table 17 Barrels & Drums Market Size , By Application, 2013–2020 ($Billion)
Table 18 Barrels & Drums in Metal Packaging Market, By Region, 2013–2020 (Kilo Tons)
Table 19 Barrels & Drums in Metal Packaging Market Size, By Region, 2013–2020 ($Billion)
Table 20 Others in Metal Packaging Market Size, By Application, 2013–2020 (Kilo Tons)
Table 21 Others in Metal Packaging Market Size , By Application, 2013–2020 ($Billion)
Table 22 Others in Metal Packaging Market Size, By Region, 2013–2020 (Kilo Tons)
Table 23 Others Market Size, By Region, 2013–2020 ($Billion)
Table 24 Aluminum Segment Expected to Grow at A CAGR of 3.3% By 2020
Table 25 Size, By Material, 2013-2020 (Kilo Tons)
Table 26 Size, By Material, 2013-2020 ($Billion)
Table 27 Aluminum in Metal Packaging Market Size, By Application, 2013-2020 (Kilo Tons)
Table 28 Aluminum in Metal Packaging Market, By Application, 2013-2020 ($Billion)
Table 29 Aluminum in Metal Packaging Market Size, By Region, 2013-2020 (Kilo Tons)
Table 30 Aluminum in Metal Packaging Market Size, By Region, 2013-2020 ($Billion)
Table 31 Steel in Metal Packaging Market Size, By Application, 2013-2020 (Kilo Tons)
Table 32 Steel in Metal Packaging Market Size, By Application, 2013-2020 ($Billion)
Table 33 Steel in Metal Packaging Market Size, By Region, 2013-2020 (Kilo Tons)
Table 34 Steel in Metal Packaging Market Size, By Region, 2013-2020 ($Billion)
Table 35 Others in Size, By Application, 2013-2020 (Kilo Tons)
Table 36 Others in Size, By Application, 2013-2020 ($Billion)
Table 37 Others in Size, By Region, 2013-2020 (Kilo Tons)
Table 38 Others in Size, By Region, 2013-2020 ($Billion)
Table 39 Size, By Application, 2013-2020 (Kilo Tons)
Table 40 Size, By Application, 2013-2020 ($Billion)
Table 41 Metal Packaging in Food Market Size, By Type, 2013-2020 (Kilo Tons)
Table 42 Metal Packaging in Food Market Size, By Type, 2013-2020 ($Billion)
Table 43 Metal Packaging in Food Market Size, By Material, 2013-2020 (Kilo Tons)
Table 44 Metal Packaging in Food Market Size, By Material, 2013-2020 ($Billion)
Table 45 Metal Packaging in Food Market Size, By Region, 2013-2020 (Kilo Tons)
Table 46 Metal Packaging in Food Market Size, By Region, 2013-2020 ($Billion)
Table 47 Metal Packaging in Beverage Market Size, By Type, 2013-2020 (Kilo Tons)
Table 48 Metal Packaging in Beverage Market Size, By Type, 2013-2020 ($Billion)
Table 49 Metal Packaging in Beverage Market Size, By Material, 2013-2020 (Kilo Tons)
Table 50 Metal Packaging in Beverage Market Size, By Material, 2013-2020 ($Billion)
Table 51 Metal Packaging in Beverage Market Size, By Region, 2013-2020 (Kilo Tons)
Table 52 Beverage Size, By Region, 2013-2020 ($Billion)
Table 53 Metal Packaging in Healthcare Market Size, By Type, 2013-2020 (Kilo Tons)
Table 54 Metal Packaging in Healthcare Market Size, By Type, 2013-2020 ($Billion)
Table 55 Metal Packaging in Healthcare Market Size, By Material, 2013-2020 (Kilo Tons)
Table 56 Metal Packaging in Healthcare Market Size, By Material, 2013-2020 ($Billion)
Table 57 Metal Packaging in Healthcare Market Size, By Region, 2013-2020 (Kilo Tons)
Table 58 Healthcare Size, By Region, 2013-2020 ($Billion)
Table 59 Metal Packaging in Personal Care Market Size, By Type, 2013-2020 (Kilo Tons)
Table 60 Metal Packaging in Personal Care Market Size, By Type, 2013-2020 ($Billion)
Table 61 Metal Packaging in Personal Care Market Size, By Material, 2013-2020 (Kilo Tons)
Table 62 Metal Packaging in Personal Care Market Size, By Material, 2013-2020 ($Billion)
Table 63 Metal Packaging in Personal Care Market Size, By Region, 2013-2020 (Kilo Tons)
Table 64 Metal Packaging in Personal Care Market Size, By Region, 2013-2020 ($Billion)
Table 65 Metal Packaging in Others Market Size, By Type, 2013-2020 (Kilo Tons)
Table 66 Metal Packaging in Others Market Size, By Type, 2013-2020 ($Billion)
Table 67 Metal Packaging in Others Market Size, By Material, 2013-2020 (Kilo Tons)
Table 68 Metal Packaging in Others Market Size, By Material, 2013-2020 ($Billion)
Table 69 Metal Packaging in Others Market Size, By Region, 2013-2020 (Kilo Tons)
Table 70 Metal Packaging in Others Market Size, By Region, 2013-2020 ($Billion)
Table 71 Size, By Region, 2013-2020 (Kilo Tons)
Table 72 Size, By Region, 2013-2020 ($Billion)
Table 73 Asia-Pacific Size, By Country, 2013-2020 (Kilo Tons)
Table 74 Asia-Pacific: By Market Size, By Country, 2013-2020 ($Billion)
Table 75 Asia-Pacific By Market Size, By Type, 2013-2020 (Kilo Tons)
Table 76 Asia-Pacific By Market Size, By Type, 2013-2020 ($Billion)
Table 77 Asia-Pacific By Market Size, By Application, 2013-2020 (Kilo Tons)
Table 78 Asia-Pacific By Market Size, By Application, 2013-2020 ($Billion)
Table 79 Asia-Pacific By Market Size, By Material, 2013-2020 (Kilo Tons)
Table 80 Asia-Pacific By Market Size, By Material, 2013-2020 ($Billion)
Table 81 China Size, By Type, 2013-2020 (Kilo Tons)
Table 82 China By Market Size, By Type, 2013-2020 ($Billion)
Table 83 China By Market Size, By Application, 2013-2020 (Kilo Tons)
Table 84 China By Market Size, By Application, 2013-2020 ($Billion)
Table 85 India: Size, By Type, 2013-2020 (Kilo Tons)
Table 86 India: By Market Size, By Type, 2013-2020 ($Billion)
Table 87 India By Market Size, By Application, 2013-2020 (Kilo Tons)
Table 88 India By Market Size, By Application, 2013-2020 ($Billion)
Table 89 Japan Size, By Type, 2013-2020 (Kilo Tons)
Table 90 Japan By Market Size, By Type, 2013-2020 ($Billion)
Table 91 Japan By Market Size, By Application, 2013-2020 (Kilo Tons)
Table 92 Japan By Market Size, By Application, 2013-2020 ($Billion)
Table 93 Australia Size, By Type, 2013-2020 (Kilo Tons)
Table 94 Australia By Market Size, By Type, 2013-2020 ($Billion)
Table 95 Australia By Market Size, By Application, 2013-2020 (Kilo Tons)
Table 96 Australia By Market Size, By Application, 2013-2020 ($Billion)
Table 97 Rest of Asia-Pacific: Size, By Type, 2013-2020 (Kilo Tons)
Table 98 Rest of Asia-Pacific: By Market Size, By Type, 2013-2020 ($Billion)
Table 99 Rest of Asia-Pacific By Market Size, By Application, 2013-2020 (Kilo Tons)
Table 100 Rest of Asia-Pacific By Market Size, By Application, 2013-2020 ($Billion)
Table 101 Europe Size, By Country, 2013-2020 (Kilo Tons)
Table 102 Europe Size, By Country, 2013-2020 ($Billion)
Table 103 Europe Size, By Type, 2013-2020 (Kilo Tons)
Table 104 Europe Size, By Type, 2013-2020 ($Billion)
Table 105 Europe Size, By Application, 2013-2020 (Kilo Tons)
Table 106 Europe Size, By Application, 2013-2020 ($Billion)
Table 107 Europe Size, By Material, 2013-2020 (Kilo Tons)
Table 108 Europe: Size, By Material, 2013-2020 ($Billion)
Table 109 Germany Size, By Type, 2013-2020 (Kilo Tons)
Table 110 Germany Size, By Type, 2013-2020 ($Billion)
Table 111 Germany Size, By Application, 2013-2020 (Kilo Tons)
Table 112 Germany Size, By Application, 2013-2020 ($Billion)
Table 113 U.K. Size, By Type, 2013-2020 (Kilo Tons)
Table 114 U.K. Size, By Type, 2013-2020 ($Billion)
Table 115 U.K. Size, By Application, 2013-2020 (Kilo Tons)
Table 116 U.K. Size, By Application, 2013-2020 ($Billion)
Table 117 Italy Size, By Type, 2013-2020 (Kilo Tons)
Table 118 Italy: Size, By Type, 2013-2020 ($Billion)
Table 119 Italy: Size, By Application, 2013-2020 (Kilo Tons)
Table 120 Italy: Size, By Application, 2013-2020 ($Billion)
Table 121 France Size, By Type, 2013-2020 (Kilo Tons)
Table 122 France Size, By Type, 2013-2020 ($Billion)
Table 123 France Size, By Application, 2013-2020 (Kilo Tons)
Table 124 France: Size, By Application, 2013-2020 ($Billion)
Table 125 Rest of Europe Size, By Type, 2013-2020 (Kilo Tons)
Table 126 Rest of Europe Size, By Type, 2013-2020 ($Billion)
Table 127 Rest of Europe Size, By Application, 2013-2020 (Kilo Tons)
Table 128 Rest of Europe Size, By Application, 2013-2020 ($Billion)
Table 129 North America Size, By Country, 2013-2020 (Kilo Tons)
Table 130 North America Size, By Country, 2013-2020 ($Billion)
Table 131 North America Size, By Type, 2013-2020 (Kilo Tons)
Table 132 North America Size, By Type, 2013-2020 ($Billion)
Table 133 North America Size, By Application, 2013-2020 (Kilo Tons)
Table 134 North America Size, By Application, 2013-2020 ($Billion)
Table 135 North America Metal Packaging Size, By Material, 2013-2020 (Kilo Tons)
Table 136 North America Metal Packaging Size, By Material, 2013-2020 ($Billion)
Table 137 U.S. Metal Packaging Size, By Type, 2013-2020 (Kilo Tons)
Table 138 U.S. Metal Packaging Size, By Type, 2013-2020 ($Billion)
Table 139 U.S. Metal Packaging Size, By Application, 2013-2020 (Kilo Tons)
Table 140 U.S. Metal Packaging Size, By Application, 2013-2020 ($Billion)
Table 141 Canada Metal Packaging Size, By Type, 2013-2020 (Kilo Tons)
Table 142 Canada Size, By Type, 2013-2020 ($Billion)
Table 143 Canada Size, By Application, 2013-2020 (Kilo Tons)
Table 144 Canada Size, By Application, 2013-2020 ($Billion)
Table 145 Mexico Size, By Type, 2013-2020 (Kilo Tons)
Table 146 Mexico Size, By Type, 2013-2020 ($Billion)
Table 147 Mexico Size, By Application, 2013-2020 (Kilo Tons)
Table 148 Mexico Size, By Application, 2013-2020 ($Billion)
Table 149 RoW: Size, By Country, 2013-2020 (Kilo Tons)
Table 150 RoW Size, By Country, 2013-2020 ($Billion)
Table 151 RoW Size, By Type, 2013-2020 (Kilo Tons)
Table 152 RoW Size, By Type, 2013-2020 ($Billion)
Table 153 RoW Size, By Application, 2013-2020 (Kilo Tons)
Table 154 RoW Size, By Application, 2013-2020 ($Billion)
Table 155 RoW Size, By Material, 2013-2020 (Kilo Tons)
Table 156 RoW Size, By Material, 2013-2020 ($Billion)
Table 157 Latin America Size, By Type, 2013-2020 (Kilo Tons)
Table 158 Latin America Size, By Type, 2013-2020 ($Billion)
Table 159 Latin America Size, By Application, 2013-2020 (Kilo Tons)
Table 160 Latin America Size, By Application, 2013-2020 ($Billion)
Table 161 The Middle East Size, By Type, 2013-2020 (Kilo Tons)
Table 162 The Middle East Size, By Type, 2013-2020 ($Billion)
Table 163 The Middle East Size, By Application, 2013-2020 (Kilo Tons)
Table 164 The Middle East: Size, By Application, 2013-2020 ($Billion)
Table 165 Others in RoW Size, By Type, 2013-2020 (Kilo Tons)
Table 166 Others in RoW Size, By Type, 2013-2020 ($Billion)
Table 167 Others in RoW Size, By Application, 2013-2020 (Kilo Tons)
Table 168 Others in RoW Size, By Application, 2013-2020 ($Billion)
Table 169 Mergers & Acqusitions 2014–2015
Table 170 New Product Launches, 2014-2015
Table 171 New Capacity, 2014-2015
Table 172 Divestiture
List of Figures (63 Figures)
Figure 1 Markets Covered: Metal Packaging Market
Figure 2 Metal Packaging Market: Research Design
Figure 3 Breakdown of Primary Interviews: By Company Type, Designation & Region
Figure 4 Population is Expected to Reach 9 Billion By 2050
Figure 5 Asia-Pacific Population is Expected to Reach 5.1 Billion By 2050
Figure 6 Expenditure By Region From 2009 to 2030
Figure 7 Market Size Estimation Methodology: Bottom-Up Approach
Figure 8 Data Triangulation
Figure 9 Metal Packaging Market Snapshot (2014 vs 2020): Market for CANS to Grow at the Highest CAGR From 2015 to 2020
Figure 10 Asia-Pacific is the Fastest-Growing Country for the Metal Packaging Market in 2014
Figure 11 Leading Market Players Adopted Mergers & Acquisitions as the Key Strategy During 2011-2015
Figure 12 Attractive Market Opportunities in the Metal Packaging Market
Figure 13 Metal Packaging Market (CAGR%), By Top 10 Countries, 2015 to 2020
Figure 14 CANS Segement is Expected to Dominate the Metal Packaging Market in 2015 ($Billion)
Figure 15 Metal Packaging Market Share (Value), By Region, 2015-2020
Figure 16 Metal Packaging Market Size, By Country, 2015? 2020 ($Billion)
Figure 17 Food Application is Expected to Dominate the Market During the Forecast Period
Figure 18 Asia-Pacific Region is the Fastest-Growing Market
Figure 19 Metal Packaging: Market Evolution
Figure 20 Market Segmentation of Metal Packaging Market
Figure 21 Segmentation of the Metal Packaging Market, By Type
Figure 22 Segmentation of the Metal Pacakging Market, By Raw Material
Figure 23 Segmentation of the Metal Packaging Market, By Application
Figure 24 Segmentation of the Metal Packaging Market, By Region
Figure 25 Market Dynamics of Metal Packaging Market
Figure 26 Value Chain Analysis: Major Value is Added During Operation & Recycling
Figure 27 Porter’s Five Forces Analysis
Figure 28 Metal Packaging Market Size Analysis, 2013–2020 ($Billion)
Figure 29 CANS Segment is the Largest By Type Market in From 2013 to 2020
Figure 30 Metal Packaging Market Size, By Material, 2015 vs 2020
Figure 31 Rising Demand of Packaged Food :Prime Source Behind the Growth in Metal Packaging Market
Figure 32 Food Segment is Large, By Application, 2013–2020 ($Billion )
Figure 33 Share (Value), By Application, 2014
Figure 34 North America Captured the Largest Share in 2015 & 2020
Figure 35 Geographic Snapshot (2015-2020): the Asia-Pacific Market Will Experience the Highest Growth Rate
Figure 36 Size, By Region, 2013–2020 ($Billion)
Figure 37 Share (Value), By Region, 2014
Figure 38 Asia-Pacific Metal Packaging Snapshot: China is the Most Lucrative for Matal Packaging Market
Figure 39 Asia-Pacific Share (Value), By Country, 2014
Figure 40 Europe: Share (Value) By Country, 2014
Figure 41 North America Snapshot: U.S. is the Largest Metal Packaging
Figure 42 North America: Share (Value), By Country, 2014
Figure 43 RoW: Metal Packaging Share By Country, 2014 ($Billion)
Figure 44 Companies Adopted Various Growth Strategies in the Past Three Years
Figure 45 Alcoa Incorporated Grew at the Highest Rate During 2011-2014
Figure 46 Mergers and Acquisition: The Key Growth Strategy
Figure 47 Market Evolution Framework
Figure 48 Geographic Revenue Mix of Top 5 Market Players – Reference
Figure 49 Alcoa Incorporated: Company Snapshot
Figure 50 Alcoa Incorporated: SWOT Analysis
Figure 51 Amcor Limited: Company Snapshot
Figure 52 Amcor Limited: SWOT Analysis
Figure 53 Ardagh Group: Company Snapshot
Figure 54 Ardagh Group: SWOT Analysis
Figure 55 Ball Corporation: Company Snapshot
Figure 56 Ball Corporation: SWOT Analysis
Figure 57 Crown Holdings, Incorporated: Company Snapshot
Figure 58 Crown Holdings:SWOT Analysis
Figure 59 CPMC Holdings Limited: Company Snapshot
Figure 60 Greif Incorportaed: Company Snapshot
Figure 61 Rexam PLC: Company Snapshot
Figure 62 Silgan Holdings: Company Snapshot
Figure 63 Ton Yi Industrial Corporation: Company Snapshot


Growth opportunities and latent adjacency in Metal Packaging Market