Microgrid as a Service (MaaS) Market by Grid Type (Grid Connected, and Remote or Islanded), Service Type (Engineering & Design, SAAS, Monitoring & Control, and Operation & Maintenance), Vertical, and Geography - Global Forecast to 2022


The microgrid as a service (MaaS) market was valued at USD 774.9 Million in 2015 and is expected to reach USD 2,241.6 Million by 2022, at a CAGR of 15.86% during the forecast period. The base year considered for the study is 2015, and the forecast for the market size is provided for the period between 2016 and 2022.
The main objectives of this study are as follows:
- To define, describe, and forecast the global microgrid as a service market on the basis of grid type, vertical, service type, and geography
- To provide detailed information regarding the major factors influencing the growth of the market (drivers, restraints, opportunities, and challenges)
- To estimate the size of the Microgrid as a Service Market and its various segments
- To forecast the size of the market segments with respect to the following regions (along with countries): the Americas, Europe, Asia-Pacific (APAC), and Rest of the World (RoW)
The research methodology used to estimate and forecast the microgrid as a service (MaaS) market begins with obtaining data on key vendor revenues through secondary research from sources such as Microgrid World Forum, Mission Critical Magazine, Microgrid Global Innovation Forum, Global Microgrid Institute, Microgrid Knowledge, government sources (World Bank), corporate filings (such as annual reports, investor presentations, and financial statements), and trade, business, and professional associations, microgrid-related journals, certified publications, articles from recognized authors, directories, and database, among others. The vendor offerings have been taken into consideration to determine the market segmentation. The top-down procedure has been employed to arrive at the overall market size of the global MaaS market. After arriving at the overall market size, the total market has been split into several segments and subsegments, which have then been verified through primary research by conducting extensive interviews with key people such as CEOs, VPs, directors, and executives. This data triangulation and market breakdown procedures have been employed to complete the overall market engineering process and arrive at the exact statistics for all segments and subsegments.
To know about the assumptions considered for the study, download the pdf brochure
The MaaS system ecosystem comprises microgrid hardware vendors such as General Electric (U.S.), and Eaton Corp. PLC (Ireland), among others; solution vendors such as Siemens AG (Germany), Pareto Energy (U.S.), Spirae, Inc. (U.S.), and Green Energy Corporation (U.S), among others; system integrators such as Northern Power Systems Corp. (U.S.), and ABB Ltd. (Switzerland), among others; and end users including residential and commercial, industrial, government and education, and utility.
Target Audience:
- Microgrid service providers
- Microgrid systems integrators and developers
- Transmission system operators
- Energy storage vendors
- Smart grid software vendors
- Solar PV companies
- Government agencies
- Utilities
- Investor community
- Research organizations
Get online access to the report on the World's First Market Intelligence Cloud
Request Sample Scope of the Report
:

The global microgrid as a service market, in this research report, has been segmented on the basis of grid type, vertical, service type, and geography.
Global Microgrid as a Service Market, by Grid Type
- Grid Connected
- Remote/Islanded
Global Microgrid as a Service Market, by Vertical
- Government & Education
- Residential & Commercial
- Industrial
- Military
- Utility
Global Microgrid as a Service Market, by Service Type
- Engineering & Design Service
- Software as a Service (SaaS)
- Monitoring & Control Service
- Operation & Maintenance Service
Global Microgrid as a Service Market, by Geography
- Americas
- Europe
- APAC
- RoW
Available Customizations:
With the given market data, MarketsandMarkets offers customizations according to a company�s specific needs. The following customization options are available for the report:
- Company Information
- Detailed analysis and profiling of additional market players (up to five)
The microgrid as a service market was valued at USD 774.9 Million in 2015 and is expected to reach USD 2,241.6 Million by 2022, at a CAGR of 15.86% during the forecast period. Reduction in operational costs and negligible upfront investments by MaaS end users, rising demand from MaaS from hospitals, universities, and remote regions, and high investments by governments in microgrid infrastructure for improved resilience are expected to boost the demand for MaaS in the coming years.
The microgrid as a service (MaaS) market, on the basis of grid type, has been segmented into grid connected and remote or islanded grid types. Among these two segments, the remote or islanded type is expected to grow at the highest rate during the forecast period. Remote/islanded microgrids allow facilities to better manage distributed energy sources and achieve greater control in meeting energy demands.
The microgrid as a service market, on the basis of vertical, has been segmented into government and education, residential and commercial, industrial, military and utility. Among these segments, the market for industrial vertical is expected to grow at the highest CAGR during the forecast period. Lower energy costs, more reliable and better quality power supply, grid resiliency, access to electricity, fuel independence are some of the advantages, which have increased the adoption of microgrid technology in industrial vertical.
The microgrid as a service market, on the basis of service type, has been segmented into engineering and design service, software as a service, monitoring and control service, and operation and maintenance service. The software as a service is expected to grow at the highest rate during the forecast period followed by operation and maintenance service. With software as a service, microgrid owners have a single point of accountability and a reduced risk of project delays and failures. This results in a safer, more reliable, and more cost-efficient microgrid system.
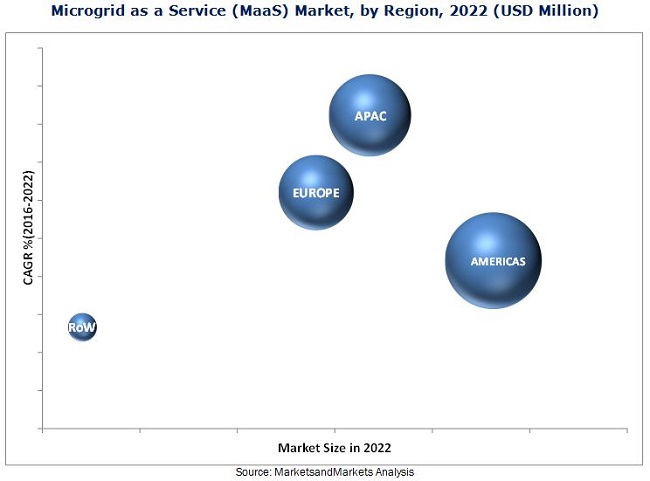
The MaaS market, based on geography, has been segmented into Americas, Europe, APAC, and Rest of the World. The MaaS market in APAC is expected to grow at the highest CAGR during the forecast period. The market growth in APAC can be attributed to the high investments in the microgrid infrastructure, and increasing need for continuous, uninterrupted, and reliable supply of power and electricity.
Dominance of customer-owned microgrids and policies, regulations, and standards are some of the key challenges in the global MaaS market. Key players in this market focus on strategic partnerships, acquisitions, agreements, and new product launches and developments to increase their revenue. For instance, in August 2015, Blue Lake Rancheria (U.S.) and Humboldt State University's Schatz Energy Research Center (U.S.) partnered with Siemens to build a low-carbon community microgrid to power the government offices, economic enterprises, and critical Red Cross safety shelter-in-place facilities. This project is estimated to reduce 150 tons of carbon per year. In February 2015, Exelon Corp. entered into a partnership with Anbaric Transmission (U.S.) to create a series of microgrids in New York. The collaboration was meant for establishing microgrids ranging from 10 to 200 MW, throughout the state to secure reliability, reduce costs, and improve the efficiency of the surrounding grid.
To speak to our analyst for a discussion on the above findings, click Speak to Analyst
Table of Contents
1 Introduction (Page No. - 14)
1.1 Objectives of the Study
1.2 Market Definition
1.3 Study Scope
1.3.1 Markets Covered
1.3.2 Years Considered for the Study
1.4 Currency
1.5 Limitations
1.6 Stakeholders
2 Research Methodology (Page No. - 18)
2.1 Research Data
2.1.1 Secondary Data
2.1.1.1 List of Major Secondary Sources
2.1.1.2 Key Data From Secondary Sources
2.1.2 Primary Data
2.1.2.1 Primary Interviews With Experts
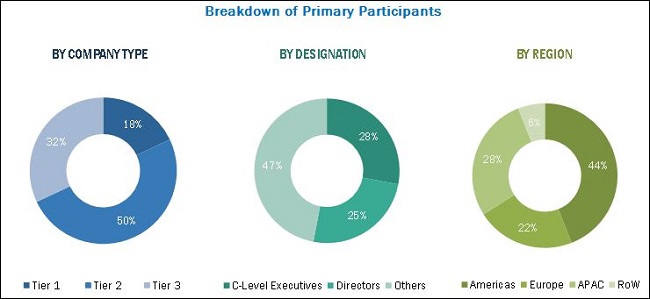
2.1.2.2 Breakdown of Primaries
2.1.2.3 Key Data From Primary Sources
2.1.2.4 Key Industry Insights
2.2 Market Size Estimation
2.3 Market Breakdown & Data Triangulation
2.4 Research Assumptions
3 Executive Summary (Page No. - 27)
4 Premium Insights (Page No. - 33)
4.1 Attractive Opportunities for the Global Microgrid as a Service Market
4.2 Market, By Grid Type
4.3 Market, By Vertical
4.4 Market, By Service Type
4.5 Market, By Geography
4.6 Life Cycle Analysis, By Region
5 Market Overview (Page No. - 37)
5.1 Introduction
5.2 Market Segmentation
5.2.1 By Grid Type
5.2.2 By Service Type
5.2.3 By Vertical
5.2.4 By Geography
5.3 Market Dynamics
5.3.1 Drivers
5.3.1.1 Reduction in Operational Costs and Requirement of Negligible Upfront Investments By MaaS Users
5.3.1.2 Rising Demand for Msaas From Hospitals, Defense, and Remote Areas
5.3.1.3 Availability of Flexi-Pay Options Boosts the Adoption of MaaS Among Low-Income Residential End Users
5.3.1.4 High Investments By Governments in Microgrid Infrastructure
5.3.1.5 Levelized Cost of Electricity (LCoE) for Wind and Solar Pv Systems in the Last Few Years
5.3.2 Restraints
5.3.2.1 Dominance of Customer-Owned Microgrids
5.3.2.2 Policy, Regulations, and Standards
5.3.3 Opportunities
5.3.3.1 Increasing Use of Behind-The-Meter Microgrid Virtual Batteries for Energy Storage
5.3.3.2 Rural Electrification in APAC and Africa
5.3.4 Challenges
5.3.4.1 Lack of Awareness and Training Programs for End-Users
5.3.4.2 Complexities in Planning and Design of Large-Sized Microgrids
6 Industry Trends (Page No. - 46)
6.1 Value Chain Analysis
6.2 Porter�s Five Forces Analysis, 2016
6.2.1 Bargaining Power of Suppliers
6.2.2 Bargaining Power of Buyers
6.2.3 Threat of New Entrants
6.2.4 Threat of Substitutes
6.2.5 Intensity of Competitive Rivalry
7 Market, By Grid Type (Page No. - 54)
7.1 Introduction
7.2 Grid-Connected Type
7.3 Remote/Islanded Type
8 Market, By Vertical (Page No. - 61)
8.1 Introduction
8.2 Government & Education
8.3 Residential & Commercial
8.4 Industrial
8.5 Military
8.6 Utility
9 Market, By Service Type (Page No. - 74)
9.1 Introduction
9.2 Engineering & Design Service
9.3 Software as a Service
9.4 Monitoring & Control Service
9.5 Operation & Maintenance Service
10 Market, By Geography (Page No. - 85)
10.1 Introduction
10.2 Americas
10.2.1 North America
10.2.1.1 U.S.
10.2.1.2 Rest of North America
10.2.2 Latin America
10.2.3 Brazil
10.2.4 Rest of Latin America
10.3 Europe
10.3.1 Western Europe
10.3.1.1 Germany
10.3.1.2 France
10.3.1.3 U.K.
10.3.1.4 Rest of Western Europe
10.3.2 Eastern Europe
10.3.2.1 Russia
10.3.2.2 Rest of Eastern Europe
10.3.3 Rest of Europe
10.4 Asia-Pacific
10.4.1 China
10.4.2 India
10.4.3 Australia
10.4.4 Rest of APAC
10.5 Rest of the World
10.5.1 Middle East
10.5.2 Africa
11 Competitive Landscape (Page No. - 114)
11.1 Introduction
11.2 Ranking of Market Players, 2015
11.3 Competitive Situation and Trends
11.3.1 Partnerships/Collaborations/Agreements
11.3.2 New Product Launches
11.3.3 Expansions
12 Company Profiles (Page No. - 120)
(Company at A Glance, Recent Financials, Products & Services, Strategies & Insights, & Recent Developments)*
12.1 Introduction
12.2 ABB Ltd.
12.3 General Electric
12.4 Siemens AG
12.5 Eaton Corporation PLC
12.6 Exelon Corporation
12.7 NRG Energy, Inc.
12.8 Pareto Energy
12.9 Spirae, Inc.
12.10 Anbaric Transmission, LLC
12.11 Solarcity Corporation
12.12 Green Energy Corp.
*Details on Company at A Glance, Recent Financials, Products & Services, Strategies & Insights, & Recent Developments Might Not Be Captured in Case of Unlisted Companies.
13 Appendix (Page No. - 143)
13.1 Insights of Industry Experts
13.2 Discussion Guide
13.3 Knowledge Store: Marketsandmarkets� Subscription Portal
13.4 Introducing RT: Real-Time Market Intelligence
13.5 Available Customizations
13.6 Related Reports
13.7 Author Details
List of Tables (76 Tables)
Table 1 Microgrid as a Service Market Segmentation, By Grid Type
Table 2 Market Segmentation, By Service Type
Table 3 Market Segmentation, By Vertical Type
Table 4 Functions & Stakeholders in MaaS Value Chain
Table 5 Market: Porter�s Five Forces Analysis
Table 6 Market, By Grid Type, 2013�2022 (USD Million)
Table 7 Market for Grid-Connected Microgrids, By Region, 2013�2022 (USD Million)
Table 8 Market in Americas for Grid-Connected Microgrids, By Region, 2013�2022 (USD Million)
Table 9 Market for Grid-Connected Microgrids, By Vertical, 2013�2022 (USD Million)
Table 10 Market for Remote/Islavded Microgrids, By Region, 2013�2022 (USD Million)
Table 11 Market in Americas for Remote/Islanded Microgrids, By Region, 2013�2022 (USD Million)
Table 12 Market for Remote/Islanded Microgrids, By Vertical, 2013�2022 (USD Million)
Table 13 Market, By Vertical, 2013�2022 (USD Million)
Table 14 Market for Government & Education Vertical, By Region, 2013�2022 (USD Million)
Table 15 Market in Americas for Government & Education Vertical, By Region, 2013�2022 (USD Million)
Table 16 Market for Government & Education Vertical, By Grid Type, 2013�2022 (USD Million)
Table 17 Market for Residential & Commercial Vertical, By Region, 2013�2022 (USD Million)
Table 18 Market in Americas for Residential & Commercial Vertical, By Region, 2013�2022 (USD Million)
Table 19 Marketfor Residential & Commercial Vertical, By Grid Type, 2013�2022 (USD Million)
Table 20 Market for Industrial Vertical, By Region, 2013�2022 (USD Million)
Table 21 Market in Americas for Industrial Vertical, By Region, 2013�2022 (USD Million)
Table 22 Market for Industrial Vertical, By Grid Type, 2013�2022 (USD Million)
Table 23 Market for Military Vertical, By Region, 2013�2022 (USD Million)
Table 24 Market in Americas for Military Vertical, By Region, 2013�2022 (USD Million)
Table 25 Market for Military Vertical, By Grid Type, 2013�2022 (USD Million)
Table 26 Market for Utility Vertical, By Region, 2013�2022 (USD Million)
Table 27 Market in Americas for Utility Vertical, By Region, 2013�2022 (USD Million)
Table 28 Market for Utility Vertical, By Grid Type, 2013�2022 (USD Million)
Table 29 Market, By Service Type, 2013�2022 (USD Million)
Table 30 Market for Engineering & Design Service Segment, By Region, 2013�2022 (USD Million)
Table 31 Market in Americas for Engineering & Design Service Segment, By Region, 2013�2022 (USD Million)
Table 32 Market in Europe for Engineering & Design Service Segment, By Region, 2013�2022 (USD Million)
Table 33 Market for Software as a Service Segment, By Region, 2013�2022 (USD Million)
Table 34 Market in Americas for Software as a Service Segment, By Region, 2013�2022 (USD Million)
Table 35 Market in Europe for Software as a Service Segment, By Region, 2013�2022 (USD Million)
Table 36 Microgrid as a Service (MaaS) Market for Monitoring & Control Service Segment, By Region, 2013�2022 (USD Million)
Table 37 Market in Americas for Monitoring & Control Service Segment, By Region, 2013�2022 (USD Million)
Table 38 Market in Europe for Monitoring & Control Service Segment, By Region, 2013�2022 (USD Million)
Table 39 Market for Operation & Maintenance Service Segment, By Region, 2013�2022 (USD Million)
Table 40 Market in Americas for Operation & Maintenance Service Segment, By Region, 2013�2022 (USD Million)
Table 41 Microgrid as a Service (MaaS) Market in Europe for Operation & Maintenance Service Segment, By Region, 2013�2022 (USD Million)
Table 42 Market, By Region, 2013�2022 (USD Million)
Table 43 Market in Americas, By Region, 2013�2022 (USD Million)
Table 44 Market in Americas, By Grid Type, 2013�2022 (USD Million)
Table 45 Grid-Connected Microgrid as a Service Market in Americas, By Region, 2013�2022 (USD Million)
Table 46 Remote/Islanded-Microgrid as a Service Market in Americas, By Region, 2013�2022 (USD Million)
Table 47 Market in Americas, By Vertical, 2013�2022 (USD Million)
Table 48 Market in Americas, By Service Type, 2013�2022 (USD Million)
Table 49 Market in North America, By Vertical, 2013�2022 (USD Million)
Table 50 Market in North America, By Service Type, 2013�2022 (USD Million)
Table 51 Market in North America, By Country, 2013�2022 (USD Million)
Table 52 Market in Latin America, By Vertical, 2013�2022 (USD Million)
Table 53 Market in Latin America, By Service Type, 2013�2022 (USD Million)
Table 54 Market in Latin America, By Country, 2013�2022 (USD Million)
Table 55 Market in Europe, By Region, 2013�2022 (USD Million)
Table 56 Market in Europe, By Grid Type, 2013�2022 (USD Million)
Table 57 Market in Europe, By Vertical, 2013�2022 (USD Million)
Table 58 Market in Europe, By Service Type, 2013�2022 (USD Million)
Table 59 Market in Western Europe, By Country, 2013�2022 (USD Million)
Table 60 Market in Western Europe, By Vertical, 2013�2022 (USD Million)
Table 61 Market in Eastern Europe, By Country, 2013�2022 (USD Million)
Table 62 Market in Eastern Europe, By Vertical, 2013�2022 (USD Million)
Table 63 Market in Rest of Europe, By Vertical, 2013�2022 (USD Million)
Table 64 Market in APAC, By Grid Type, 2013�2022 (USD Million)
Table 65 Market in APAC, By Vertical, 2013�2022 (USD Million)
Table 66 Market in APAC, By Service Type, 2013�2022 (USD Million)
Table 67 Market in APAC, By Country, 2013�2022 (USD Million)
Table 68 Market in RoW, By Region, 2013�2022 (USD Million)
Table 69 Market in RoW, By Grid Type, 2013�2022 (USD Million)
Table 70 Market in RoW, By Vertical, 2013�2022 (USD Million)
Table 71 Market in RoW, By Service Type, 2013�2022 (USD Million)
Table 72 Ranking in the MaaS Market, 2015
Table 73 Partnerships/Collaborations/Agreements, 2013�2016
Table 74 New Product Development in the MaaS Market, 2013�2016
Table 75 Expansions in the MaaS Market, 2013�2016
Table 76 Mergers & Acquisitions in the MaaS Market, 2013�2016
List of Figures (68 Figures)
Figure 1 Segmentation of the Microgrid as a Service Market
Figure 2 Market: Research Design
Figure 3 Market Size Estimation Methodology: Bottom-Up Approach
Figure 4 Market Size Estimation Methodology: Top-Down Approach
Figure 5 Data Triangulation
Figure 6 Reduction in Operational Costs and Negligible Upfront Investments Expected to Propel the Market Growth Between 2016 and 2022
Figure 7 Market for Remote/Islanded Microgrids Likely to Grow at A Higher Rate During the Forecast Period
Figure 8 Market for Software as a Service Segment Expected to Grow at the Highest Rate During the Forecast Period
Figure 9 Market for Industrial Vertical Expected to Grow at the Highest Rate During the Forecast Period
Figure 10 Americas Would Account for the Largest Market Share in 2016
Figure 11 Increasing Opportunities in Residential & Commercial Vertical Expected to Drive the Global Market During the Forecast Period
Figure 12 Market for Remote/Islandedmicrogrids to Grow at A Higher Rate During the Forecast Period
Figure 13 Residential & Commercial Vertical to Hold the Largest Size of the Global Market During the Forecast Period
Figure 14 Software as a Service Type Expected to Lead the Market During the Forecast Period
Figure 15 Americas to Lead the Market During the Forecast Period
Figure 16 China to Hold the Largest Share of the Market in APAC in 2016
Figure 17 Market in APAC to Be in Its Growth Phase During the Forecast Period
Figure 18 Market, By Geography
Figure 19 Market Dynamics
Figure 20 Microgrids Installed Over the Years By ABB Ltd.
Figure 21 Levelized Cost of Electricity (LCoE) for Wind & Solar Pv Systems (2009 � 2014)
Figure 22 Microgrid as a Service (MaaS) Market: Value Chain Analysis
Figure 23 Porter�s Five Forces Analysis for the Market, 2016
Figure 24 Market: Porter�s Five Forces Analysis
Figure 25 Medium Impact of the Bargaining Power of Suppliers on the MaaS Market, 2016
Figure 26 Medium Impact of the Bargaining Power of Buyers on the MaaS Market, 2016
Figure 27 Low Impact of the Threat of New Entrants on the MaaS Market, 2016
Figure 28 Medium Impact of the Threat of Substitutes on the MaaS Market, 2016
Figure 29 High Impact of the Intensity of Competitive Rivalry on the MaaS Market, 2016
Figure 30 Market, By Grid Type
Figure 31 Asia-Pacific Expected to Exhibit the Highest Growth for Grid-Connected Microgrids During the Forecast Period
Figure 32 Market for Remote/Islanded Microgrids in Latin America Expected to Grow at the Highest Rate During the Forecast Period
Figure 33 Market for Remote/Islanded Microgrids Expected to Grow at the Highest Rate Between During the Forecast Period
Figure 34 Market Segmentation: By Vertical
Figure 35 Market for Industrial Vertical Expected to Grow at the Highest Rate During the Forecast Period
Figure 36 Market in Asia-Pacific for Government & Education Vertical to Grow at the Highest Rate During the Forecast Period
Figure 37 Market for Remote/Islanded Microgrids for Residential & Commercial Vertical to Grow at the Highest Rate During the Forecast Period
Figure 38 Americas Expected to Hold the Largest Market Size Microgrid as a Service for Military Vertical By 2022
Figure 39 Market, By Service Type
Figure 40 Market for Software as a Service Segment Expected to Grow at the Highest Rate During the Forecast Period
Figure 41 Market for Software as a Service Segment in Western Europe Expected to Hold the Largest Market Size During the Forecast Period
Figure 42 Market in Asia-Pacific for Operation & Maintenance Service Segment Expected to Grow at the Highest Rate During the Forecast Period
Figure 43 Microgrid as a Service Market in Asia-Pacific is Expected to Grow at the Highestrate Microgrid as a Service during the Forecast Period
Figure 44 Market in India Estimated to Grow at the Highest Rate Between 2016 and 2022
Figure 45 Market: By Region
Figure 46 Segmentation: Americas
Figure 47 Snapshot of Market in Americas: Increasing Demand for Reliable and Secure Power Supply is Driving the Market
Figure 48 Segmentation: Europe
Figure 49 Market in Eastern Europe Expected to Grow at the Highest Rate During the Forecast Period
Figure 50 Segmentation: APAC
Figure 51 Snapshot of Market in APAC : Rural Electrification is the Main Factor Driving the Demand for Microgrids in This Region
Figure 52 Segmentation: Rest of the World
Figure 53 Middle East Expected to Hold the Largest Size of the Market in RoW During the Forecast Period
Figure 54 Key Growth Strategies Adopted By the Top Companies, 2013�2016
Figure 55 Market Evaluation Framework: Partnerships/Collaborations/Agreements Fuelled Growth and Innovation Between 2014 and 2016
Figure 56 Battle for Market Share: Partnerships/Collaborations/Agreements Were the Key Strategies
Figure 57 Geographic Revenue Mix of the Major Players in the Market, 2015
Figure 58 ABB Ltd.: Company Snapshot
Figure 59 ABB Ltd.: SWOT Analysis
Figure 60 General Electric: Company Snapshot
Figure 61 General Electric: SWOT Analysis
Figure 62 Siemens AG: Company Snapshot
Figure 63 Siemens AG: SWOT Analysis
Figure 64 Eaton Corporation PLC: Company Snapshot
Figure 65 Eaton Corporation PLC: SWOT Analysis
Figure 66 Exelon Corporation: SWOT Analysis
Figure 67 NRG Energy, Inc.: Company Snapshot
Figure 68 Solarcity Corporation: Company Snapshot


Growth opportunities and latent adjacency in Microgrid as a Service (MaaS) Market