Microspheres Market by Type (Hollow, Solid), Raw Material (Glass, Ceramic, Fly Ash, Polymer, Metallic), Application (Construction Composites, Medical Technology, Cosmetics & Personal Care, Automotive, Oil & Gas) - Global Forecast to 2022


The microspheres market is projected to reach USD 6.68 Billion by 2022, at a CAGR of 9.02%. In this report, 2016 is considered as the base year and the forecast period is 2017 to 2022.
The Objectives of Microspheres Market Study are:
- To analyze and forecast the market size of microspheres in terms of value
- To define, describe, and segment the global microspheres market by type, raw material, and application
- To forecast the size of the market segments based on regions such as Asia-Pacific, Western Europe, Central & Eastern Europe, North America, Middle East & Africa, and Latin America
- To provide detailed information regarding the important factors influencing the growth of the market (drivers, restraints, and opportunities)
- To strategically analyze the segmented markets with respect to individual growth trends, prospects, and contribution to the overall market
- To identify and analyze opportunities for stakeholders in the market
- To analyze competitive developments such as expansions, alliances, joint ventures, mergers & acquisitions, and new product developments in the global microspheres market
- To strategically profile key players and comprehensively analyze their core competencies*
Note: *Core competencies of the companies are captured in terms of their key developments, SWOT analysis, and key strategies adopted by them to sustain their position in the market.
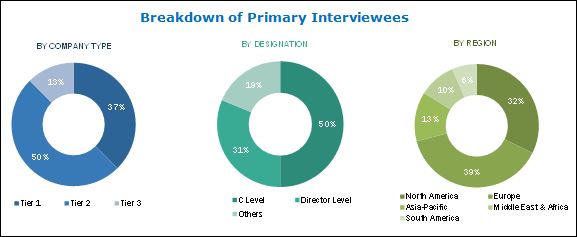
This research study involves extensive use of secondary sources, directories, and databases (such as Hoovers, Bloomberg BusinessWeek, and Factiva) to identify and collect information useful for this technical, market-oriented, and commercial study of the microspheres market. The primary sources mainly include several industry experts from core and related industries and preferred suppliers, manufacturers, distributors, service providers, and organizations related to all segments of the industry’s supply chain. After arriving at the overall market size, the total market has been split into several segments and subsegments. The figure below illustrates the breakdown of the primary interviews based on company type, designation, and region conducted during the research study.

The value chain of microspheres market starts with bulk chemical and material suppliers. It includes many small and big chemical and material companies who provide raw materials such as glass, ceramic, polymer, and other chemicals involved in the manufacture of microspheres. These raw materials are made available to microspheres manufacturers either by supplying or through vertical integration. Microspheres are obtained through a series of processes. According to industry experts, raw material cost contributes significant value addition to the overall price of microspheres. Major value is added during the manufacturing process, where a great amount of effort and expertise, mainly in terms of balancing the ingredients is required to manufacture microspheres suitable for different applications. These microspheres are then either sold directly to end users or to distributors. The final products are used in applications such as construction industry, medical technology, life sciences & biotechnology, paints & coatings, cosmetics & personal care, oil & gas, automotive, aerospace, and other such industries.
Target Audience in Microspheres Market
- Microspheres Manufacturers
- Microspheres Dealers
- Microspheres Suppliers
- End Users
- Raw Material Suppliers and Others
Microspheres Market Report Scope
This report categorizes the global microspheres market based on type, application, and region.
Market Segmentation, By Type:
The microspheres market has been segmented based on type:
- Hollow
- Solid
Market Segmentation, By Raw Material:
The microspheres market has been segmented based on raw material:
- Glass
- Ceramic
- Fly Ash
- Polymer
- Metallic
- Others
Market Segmentation, By Application:
The microspheres market has been segmented based on application:
- Construction Composites
- Medical Technology
- Life Science & Biotechnology
- Paints & Coatings
- Cosmetics & Personal Care
- Oil & Gas
- Automotive
- Aerospace
- Others
Market Segmentation, By Region:
The regional analysis covers:
- North America
- Western Europe
- Central & Eastern Europe
- Asia-Pacific
- Middle East & Africa
- Latin America
Microspheres Market Report Available Customizations
With the given market data, MarketsandMarkets offers customizations according to the company’s specific needs. The following customization options are available for the report:
Microspheres Market Product Analysis
- Product Matrix that gives a detailed comparison of product portfolio of each company
Microspheres Market Regional Analysis
- Further breakdown of a region with respect to a particular country
Microspheres Market Company Information
- Detailed analysis and profiling of additional market players (up to five)
The global microspheres market size was USD 3.98 Billion in 2016 and is projected to reach USD 6.68 Billion by 2022, at a CAGR of 9.02% between 2017 and 2022. The superior structural properties of microspheres, development & modernization, and increasing demand from current and emerging applications are expected to drive the demand for microspheres globally.
The construction composites application segment dominated the microspheres market in 2016. The market for medical technology application is expected to witness the highest growth rate between 2017 and 2022 due to the growing number of implant surgeries in North America, Europe, and Asia-Pacific. The medical technology segment is expected to be the largest application of microspheres by 2022. The growing healthcare industry in the U.S., the Middle East, and Asia-Pacific countries such as China, Japan, and India is also driving this segment.
Based on type, the microsphere market is classified into hollow and solid. The market is dominated by the hollow microspheres segment due to their low crush strength, density, and absorption. The hollow microspheres segment is also projected to be the fastest-growing type segment of the microspheres market during the forecast period. The microspher market is classified based on raw material into glass, ceramic, fly ash, polymer, metallic, and others. The glass microspheres segment dominated the microspheres market in 2016, while the metallic microspheres segment is projected to witness the highest CAGR during the forecast period.
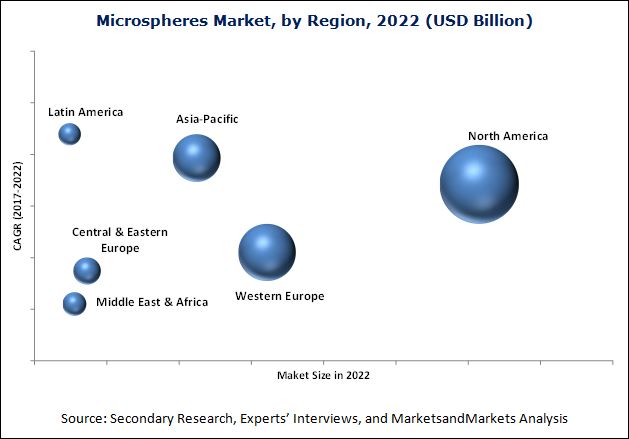
Currently, North America is the largest microspheres market, in terms of value, closely followed by Western Europe. Some of the factors driving the growth of the North American market are the high growth of end-use industries, amplified local manufacturing, and increased number of domestic players.
Asia-Pacific is expected to be the second-fastest growing microsphere market due to the high demand from medical technology and construction composites applications. The presence of major developing nations such as China, India, and South Korea is also a major driver for the microspheres market in the region.

Key Players in Microspheres Market
The major restraints for the market are fluctuating raw material prices, lack of quality control across developing countries, and huge investments required in R&D. Expansion is the most preferred strategy adopted by key market players to sustain in this highly competitive market. The major opportunity for microspheres manufacturers are emerging economies such as China, India, and Brazil. Some of the important manufacturers are 3M (U.S.), Potters Industries LLC (U.S.), AkzoNobel N.V. (Netherlands), Matsumoto Yushi-Seiyaku Company (Japan), Trelleborg AB (Sweden), Luminex Corporation (U.S.), Momentive Performance Materials Inc. (U.S.), Chase Corporation (U.S.), Sigmund Lindner GmbH (Germany), and Mo-Sci Corporation (U.S.). Companies in this market compete with each other with respect to prices and product offerings to meet the market requirements.
To speak to our analyst for a discussion on the above findings, click Speak to Analyst
Table of Contents
1 Introduction (Page No. - 14)
1.1 Objectives of the Study
1.2 Market Definition
1.3 Market Scope
1.3.1 Markets Covered
1.3.2 Years Considered for the Study
1.3.3 Currency
1.4 Limitations
1.5 Stakeholders
2 Research Methodology (Page No. - 17)
2.1 Research Data
2.1.1 Secondary Data
2.1.1.1 Key Data From Secondary Sources
2.1.2 Primary Data
2.1.2.1 Key Data From Primary Sources
2.1.2.2 Key Industry Insights
2.1.2.3 Breakdown of Primary Interviews
2.2 Market Size Estimation
2.2.1 Bottom-Up Approach
2.2.2 Top-Down Approach
2.3 Data Triangulation
2.4 Assumptions
3 Executive Summary (Page No. - 26)
4 Premium Insights (Page No. - 30)
4.1 Attractive Market Opportunities for Microspheres Manufacturers
4.2 Global Microspheres Market, By Region
4.3 Global Microsphere Market Share, By Type
4.4 Global Microspheres Market, By Raw Material
4.5 North American Microsphere Market, By Major Application and Country
4.6 Microspheres Market Attractiveness
5 Market Overview (Page No. - 34)
5.1 Introduction
5.2 Market Dynamics
5.2.1 Drivers
5.2.1.1 High Demand From Existing and Emerging Applications
5.2.1.2 Superior Structural Properties
5.2.1.3 Need for Reducing Environmental Footprint
5.2.1.4 Development and Modernization of Infrastructure
5.2.1.5 Increasing Demand for Energy Efficiency
5.2.2 Restraints
5.2.2.1 Increasing Raw Material Prices
5.2.2.2 Lack of Quality Control in Developing Countries
5.2.3 Opportunities
5.2.3.1 Emerging Economies in APAC
5.2.4 Short-, Medium-, and Long-Term Impact Analysis
5.3 Revenue Pocket Matrix
5.3.1 Revenue Pocket Matrix for Microspheres, By Raw Material
5.3.2 Revenue Pocket Matrix of Microspheres Application
5.4 Porter’s Five Forces Analysis
5.4.1 Threat of New Entrants
5.4.2 Bargaining Power of Suppliers
5.4.3 Threat of Substitutes
5.4.4 Bargaining Power of Buyers
5.4.5 Intensity of Competitive Rivalry
5.5 Industry Outlook
5.5.1 Automotive Industry
5.5.2 Construction Industry
5.5.2.1 Trends and Forecast of Construction Industry in North America
5.5.2.2 Trends and Forecast of Construction Industry in Europe
5.5.2.3 Trends and Forecast of Construction Industry in APAC
5.5.2.4 Trends and Forecast of Construction Industry in the Mea
5.5.2.5 Trends and Forecast of Construction Industry in South America
5.5.3 Oil & Gas Industry
6 Global Microspheres Market, By Type (Page No. - 51)
6.1 Introduction
6.2 Hollow Microspheres
6.3 Solid Microspheres
7 Global Microspheres Market, By Raw Material (Page No. - 55)
7.1 Introduction
7.2 Glass Microspheres
7.3 Ceramic Microspheres
7.4 Fly ASH Microspheres
7.5 Polymer Microspheres
7.6 Metallic Microspheres
8 Global Microsphere Market, By Application (Page No. - 60)
8.1 Introduction
8.2 Construction Composites
8.3 Medical Technology
8.4 Life Science & Biotechnology
8.5 Paints & Coatings
8.6 Cosmetics & Personal Care
8.7 Oil & Gas
8.8 Automotive
8.9 Aerospace
9 Regional Analysis (Page No. - 70)
9.1 Introduction
9.2 North America
9.2.1 U.S.
9.2.2 Canada
9.3 Western Europe
9.3.1 Germany
9.3.2 France
9.3.3 U.K.
9.3.4 Italy
9.3.5 Spain
9.3.6 Others
9.4 Central & Eastern Europe
9.4.1 Russia
9.4.2 Poland
9.4.3 Others
9.5 APAC
9.5.1 China
9.5.2 India
9.5.3 Japan
9.5.4 South Korea
9.5.5 Thailand
9.5.6 Others
9.6 MEA
9.6.1 The Middle-East
9.6.2 Africa
9.7 Latin America
9.7.1 Brazil
9.7.2 Argentina
10 Competitive Landscape (Page No. - 109)
10.1 Introduction
10.1.1 Dynamic
10.1.2 Innovators
10.1.3 Vanguards
10.1.4 Emerging
10.2 Competetive Benchmarking
10.2.1 Product Offerings
10.2.2 Business Strategy
10.3 Market Share Analysis 2016
11 Company Profiles (Page No. - 114)
(Business Overview, Product Offering Scorecard, Business Strategy Scorecard, Recent Developments)*
11.1 3M
11.2 Akzonobel N.V.
11.3 Matsumoto Yushi-Seiyaku Co. Ltd
11.4 Trelleborg AB
11.5 Luminex Corporation
11.6 Momentive Performance Materials Inc.
11.7 Chase Corporation
11.8 Potters Industries LLC
11.9 Sigmund Lindner GmbH
11.10 MO SCI Corporation
*Details on Business Overview, Product Offering Scorecard, Business Strategy Scorecard, Recent Developments Might Not Be Captured in Case of Unlisted Companies.
11.11 Other Key Market Players
11.11.1 Polysciences Inc. (U.S.)
11.11.2 Spherotech Inc. (U.S.)
11.11.3 Dennert Poraver GmbH (Germany)
11.11.4 Bangs Laboratories Inc. (U.S.)
11.11.5 Nanjing Jianzun Glass Microsphere Plant Co., Ltd.(China)
11.11.6 The Kish Compmay, Inc. (U.S.)
11.11.7 Asia Pacific Microspheres (Malaysia)
11.11.8 Advanced Polymers International (U.S.)
11.11.9 Durgesh Merchandise Pvt. Ltd. (India)
11.11.10 Cospheric LLC (U.S.)
11.11.11 Petra India Group (India)
11.11.12 Ceno Technologies (U.S.)
11.11.13 Omya AG (Switzerland)
11.11.14 Qingdao Eastchem Inc. (China)
11.11.15 Reslab Microfiller (Australia)
12 Appendix (Page No. - 135)
12.1 Insights From Industry Experts
12.2 Discussion Guide
12.3 Knowledge Store: Marketsandmarkets’ Subscription Portal
12.4 Introducing RT: Real Time Market Intelligence
12.5 Available Customizations
12.6 Related Reports
12.7 Author Details
List of Tables (77 Tables)
Table 1 Microspheres: Properties and Advantages
Table 2 Top 10 Largest Economies, By GDP, in Terms of Ppp, 2010 and 2020
Table 3 Total GDP of 10 Largest Global Economies in Terms of Ppp, 2020 (Global Share)
Table 4 Vehicles Production, By Country, 2011–2015 (Thousand Units)
Table 5 Global Microspheres Market Size, By Type, 2015–2022 (USD Million)
Table 6 Hollow Microsphere Market Size, By Region, 2015–2022 (USD Million)
Table 7 Solid Microspheres Market Size, By Region, 2015–2022 (USD Million)
Table 8 Global Microsphere Market Size, By Raw Material, 2015–2022 (USD Million)
Table 9 Glass Microspheres Market Size, By Region, 2015–2022 (USD Million)
Table 10 Ceramic Microsphere Market Size, By Region, 2015–2022 (USD Million)
Table 11 Fly ASH Microspheres Market Size, By Region, 2015–2022 (USD Million)
Table 12 Polymer Microsphere Market Size, By Region, 2015–2022 (USD Million)
Table 13 Metallic Microspheres Market Size, By Region, 2015–2022 (USD Million)
Table 14 Industry-Wise Applications of Microspheres
Table 15 Global Microspheres Market Size, By Application, 2015–2022 (USD Million)
Table 16 Microsphere Market Size in Construction Composites, By Region, 2015–2022 (USD Million)
Table 17 Microspheres Market Size in Medical Technology, By Region, 2015–2022 (USD Million)
Table 18 Microsphere Market Size in Life Science & Biotechnology, By Region, 2015–2022 (USD Million)
Table 19 Microspheres Market Size in Paints & Coatings, By Region, 2015–2022 (USD Million)
Table 20 Microsphere Market Size in Cosmetics & Personal Care, By Region, 2015–2022 (USD Million)
Table 21 Microspheres Market Size in Oil & Gas, By Region, 2015–2022 (USD Million)
Table 22 Microsphere Market Size in Automotive, By Region, 2015–2022 (USD Million)
Table 23 Microspheres Market Size in Aerospace, By Region, 2015–2022 (USD Million)
Table 24 Global Microsphere Market Size, By Region, 2015–2022 (USD Million)
Table 25 North America: Microspheres Market Size, By Country, 2015–2022 (USD Million)
Table 26 North America: Market Size, By Application, 2015–2022 (USD Million)
Table 27 North America: Market Size, By Type, 2015–2022 (USD Million)
Table 28 North America: Market Size, By Raw Material, 2015–2022 (USD Million)
Table 29 U.S.: Microspheres Market Size, By Application, 2015–2022 (USD Million)
Table 30 U.S.: Market Size, By Type, 2015–2022 (USD Million)
Table 31 U.S.: Market Size, By Raw Material, 2015–2022 (USD Million)
Table 32 Canada: Microsphere Market Size, By Application, 2015–2022 (USD Million)
Table 33 Canada: Market Size, By Type, 2015–2022 (USD Million)
Table 34 Canada: Market Size, By Raw Material, 2015–2022 (USD Million)
Table 35 Western Europe: Microspheres Market Size, By Country, 2015–2022 (USD Million)
Table 36 Western Europe: Market Size, By Application, 2015–2022 (USD Million)
Table 37 Western Europe: Market Size, By Type, 2015–2022 (USD Million)
Table 38 Western Europe: Market Size, By Raw Material, 2015–2022 (USD Million)
Table 39 Germany: Microsphere Market Size, By Application, 2015–2022 (USD Million)
Table 40 Germany: Market Size, By Type, 2015–2022 (USD Million)
Table 41 Germany: Market Size, By Raw Material, 2015–2022 (USD Million)
Table 42 France: Microspheres Market Size, By Application, 2015–2022 (USD Million)
Table 43 U.K.: Microsphere Market Size, By Application, 2015–2022 (USD Million)
Table 44 Italy: Microspheres Market Size, By Application, 2015–2022 (USD Million)
Table 45 Spain: Microsphere Market Size, By Application, 2015–2022 (USD Million)
Table 46 Others: Microspheres Market Size, By Application, 2015–2022 (USD Million)
Table 47 Central & Eastern Europe: Microspheres Market Size, By Country, 2015–2022 (USD Million)
Table 48 Central & Eastern Europe: Market Size, By Application, 2015–2022 (USD Million)
Table 49 Central & Eastern Europe: Market Size, By Type, 2015–2022 (USD Million)
Table 50 Central & Eastern Europe: Market Size, By Raw Material, 2015–2022 (USD Million)
Table 51 Russia: Microspheres Market Size, By Application, 2015–2022 (USD Million)
Table 52 Poland: Microsphere Market Size, By Application, 2015–2022 (USD Million)
Table 53 Others: Microspheres Market Size, By Application, 2015–2022 (USD Million)
Table 54 APAC: Microsphere Market Size, By Country, 2015–2022 (USD Million)
Table 55 APAC: Market Size, By Application, 2015–2022 (USD Million)
Table 56 APAC: Market Size, By Type, 2015–2022 (USD Million)
Table 57 APAC: Market Size, By Raw Material, 2015–2022 (USD Million)
Table 58 China: Microspheres Market Size, By Application, 2015–2022 (USD Million)
Table 59 China: Market Size, By Type, 2015–2022 (USD Million)
Table 60 China: Market Size, By Raw Material, 2015–2022 (USD Million)
Table 61 India: Microspheres Market Size, By Application, 2015–2022 (USD Million)
Table 62 Japan: Microsphere Market Size, By Application, 2015–2022 (USD Million)
Table 63 South Korea: Microspheres Market Size, By Application, 2015–2022 (USD Million)
Table 64 Thailand: Microsphere Market Size, By Application, 2015–2022 (USD Million)
Table 65 Others: Microspheres Market Size, By Application, 2015–2022 (USD Million)
Table 66 MEA: Microsphere Market Size, By Region, 2015–2022 (USD Million)
Table 67 MEA: Market Size, By Application, 2015–2022 (USD Million)
Table 68 MEA: Market Size, By Type, 2015–2022 (USD Million)
Table 69 MEA: Market Size, By Raw Material, 2015–2022 (USD Million)
Table 70 The Middle-East: Microspheres Market Size, By Application, 2015–2022 (USD Million)
Table 71 Africa: Microsphere Market Size, By Application, 2015–2022 (USD Million)
Table 72 Latin America: Microspheres Market Size, By Country, 2015–2022 (USD Million)
Table 73 Latin America: Market Size, By Application, 2015–2022 (USD Million)
Table 74 Latin America: Market Size, By Type, 2015–2022 (USD Million)
Table 75 Latin America: Market Size, By Raw Material, 2015–2022 (USD Million)
Table 76 Brazil: Microsphere Market Size, By Application, 2015–2022 (USD Million)
Table 77 Argentina: Microspheres Market Size, By Application, 2015–2022 (USD Million)
List of Figures (59 Figures)
Figure 1 Global Microspheres Market Segmentation
Figure 2 Global Microsphere Market: Research Design
Figure 3 Market Size Estimation: Bottom-Up Approach
Figure 4 Market Size Estimation: Top-Down Approach
Figure 5 Microspheres Market: Data Triangulation
Figure 6 Hollow Segment Leads Global Microsphere Market, By Type, 2017-2022 (USD Million)
Figure 7 Construction Composites to Be the Largest Application Segment, 2017-2022
Figure 8 Glass Segment Leads Global Microspheres Market, By Raw Material
Figure 9 North America to Be the Largest Market Between 2017 and 2022
Figure 10 Attractive Opportunities in Global Microsphere Market
Figure 11 North America to Be the Largest Market, 2017-2022 (USD Million)
Figure 12 Hollow Segment Dominated the Market in 2016
Figure 13 Glass Segment to Lead the Market, 2017-2022 (USD Million)
Figure 14 U.S. is the Largest Market for Microspheres in North America
Figure 15 APAC to Witness High Demand for Microspheres Between 2017 and 2022
Figure 16 Overview of the Forces Governing the Microspheres Market
Figure 17 Overview of Factors Governing Microsphere Market
Figure 18 Revenue Pocket Matrix: Raw Material
Figure 19 Revenue Pocket Matrix: Application
Figure 20 Porter’s Five Forces Analysis
Figure 21 APAC Recorded Highest Number of Vehicles Produced in 2015
Figure 22 U.S. Dominates North American Construction Industy, 2017-2022 (USD Billion)
Figure 23 U.K. to Lead European Construction Industry, 2017-2022 (USD Billion)
Figure 24 China to Lead APAC Construction Industry, 2017-2022 (USD Billion)
Figure 25 Saudi Arabia to Lead MEA Construction Industry, 2017-2022 (USD Billion)
Figure 26 Brazil to Lead South American Construction Industry, 2017-2022 (USD Billion)
Figure 27 Hollow Segment to Lead Global Microspheres Market, 2017-2022 (USD Million)
Figure 28 North America to Lead Hollow Microsphere Market, 2017-2022 (USD Million)
Figure 29 North America to Lead Solid Microspheres Market, 2017-2022 (USD Million)
Figure 30 Glass Segment to Lead Global Microsphere Market, 2017-2022 (USD Million)
Figure 31 Medical Technology to Be the Largest Application Segment of Microspheres By 2022 (USD Million)
Figure 32 North America to Lead Global Microspheres Market, 2017-2022 (USD Million)
Figure 33 Global Microspheres Market Snapshot: Key Countries
Figure 34 North America Microsphere Market Snapshot: U.S. is the Largest Market
Figure 35 U.S. to Lead North American Microspheres Market, 2017-2022 (USD Million)
Figure 36 Glass Segment to Lead North American Microsphere Market, By Raw Material, 2017-2022 (USD Million)
Figure 37 Construction Composites Segment to Lead U.S. Microspheres Market, By Application, 2017-2022 (USD Million)
Figure 38 Germany to Lead Western European Microsphere Market, 2017-2022 (USD Million)
Figure 39 Medical Technology Segment to Lead German Microspheres Market By 2022 (USD Million)
Figure 40 Medical Technology Was the Second-Largest Application Segment of Microspheres in 2016
Figure 41 Medical Technology Segment to Lead Spanish Microsphere Market, By Application, 2017-2022 (USD Million)
Figure 42 Medical Technology Segment to Record Highest CAGR in Russian Microspheres Market, 2017-2022 (USD Million)
Figure 43 APAC Microspheres Market Snapshot: China is the Largest Market
Figure 44 China to Lead APAC Microsphere Market, 2017-2022 (USD Million)
Figure 45 Medical Technology Segment to Lead Chinese Microspheres Market, By 2022 (USD Million)
Figure 46 Medical Technology Segment to Record Highest CAGR in Indian Microsphere Market, 2017-2022 (USD Million)
Figure 47 Middle-East to Lead MEA Microspheres Market, 2017-2022 (USD Million)
Figure 48 Construction Composites Was the Biggest Application Segment of African Microsphere Market in 2016 (USD Million)
Figure 49 Brazil to Lead Latin American Microspheres Market, 2017-2022 (USD Million)
Figure 50 Glass Segment to Lead Latin American Microsphere Market, By Raw Material, 2017-2022 (USD Million)
Figure 51 Medical Technology Segment to Record Highest CAGR in Brazilian Microspheres Market, 2017-2022 (USD Million)
Figure 52 Dive Chart
Figure 53 3M: Company Snapshot
Figure 54 Akzonobel N.V.: Company Snapshot
Figure 55 Matsumoto Yushi-Seiyaku Co. Ltd.: Company Snapshot
Figure 56 Trelleborg AB: Company Snapshot
Figure 57 Luminex Corporation: Company Snapshot
Figure 58 Momentive Performance Materials Inc.: Company Snapshot
Figure 59 Chase Corporation: Company Snapshot


Growth opportunities and latent adjacency in Microspheres Market
Looking for colloid chemistry, nanoparticles, terahertz time domain spectroscopy, ceramic materials, clays and clay minerals
Market information (by application, by company marketshare) for "hollow glass microspheres" (for example, 3Ms glass bubble).
Marke data for european cenosphere market
Information on Microspheres and macro/midi-spheres (up to 3mm in diameter)for making syntactic epoxy / polyurethane systems - composites applications.
Microspheres market
General information on Microspheres industry
Requirement for list of polymer microspheres producer companies for oil and gas industries applications
Require sample copy of Microsphere Market
Detailed value chain of microspheres and trends in the market
Microspherse market
Information on microspheres used in oil & gas and market size conformation