Mineral Wool Market by Application (Building & Construction, Industrial & Appliances, Transportation, and Others) & Regional Analysis (North America, Europe, Asia-Pacific and Row) - Trends & Forecasts To 2019


The mineral wool market is projected to register a CAGR of 7.0% (between 2014 & 2019) with market size estimated at $12.0 billion by 2019. Asia-Pacific region, with its reviving economy and rapidly expanding building & construction sector and growing number of industries base is projected to experience the highest growth in demand between 2014 and 2019, followed by the Rest of the World (RoW) region.
The major factors driving the market growth are the increasing demand for the mineral wool based insulation products for thermal and acoustic insulation in the residential and commercial buildings and demand for heat insulation for the industrial applications to avoid heat loss and save energy.
The market has been analyzed in terms of both volume (KT) and value ($Million) by region; North America, Europe, Asia-Pacific, and Rest of the World (RoW) and by type Glass Wool and Stone Wool. Mineral wool market is also analyzed by end products; Blanket, Board, Panel, customized shape & others and for applications, Fire protection, Thermal insulation, Acoustic insulation, and other applications.
For this report, various secondary sources, such as, directories, technical handbooks, company annual reports, industry association publications, chemical magazine articles, world economic outlook, trade websites, and databases have been referred to identify and collect information useful for this extensive commercial study of the mineral wool market. The primary sources experts from related industries and suppliers have been interviewed to obtain and verify critical information as well as to assess future prospects and market estimations.
This report analyzes various marketing trends and establishes the most effective growth strategy in the market. It identifies market dynamics such as drivers, restraints, opportunities, burning issues, and winning imperatives.
Major companies; such as Saint-Gobain (France), Rockwool International (Denmark), Knauf Insulation (Netherlands), Industrial Insulation Group, LLC. (U.S.), CertainTeed Corp. (U.S.), Guardian Fiberglass, Inc. (U.S.), Johns Manville (U.S.), Owens Corning (U.S.), Roxul Inc. (Canada), Rock Wool Manufacturing Co. (U.S.), Thermafiber, Inc. (U.S.) and USG Interiors, Inc. (U.S.) have also been profiled in this report.
Get online access to the report on the World's First Market Intelligence Cloud
Request Sample Scope of the Report

On the basis of type
- Glass Wool and
- Stone Wool
On the basis of end products
- Blanket
- Board
- Panel
- Customised shapes & Others
On the basis of applications
- Fire protection
- Thermal Insulation
- Acoustic Insulation, and others
On the basis of region
- North America
- U.S.
- Canada
- Europe
- Germany
- France
- U.K.
- Italy
- Asia-Pacific
- China
- South Korea
- Japan
- India
- Rest of the World (RoW)
The mineral wool market size, by value, is projected to register a CAGR of 7.0% in the next five years to reach $12.0 billion by 2019. Mineral wool has gained acceptance due to its favorable properties, such as its ability to provide both thermal and acoustic insulation in the residential as well as commercial buildings and also in the industrial applications also. Thus, these fibers effectively address the heat and acoustic insulation requirements in various applications. The report covers the market and its trends in North America, Europe, Asia-Pacific, and Rest of the World (RoW).
The mineral wool market is analyzed with respect to types, end products and applications. The mineral wool is classified into two major types, Glass Wool and Stone Wool. Mineral wool end products include Blanket, Board, Panel, customized shape, and others. End-use applications included are Fire protection, Thermal, Acoustics, and Others. Building & construction industry is the major consumer of mineral wool, a trend which is anticipated to continue in future.
Asia-Pacific is the largest market for mineral wool, with the presence of emerging economies such as China and India, and growing activities in the construction, and industrial sector. Lower cost of production has provided a great opportunity for the global players to set up their manufacturing facility in the Asia-Pacific region, especially, in the developing nations such as China and India.
Mineral Wool Market Share, by Region , 2014
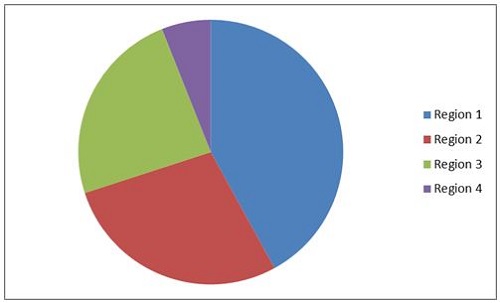
Source: MarketsandMarkets Analysis
Asia-Pacific will continue to lead the market till 2019, leaving behind developed economies, such as North America and Europe. In the mineral wool market, the industry comprises several global and regional players such as Saint-Gobain (France), Rockwool International (Denmark), Knauf Insulation (Netherlands), Industrial Insulation Group, LLC. (U.S.), CertainTeed Corp. (U.S.), Guardian Fiberglass, Inc. (U.S.), Johns Manville (U.S.), Owens Corning (U.S.), Roxul Inc. (Canada), Rock Wool Manufacturing Co. (U.S.), Thermafiber, Inc. (U.S.) and USG Interiors, Inc. (U.S.).
Table of Contents
1 Introduction (Page No. - 13)
1.1 Objectives
1.2 Market Definition
1.3 Market Scope
1.3.1 Market Covered
5.3 Strategic Benchmarking
1.4 Currency & Pricing
1.5 Package Size
1.6 Stake Holders
2 Research Methodology (Page No. - 17)
2.1 Market Size Estimation
2.2 Market Crackdown & Data Triangulation
2.3 Market Share Estimation
2.4 Assumption
3 Executive Summary (Page No. - 24)
4 Premium Insights (Page No. - 28)
4.1 Mineral Wool Market in Europe
4.2 U.S. Dominates the Global Market
4.3 Market: Developed vs Developing Nations
4.4 Life Cycle Analysis, By Region
5 Market Overview (Page No. - 33)
5.1 Introduction
5.2 Market Dynamics
5.2.1 Drivers
5.2.1.1 Rising Health Concerns Among the Population
5.2.1.2 Increasing Demand of Energy Efficient Buildings
5.2.1.3 Stringent Regulatory Policies
5.2.2 Restraints
5.2.2.1 Construction Sector Crisis in Europe
5.2.2.2 Lack of Awareness
5.2.3 Opportunity
5.2.3.1 More Energy & Comfort Requirements
5.2.4 Challenge
5.2.4.1 Proper Disposal & Recycling Technique
5.3 Strategic Benchmarking
6 Industry Trends (Page No. - 40)
6.1 Introduction
6.2 Supply Chain Analysis
6.2.1 Supply Chain Analysis
6.2.2 Key Market Players for Insulation
6.3 Porter�s Five Forces Analysis
6.3.1 Bargaining Power of Suppliers
6.3.2 Bargaining Power of Buyers
6.3.3 Threat of Substitutes
6.3.4 Threat of New Entrants
6.3.5 Degree of Competition
6.4 Raw Material Process Flow
6.4.1 Stone Wool
6.4.2 Glass Wool
6.5 Regulations & Policy Framework
7 Mineral Wool Market, By Application (Page No. - 48)
7.1 Introduction
7.2 Building & Construction
7.3 Industrial & Appliances
7.4 Transportation
7.5 Others
8 Mineral Wool Market, By Region (Page No. - 58)
8.1 Introduction
8.2 North America
8.2.1 U.S.
8.2.2 Canada
8.2.3 Mexico
8.3 Europe
8.3.1 Italy
8.3.2 Germany
8.3.3 France
8.3.4 U.K.
8.3.5 Spain
8.3.6 Russia
8.3.7 Rest of Europe
8.4 Asia-Pacific
8.4.1 China
8.4.2 Japan
8.4.3 India
8.4.4 Rest of Asia-Pacific
8.5 Rest of the World (RoW)
8.5.1 Brazil
8.5.2 Turkey
9 Competitive Landscape (Page No. - 94)
9.1 Overview
9.2 Expansion: The Most Popular Growth Strategy Between 2011-2014
9.3 Expansions
9.4 Mergers & Acquisitions
9.5 Agreement & Collaboration
9.6 New Product Launch & Development
10 Company Profiles (Page No. - 101)
(Overview, Financial*, Products & Services, Strategy, and Developments)
10.1 Introduction
10.2 Johns Manville Inc.
10.3 Knauf Insulation GmbH
10.4 Owens Corning
10.5 Paroc
10.6 Rockwool International A/S
10.7 Saint-Gobain
10.8 Uralita SA
10.9 Izocam
10.10 USG
10.11 Poly Glass Fiber Insulation
*Details Might Not Be Captured in Case of Unlisted Companies.
11 Appendix (Page No. - 124)
11.1 Discussion Guide
11.2 Introducing RT: Real Time Market Intelligence
11.3 Available Customizations
11.4 Related Reports
List of Tables (82 Tables)
Table 1 Mineral Wool Market Size, By Region, 2012�2019 ($Million)
Table 2 Impact of Global Mineral Wool Market Drivers (2014�2019)
Table 3 Impact of Global Market Restraints (2014�2019)
Table 4 Impact of Global Market Opportunity (2014�2019)
Table 5 Impact of Global Market Challenges (2014�2019)
Table 6 Regulations Across the Globe
Table 7 Market Size, By Application, 2012�2019 ($Million)
Table 8 Market Size, By Application, 2012�2019 (KT)
Table 9 Building & Construction Mineral Wool Market Size (Volume & Value), 2012�2019
Table 10 Building & Construction: Market Size, By Region, 2012�2019 ($Million)
Table 11 Building & Construction: Market Size, By Region, 2012�2019 (KT)
Table 12 Industrial & Apliances Market Size (Volume & Value), 2012�2019
Table 13 Industrial & Appliances: Market Size, By Region, 2012�2019 ($Million)
Table 14 Industrial & Apliances: Market Size, By Region, 2012�2019 (KT)
Table 15 Transportation Market Size (Volume & Value), 2012�2019
Table 16 Transportation Market Size, By Region, 2012�2019 ($Million)
Table 17 Transportation Market Size, By Region, 2012�2019 (KT)
Table 18 Other Market Size (Volume & Value), 2012�2019
Table 19 Others Mineral Wool Market Size, By Region, 2012�2019 ($Million)
Table 20 Others Market Size, By Region, 2012�2019 (KT)
Table 21 Mineral Wool Market Size, By Region, 2012�2019 ($Million)
Table 22 Mineral Wool Market Size, By Region, 2012�2019 (KT)
Table 23 North America: Mineral Wool Market Size, By Country, 2012�2019 ($Million)
Table 24 North America: Market Size, By Country, 2012�2019 (KT)
Table 25 North America: Market Size, By Product, 2012�2019 ($Million)
Table 26 North America: Market Size, By Product, 2012�2019 (KT)
Table 27 North America: Market Size, By Application, 2012�2019 ($Million)
Table 28 North America: Market Size, By Application, 2012�2019 (KT)
Table 29 U.S.: Mineral Wool Market Size, By Product, 2012�2019 ($Million)
Table 30 U.S.: Mineral Wool Market Size, By Product, 2012�2019 (KT)
Table 31 Canada: Market Size, By Product, 2012�2019 ($Million)
Table 32 Canada: Market Size, By Product, 2012�2019 (KT)
Table 33 Mexico: Market Size, By Product, 2012�2019 ($Million)
Table 34 Mexico: Market Size, By Product, 2012�2019 (KT)
Table 35 Europe: Market Size, By Country, 2012�2019 ($Million)
Table 36 Europe: Mineral Wool Market Size, By Country, 2012�2019 (KT)
Table 37 Europe: Market Size, By Product, 2012�2019 ($Million)
Table 38 Europe: Market Size, By Product, 2012�2019 (KT)
Table 39 Europe: Market Size, By Application, 2012�2019 ($ Million)
Table 40 Europe: Market Size, By Application, 2012�2019 (KT)
Table 41 Italy: Market Size, By Product, 2012�2019 ($Million)
Table 42 Italy: Market Size, By Product, 2012�2019 (KT)
Table 43 Germany: Market Size, By Product, 2012�2019 ($Million)
Table 44 Germany: Market Size, By Product, 2012�2019 (KT)
Table 45 France: Market Size, By Product, 2012�2019 ($Million)
Table 46 France: Market Size, By Product, 2012�2019 (KT)
Table 47 U.K.: Mineral Wool Market Size, By Product, 2012�2019 ($Million)
Table 48 U.K.: Mineral Wool Market Size, By Product, 2012�2019 (KT)
Table 49 Spain: Market Size, By Product, 2012�2019 ($Million)
Table 50 Spain: Market Size, By Product, 2012�2019 (KT)
Table 51 Russia: Mineral Wool Market Size, By Product, 2012�2019 ($Million)
Table 52 Russia: Market Size, By Product, 2012�2019 (KT)
Table 53 Rest of Europe: Market Size, By Product, 2012�2019 ($Million)
Table 54 Rest of Europe: Mineral Wool Market Size, By Product, 2012�2019 (KT)
Table 55 Asia-Pacific: Market Size, By Country, 2012�2019 ($Million)
Table 56 Asia-Pacific: Market Size, By Country, 2012�2019 (KT)
Table 57 Asia-Pacific: Mineral Wool Market Size, By Product, 2012�2019 ($Million)
Table 58 Asia-Pacific: Market Size, By Product, 2012�2019 (KT)
Table 59 Asia-Pacific: Market Size, By Application, 2012�2019 ($Million)
Table 60 Asia-Pacific: Market Size, By Application, 2012�2019 (KT)
Table 61 China: Market Size, By Product, 2012�2019 ($Million)
Table 62 China: Market Size, By Product, 2012�2019 (KT)
Table 63 Japan: Market Size, By Product, 2012�2019 ($Million)
Table 64 Japan: Market Size, By Product, 2012�2019 (KT)
Table 65 India: Market Size, By Product, 2012�2019 ($Million)
Table 66 India: Market Size, By Product, 2012�2019 (KT)
Table 67 Rest of Asia-Pacific: Mineral Wool Market Size, By Product, 2012�2019 ($Million)
Table 68 Rest of Asia-Pacific: Market Size, By Product, 2012�2019 (KT)
Table 69 RoW: Market Size, by Country, 2012�2019 ($Million)
Table 70 RoW: Market Size, by Country, 2012�2019 (KT)
Table 71 RoW: Market Size, By Product, 2012�2019 ($Million)
Table 72 RoW: Market Size, By Product, 2012�2019 (KT)
Table 73 RoW: Mineral Wool Market Size, By Application, 2012�2019 ($ Million)
Table 74 RoW: Market Size, By Application, 2012�2019 (KT)
Table 75 Brazil: Market Size, By Product, 2012�2019 ($Million)
Table 76 Brazil: Mineral Wool Market Size, By Product, 2012�2019 (KT)
Table 77 Turkey: Market, By Product, 2012�2019 ($Million)
Table 78 Turkey: Mineral Wool Market Size, By Product, 2012�2019 (KT)
Table 79 Expansions, 2011-2014
Table 80 Mergers & Acquisitions, 2011-2014
Table 81 Agreement & Collaboration, 2011-2014
Table 82 New Product Launch, 2011-2014
List of Figures (53 Figures)
Figure 1 Mineral Wool Market, By Product Type
Figure 2 Mineral Wool Market, By Application
Figure 3 Mineral Wool Market, By Region
Figure 4 Research Design
Figure 5 Market Size Estimation: Bottom-Up Approach
Figure 6 Market Size Estimation: Top-Down Approach
Figure 7 Breakdown of Primary Interviews, By Company Type, Designation, & Region
Figure 8 Market Crackdown & Data Triangulation
Figure 9 Key Data From Secondary Sources
Figure 10 Key Data From Primary Sources
Figure 11 Building & Construction to Continue Dominating the Mineral Wool Market During the Forecast Period
Figure 12 Europe is the Largest Mineral Wool Market
Figure 13 Nuilding & Construction Application is the Largest Application - 2014
Figure 14 Asia-Pacific is the Fastest-Growing Mineral Wool Market
Figure 15 Opportunities in Mineral Wool Market (2014-2019)
Figure 16 Transportation Segment to Grow at the Fastest Rate Among All Major Applications of Mineral Wool
Figure 17 Building & Construction Application Account for the Largest Share in Europe
Figure 18 Europe Registered the Largest Share in the Mineral Wool Market in 2014
Figure 19 Developing Markets to Grow Faster Than the Developed Ones
Figure 20 Asia-Pacific Market is Expected to Grow Rapidly in the Next Five Years (2014-2019)
Figure 21 Rise in Demand of Energy and Cost Efficient Industries Will Drive the Mineral Wool Market
Figure 22 Overview of Mineral Wool Supply Chain
Figure 23 Porter�s Five Forces Analysis
Figure 24 Stone Wool Manufacturing Process Flow Diagram
Figure 25 Glass Wool Manufacturing Process Flow Diagram
Figure 26 Building & Construction Application Dominates Global Mineral Wool Market
Figure 27 Building & Construction Market Size, By Region, 2014�2019 ($Million)
Figure 28 Industrial & Appliances Market Size, By Region, 2014�2019 ($Million)
Figure 29 Transportation Mineral Wool Market Size, 2014�2019 ($Million)
Figure 30 Regional Snapshot (2014)�China, India, and Mexico are Emerging as New Hot Spots
Figure 31 The U.S. is the Key Market for Top Three Applications of Mineral Wool in North America (2014 vs 2019)
Figure 32 The U.S. is the Key Market for Top Three Applications of Mineral Wool in North America (2014)
Figure 33 North American Mineral Wool Market By Applications at A Glance, 2014
Figure 34 Market in the U.S.: 2014 vs 2019
Figure 35 Market in Europe, 2013
Figure 36 Europe Mineral Wool Market By Applications, 2014 - 2019
Figure 37 Germany: Mineral Wool Market, 2014 vs 2019
Figure 38 China: Key Market for Top Three Applications of Mineral Wool in Asia-Pacific, 2013
Figure 39 Asia Pacific Mineral Wool Market By Applications at A Glance 2014
Figure 40 Companies Adopted Partnerships, Agreements, Collaborations & Expansions as Key Growth Strategies Over the Last Four Years
Figure 41 Rockwool International A/S & Saint-Gobain Grew at the Fastest Rate Between 2011-2013
Figure 42 Year 2014, Maximum Developments in Mineral Wool Insulation Market
Figure 43 Geographic Revenue Mix of Top 5 Market Players
Figure 44 Johns Manville: Company Snapshot
Figure 45 SWOT Analysis
Figure 46 Kanuf Insulation: SWOT Analysis
Figure 47 Owens Corning: Company Snapshot
Figure 48 SWOT Analysis
Figure 49 Paroc: Company Snapshot
Figure 50 Rockwool International A/S : Company Snapshot
Figure 51 SWOT Analysis
Figure 52 Saint-Gobain: Company Snapshot
Figure 53 SWOT Analysis


Growth opportunities and latent adjacency in Mineral Wool Market