
Mixed Tocopherols Market by Source (Soybean Oil, Rapeseed Oil, Sunflower Oil, and Corn Oil), Function, Compound, Form, Application (Food & Beverage, Feed, Dietary Supplements, Pharmaceuticals, and Cosmetics), and Region - Global Forecast to 2022
Market Segmentation
| Report Metrics | Details |
|
Market size available for years |
2016 - 2022 |
|
CAGR % |
5.4 |
Top 10 companies in Mixed Tocopherols Market


The mixed tocopherols market was valued at USD 3.66 billion in 2016, and is projected to grow at a CAGR of 5.4% from 2017, to reach USD 5.27 billion by 2022. The base year considered for the study is 2015, and the forecast period is from 2016 to 2022. Mixed tocopherols are used by food & beverage and feed manufacturers to meet the global consumer demand for vitamin E-rich products. Mixed tocopherols are widely used as a source of vitamin E by pharmaceutical and dietary supplement manufacturing companies. They are extracted from different sources such as soybean oil, rapeseed oil, corn oil, and sunflower oil through the vacuum extraction method. The factors influencing the mixed tocopherols market growth include health & wellness trends such as vitamin fortification in food & beverages and in feed, and regulations for sourcing, processing, packaging, and labeling of food & beverages.
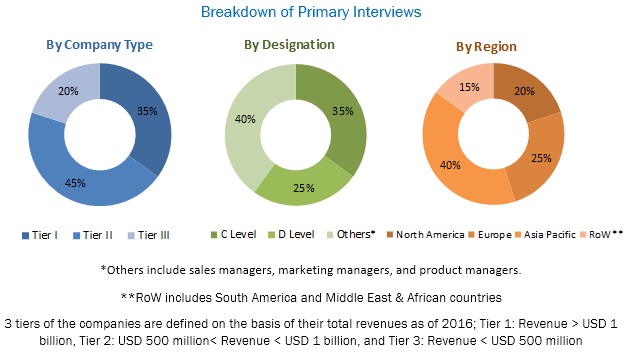
This report includes estimations of the market size in terms of value (USD billion) and volume (KT). Both top-down and bottom-up approaches have been used to estimate and validate the overall market size and the size of various other dependent submarkets in the overall market. The key players in the market have been identified through secondary research, some of the sources are press releases, paid databases such as Factiva and Bloomberg, annual reports, and financial journals; their market share in respective regions have also been determined through primary and secondary research. All percentage shares, splits, and breakdowns have been determined using secondary sources and were verified through primary sources. The figure below shows the breakdown of profiles of industry experts that participated in the primary discussions.
To know about the assumptions considered for the study, download the pdf brochure
The leading players in the mixed tocopherols market are considered for this study. A brief description of the companies and their products are mentioned in the company profiles. Detailed insights on the key strategies and recent developments of the are provided. The global market for mixed tocopherols is dominated by large players such as DuPont (US), ADM (US), DSM (Netherlands), Sigma Aldrich (US), and BASF (Germany).
Target Audience:
- Bakery food manufacturers
- Processed food manufacturers
- Bakery & confectionary importers and exporters
- Meat product importer and exporters
- Associations and industry bodies such as the European Union (EU), Eurostat, and UN Comtrade
- Raw material producers, suppliers, and distributors
- Research and consulting firms
�The study answers several questions for stakeholders, primarily which market segments to focus on in next two to five years for prioritizing efforts and investments.�
By Source
- Soybean oil
- Rapeseed oil
- Sunflower oil
- Corn oil
- Others (wheat germ oil, alfalfa, lettuce, and nuts & seeds)
By Function:
- Anti-oxidation
- Preservation
- Nutrient stabilization
- Flavor protection
By Compound
- Alpha tocopherols
- Beta tocopherols
- Gamma tocopherols
- Delta tocopherols
By Form
- Powder
- Liquid
- Gel
By Application
- Food & beverage
- Feed
- Dietary supplement
- Pharmaceuticals
- Cosmetics
By Region
- North America
- Europe
- Asia Pacific
- RoW (South America and the Middle East & African countries)
Available Customizations
With the given market data, MarketsandMarkets offers customizations according to the company�s specific needs.
The following customization options are available for the report:
Segment Analysis
- Product matrix, which gives a detailed comparison of the product portfolio of each company
- Detailed analysis at volume level can also be provided
Regional Analysis
- Further breakdown of the Rest of Asia Pacific mixed tocopherols market, by country
- Further breakdown of the Rest of Europe mixed tocopherols market, by country
- Further breakdown of South America, by country
- Further breakdown of the Middle East & Africa, by country
Company Information
- Detailed analysis and profiling of additional market players (up to five)
The overall mixed tocopherols market is projected to grow from USD 3.66 billion in 2016 to USD 5.27 billion by 2022 at a CAGR of 5.4%. Mixed tocopherols are generally considered as ingredients that are intended to be consumed as part of the diet and contain vitamin E, they offer the potential to enhance health or reduced risk of diseases. The global market is driven by the growing health consciousness & increased life expectancy among consumers, rising cases of chronic diseases, and applications of mixed tocopherols in feed, food & beverage, and dietary supplements.
Mixed tocopherols are used by food & beverage and feed manufacturers to meet the global consumer demand for vitamin E-rich products. Mixed tocopherols are widely used as a source of vitamin E by pharmaceutical and dietary supplement manufacturing companies. The mixed tocopherols market is diversified and competitive, with a large number of players, including large conglomerates, mid-tier companies, and start-up firms, though the market is dominated by a few large players. The global market is witnessing a shift, due to rising customer concerns for a balanced diet and growing incidences of chronic diseases. Food & beverage and feed manufacturers have been fortifying their products with mixed tocopherols to enhance their health benefits.
The mixed tocopherols market has been segmented, on the basis of application, into food & beverage, feed, dietary supplements, pharmaceuticals, and cosmetics. The market for cosmetics is expected to grow at the highest CAGR between 2017 and 2022. Among all the applications, the feed has the most common mixed tocopherols application. Mixed tocopherols have various functional characteristics; they can function as antioxidants, preservatives, nutrient stabilizer, and flavor protectors. These features increase the demand for mixed tocopherols in various application industries.
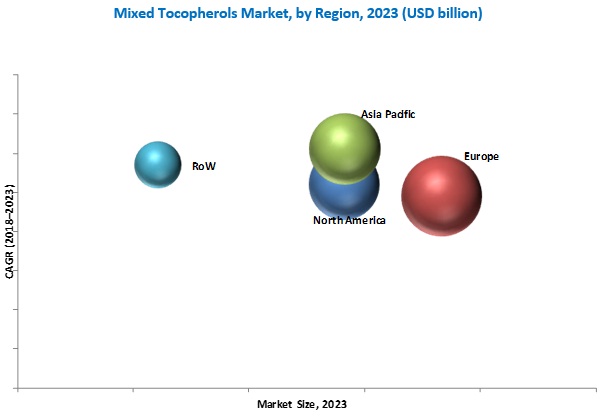
The global market in APAC is expected to grow at the highest CAGR during the forecast period. The increasing urban income has led to the growth in domestic mixed tocopherols demand. They are natural antioxidants, and since the consumers in the Asia Pacific region are shifting their interest towards products derived from natural sources, the mixed tocopherols market is expected to grow at a good pace in this region. Factors supporting the growth of this market include increasing consumer demand for natural sources of vitamins and nutrients and increased urban income that can be used for nutritional supplementation for human or pet usage.
The rising demand in emerging economies, rising number of government initiatives, and growth in various food & beverage applications are expected to create new growth opportunities for the mixed tocopherols market.
Food & beverage
Mixed tocopherols are used in food & beverage products to fortify them with vitamin E. When added in food & beverage products, they increase their nutritive value. Mixed tocopherols are used in food & beverage products as they act as antioxidants, which help prevent oxidation in cells, reduce the risk of cell degradation, and prevent diseases such as cancer. They are used in food & beverage applications such as baked goods, cereals, dehydrated potatoes, oils & fats, convenience foods, meat & egg products, nuts & seeds, and functional foods & beverages.
Feed
Since mixed tocopherols are an excellent source of vitamin E and fat-soluble in nature, they can easily blend with feed. An approved amount of mixed tocopherols in feed prevents the ill-effects of severe heat stress on egg production, egg weight, and eggshell density. They also help in the formation of eicosanoids in the membrane, which is a potent inflammation inducer. Mixed tocopherols combined in feeds aids in increasing the overall immunity, meat, skin, nail, and fur quality in animals.
Dietary Supplements
Mixed tocopherols are the most biologically active forms of vitamin E. They help in preventing heart diseases; due to their antioxidant properties, they disrupt a chain of events that lead to plaque build-up in the arteries. They also support healthy blood vessel function and improve metabolism, faster healing, improving vision, and increasing immunity. They are known to prevent other chronic diseases and cancer. Tocopherols prevent the fats and fat-soluble vitamin A stored in the body from breaking down and combining with other substances that may become harmful to the body. Mixed tocopherols also help combat neurological disorders.
Pharmaceuticals
Globally, there is a significant rise in the number of people suffering from chronic ailments such as obesity, diabetes, blood pressure, and cardiovascular diseases. In 2002, the increasing instances of chronic diseases such as osteoporosis, cancer, cardiovascular diseases, hypertension, and diabetes due to the lack of essential nutrients, caused around 29 million deaths worldwide.
This scenario has led to rising demand for mixed tocopherols, which are widely used as a preventive medication for chronic diseases. Due to such incidences, the market for mixed tocopherols is projected to grow in the pharmaceutical application.
Cosmetics
Mixed tocopherols are the most commonly used forms of vitamin E in cosmetic products. They have antioxidant properties, due to which they are gaining importance in cosmetics application. These properties of mixed tocopherols help to stabilize oxygen-sensitive ingredients in cosmetic formulations, protecting them against oxidation. Anti-oxidizing also helps in protection against skin aging. They provide protection against sun damage as well as repair sun damage. They stimulate collagen production and protect existing collagen by inhibiting matrix metalloproteinase [MMP] that degrades collagen. Mixed tocopherols have anti-inflammatory properties and increase the rate of wound healing. They also aid in increasing the shelf life of the products, as they act as natural preservatives.
Critical questions the report answers:
- Where will all these developments take the industry in the mid to long term?
- What are the upcoming industry applications for mixed tocopherols?
The mixed tocopherols market is diversified and competitive, with a large number of players, including large conglomerates, mid-tier companies, and start-up firms, though the market is dominated by a few large players. The factors influencing the global market growth include health & wellness trends such as vitamin fortification in food & beverages and in feed, regulations for sourcing, processing, packaging, and labeling of food & beverages. Mixed tocopherols are used to fortify various food products such as baked goods, cereals, dehydrated potatoes, meat & egg products, and oils & fats. The mixed tocopherols market is driven by the growing health consciousness & increased life expectancy among consumers, rising cases of chronic diseases, and applications of mixed tocopherols in feed, food & beverage, and dietary supplements.
The key players in this market are ADM (US), DSM (Netherlands), BASF (Germany), DuPont Danisco (US), Sigma Aldrich (US), Nutralliance (US), The Scoular Company (US), Vitae Naturals (Spain), B&D Nutrition (US), Davos Life Sciences (Singapore), and Cofco tech bioengineering (China). These companies use strategies such as acquisitions, expansions & investments, agreements, joint venture & partnerships, and new product launches/developments to strengthen their position in the market.
To speak to our analyst for a discussion on the above findings, click Speak to Analyst
Table of Contents
1 Introduction (Page No. - 15)
1.1 Objectives of the Study
1.2 Market Definition
1.3 Study Scope
1.4 Years Considered in the Report
1.5 Currency
1.6 Stakeholders
2 Research Methodology (Page No. - 18)
2.1 Introduction
2.2 Research Data
2.2.1 Secondary Data
2.2.1.1 Key Data From Secondary Sources
2.2.2 Primary Data
2.2.2.1 Key Data From Primary Sources
2.2.2.2 Key Industry Insights
2.2.2.3 Breakdown of Primaries
2.3 Macroeconomic Indicators
2.3.1 Developing Economies
2.3.2 Growing Middle-Class Population
2.4 Market Size Estimation
2.4.1 Bottom-Up Approach
2.4.2 Top-Down Approach
2.5 Market Breakdown & Data Triangulation
2.6 Assumptions and Limitations
2.6.1 Assumptions
2.6.2 Limitations
3 Executive Summary (Page No. - 30)
4 Premium Insights (Page No. - 36)
4.1 Attractive Opportunities in this Market
4.2 Market, By Region
4.3 Europe Held the Largest Share in this Market
4.4 Market, By Form
4.5 Market, By Application
4.6 Market, By Application & Sub-Application
4.7 Product Life Cycle, By Region
5 Market Overview (Page No. - 43)
5.1 Introduction
5.2 Market Segmentation
5.2.1 Source
5.2.2 Compound
5.2.3 Function
5.2.4 Form
5.2.5 Application
5.2.6 Region
5.3 Market Dynamics
5.3.1 Drivers
5.3.1.1 Consumer Awareness About the Health Benefits of Mixed Tocopherols and Increasing Focus on Preventive Healthcare
5.3.1.2 Growth of End-Use Applications of Mixed Tocopherols
5.3.1.3 Increasing Cases of Chronic Diseases
5.3.2 Restraints
5.3.2.1 High Cost Involved in R&D Activities
5.3.2.2 Increasing Raw Material Prices
5.3.3 Opportunities
5.3.3.1 Growing Demand in Emerging Economies
5.3.4 Challenges
5.3.4.1 Multi-Page Labeling
5.4 Value Chain Analysis
6 Mixed Tocopherols Market, By Source (Page No. - 53)
6.1 Introduction
6.2 Soybean Oil
6.3 Rapeseed Oil
6.4 Sunflower Oil
6.5 Corn Oil
6.6 Others
7 Mixed Tocopherols Market, By Function (Page No. - 63)
7.1 Introduction
7.2 Antioxidation
7.3 Preservation
7.4 Nutrient Stabilization
7.5 Flavor Protection
8 Mixed Tocopherols Market, By Compound (Page No. - 70)
8.1 Introduction
8.2 Alpha Tocopherols
8.3 Beta Tocopherols
8.4 Gamma Tocopherols
8.5 Delta Tocopherols
9 Mixed Tocopherols Market, By Form (Page No. - 77)
9.1 Introduction
9.2 Powder
9.3 Liquid
9.4 Gel
10 Mixed Tocopherols Market, By Application (Page No. - 83)
10.1 Introduction
10.2 Food & Beverage
10.3 Feed
10.4 Dietary Supplements
10.5 Pharmaceuticals
10.6 Cosmetics
11 Mixed Tocopherols Market, By Region (Page No. - 94)
11.1 Introduction
11.2 Regulations
11.3 North America
11.3.1 U.S.
11.3.2 Canada
11.3.3 Mexico
11.4 Europe
11.4.1 Germany
11.4.2 U.K.
11.4.3 France
11.4.4 Italy
11.4.5 Rest of Europe
11.5 Asia-Pacific
11.5.1 China
11.5.2 Japan
11.5.3 India
11.5.4 Australia & New Zealand
11.5.5 Rest of Asia-Pacific
11.6 Rest of the World (RoW)
11.6.1 Brazil
11.6.2 South Africa
11.6.3 Others in RoW
12 Brand Overview (Page No. - 127)
12.1 Introduction
12.2 Mixed Tocopherol 95 & 70 IZ By Royal DSM
12.3 Decanox By Archer Daniels Midland Company
12.4 (�)-?-Tocopherol By Sigma Aldrich
12.5 Naturo By Kemin Industries
12.6 Fortium By Kemin Industries
12.7 Natural Source Mixed Tocopherols By the Scoular Company
12.8 Sunvitol By Nutralliance
12.9 Vitapherole By Vitae Naturals
12.10 Decanox By B&D Nutritional Ingredients
12.11 Novatol By B&D Nutritional Ingredients
12.12 Mixed Tocopherols By Cofco Tech Bioengineering (Tianjin) Co., Ltd.
13 Competitive Landscape (Page No. - 129)
13.1 Overview
13.2 Competitive Situation & Trends
13.2.1 Expansions & Investments
13.2.2 Acquisitions
13.2.3 New Product Launches
14 Company Profiles (Page No. - 133)
(Company at A Glance, Recent Financials, Products & Services, Strategies & Insights, & Recent Developments)*
14.1 Archer Daniels Midland Company
14.2 DSM N.V.
14.3 BASF SE
14.4 Dupont Danisco
14.5 Sigma Aldrich
14.6 Nutralliance
14.7 The Scoular Company
14.8 Vitae Naturals
14.9 B&D Nutrition Industries
14.10 Davos Life Science
14.11 Cofco Tech Bioengineering (Tianjin) Co., Ltd.
*Details on Company at A Glance, Recent Financials, Products & Services, Strategies & Insights, & Recent Developments Might Not Be Captured in Case of Unlisted Companies.
15 Appendix (Page No. - 153)
15.1 Discussion Guide
15.2 Knowledge Store: Marketsandmarkets� Subscription Portal
15.3 Introducing RT: Real-Time Market Intelligence
15.4 Available Customizations
15.5 Related Reports
15.6 Author Details
List of Tables (119 Tables)
Table 1 Mixed Tocopherols Content in Important Sources
Table 2 Mixed Tocopherols Market Size, By Source, 2014�2022 (USD Million)
Table 3 Market Size, By Source, 2014�2022 (KT)
Table 4 Soybean Oil Market Size, By Region, 2014�2022 (USD Million)
Table 5 Soybean Oil Market Size , By Region, 2014�2022 (KT)
Table 6 Rapeseed Oil Market Size, By Region, 2014�2022 (USD Million)
Table 7 Rapeseed Oil Market Size, By Region, 2014�2022 (KT)
Table 8 Sunflower Oil Market Size, By Region, 2014�2022 (USD Million)
Table 9 Sunflower Oil Market Size, By Region, 2014�2022 (KT)
Table 10 Corn Oil Market Size, By Region, 2014�2022 (USD Million)
Table 11 Corn Oil Market Size, By Region, 2014�2022 (KT)
Table 12 Other Sources Market Size, By Region, 2014�2022 (USD Million)
Table 13 Other Sources Market Size, By Region, 2014�2022 (KT)
Table 14 Mixed Tocopherols Market Size, By Function, 2014�2022 (USD Million)
Table 15 Market Size, By Function, 2014�2022 (KT)
Table 16 Mixed Tocopherols Market Size as Antioxidant, By Region, 2014�2022 (USD Million)
Table 17 Market Size as Antioxidant, By Region, 2014�2022 (KT)
Table 18 Mixed Tocopherols Market Size as Preservative, By Region, 2014�2022 (USD Million)
Table 19 Market Size as Preservative, By Region, 2014�2022 (KT)
Table 20 Mixed Tocopherols Market Size as Nutrient Stabilizer, By Region, 2014�2022 (USD Million)
Table 21 Market Size as Nutrient Stabilizer, By Region, 2014�2022 (KT)
Table 22 Mixed Tocopherols Market Size as Flavor Protector, By Region, 2014�2022 (USD Million)
Table 23 Market Size as Flavor Protector, By Region, 2014�2022 (KT)
Table 24 Market Size for Mixed Tocopherols, By Compound, 2014�2022 (USD Million)
Table 25 Market Size, By Compound, 2014�2022 (KT)
Table 26 Alpha Tocopherols Market Size, By Region, 2014�2022 (USD Million)
Table 27 Alpha Tocopherols Market Size, By Region, 2014�2022 (KT)
Table 28 Beta Tocopherols Market Size, By Region, 2014�2022 (USD Million)
Table 29 Beta Tocopherols Market Size, By Region, 2014�2022 (KT)
Table 30 Gamma Tocopherols Market Size, By Region, 2014�2022 (USD Million)
Table 31 Gamma Tocopherols Market Size, By Region, 2014�2022 (KT)
Table 32 Delta Tocopherols Market Size, By Region, 2014�2022 (USD Million)
Table 33 Delta Tocopherols Market Size, By Region, 2014�2022 (KT)
Table 34 Market Size for Mixed Tocopherols, By Form, 2014�2022 (USD Million)
Table 35 Market Size, By Form, 2014�2022 (KT)
Table 36 Powder Mixed Tocopherols Market Size In, By Region, 2014�2022 (USD Million)
Table 37 Market Size, By Region, 2014�2022 (KT)
Table 38 Liquid Mixed Tocopherols Market Size, By Region, 2014�2022 (USD Million)
Table 39 Market Size, By Region, 2014�2022 (KT)
Table 40 Gel Mixed Tocopherols Market Size, By Region, 2014�2022 (USD Million)
Table 41 Market Size, By Region, 2014�2022 (KT)
Table 42 Market Size for Mixed Tocopherols, By Application, 2014�2022 (USD Million)
Table 43 Market Size, By Application, 2014�2022 (KT)
Table 44 Mixed Tocopherols Market Size in Food & Beverage Application, By Region, 2014�2022 (USD Million)
Table 45 Market Size in Food & Beverage Application, By Region, 2014�2022 (KT)
Table 46 Mixed Tocopherols Market Size in Food & Beverage, By Sub-Application, 2014�2022 (USD Million)
Table 47 Market Size in Food & Beverage, By Sub-Application, 2014�2022 (KT)
Table 48 Mixed Tocopherols Market Size in Feed, By Region, 2014�2022 (USD Million)
Table 49 Market Size in Feed, By Region, 2014�2022 (KT)
Table 50 Mixed Tocopherols Market Size in Dietary Supplements, By Region, 2014�2022 (USD Million)
Table 51 Market Sixe in Dietary Supplements, By Region, 2014�2022 (KT)
Table 52 Mixed Tocopherols Market Size in Pharmaceuticals, By Region, 2014�2022 (USD Million)
Table 53 Market Size in Pharmaceuticals, By Region, 2014�2022 (KT)
Table 54 Mixed Tocopherols Market Size in Cosmetics, By Region, 2014�2022 (USD Million)
Table 55 Market Size in Cosmetics, By Region, 2014�2022 (KT)
Table 56 Market Size for Mixed Tocopherols, By Region, 2014�2022 (USD Million)
Table 57 Market Size, By Region, 2014�2022 (KT)
Table 58 North America: Mixed Tocopherols Market Size, By Country, 2014�2022 (USD Million)
Table 59 North America: Market Size, By Country, 2014�2022 (KT)
Table 60 North America: Market Size for Mixed Tocopherols, By Source, 2014�2022 (USD Million)
Table 61 North America: Market Size, By Source, 2014�2022 (KT)
Table 62 U.S.: Mixed Tocopherols Market Size, By Source, 2014�2022 (USD Million)
Table 63 U.S.: Market Size, By Source, 2014�2022 (KT)
Table 64 Canada: Market Size for Mixed Tocopherols, By Source, 2014�2022 (USD Million)
Table 65 Canada: Market Size, By Source, 2014�2022 (KT)
Table 66 Mexico: Mixed Tocopherols Market Size, By Source, 2014�2022 (USD Million)
Table 67 Mexico: Market Size, By Source, 2014�2022 (KT)
Table 68 Europe: Market Size for Mixed Tocopherols, By Country, 2014�2022 (USD Million)
Table 69 Europe: Market Size, By Country, 2014�2022 (KT)
Table 70 Europe: Mixed Tocopherols Market Size, By Source, 2014�2022 (USD Million)
Table 71 Europe: Market Size, By Source, 2014�2022 (KT)
Table 72 Germany: Market Size for Mixed Tocopherols, By Source, 2014�2022 (USD Million)
Table 73 Germany: Market Size, By Source, 2014�2022 (KT)
Table 74 U.K.: Mixed Tocopherols Market Size, By Source, 2014�2022 (USD Million)
Table 75 U.K.: Market Size, By Source, 2014�2022 (KT)
Table 76 France: Market Size for Mixed Tocopherols, By Source, 2014�2022 (USD Million)
Table 77 France: Market Size, By Source, 2014�2022 (KT)
Table 78 Italy: Mixed Tocopherols Market Size, By Source, 2014�2022 (USD Million)
Table 79 Italy: Market Size, By Source, 2014�2022 (KT)
Table 80 Rest of Europe: Market Size for Mixed Tocopherols, By Source, 2014�2022 (USD Million)
Table 81 Rest of Europe: Market Size, By Source, 2014�2022 (KT)
Table 82 Asia-Pacific: Mixed Tocopherols Market Size, By Country, 2014�2022 (USD Million)
Table 83 Asia-Pacific: Market Size, By Country, 2014�2022 (KT)
Table 84 Asia-Pacific: Market Size for Mixed Tocopherols, By Source, 2014�2022 (USD Million)
Table 85 Asia-Pacific: Market Size, By Source, 2014�2022 (KT)
Table 86 China: Mixed Tocopherols Market Size, By Source, 2014�2022 (USD Million)
Table 87 China: Market Size, By Source, 2014�2022 (KT)
Table 88 Japan: Market Size for Mixed Tocopherols, By Source, 2014�2022 (USD Million)
Table 89 Japan: Market Size, By Source, 2014�2022 (KT)
Table 90 India: Mixed Tocopherols Market Size, By Source, 2014�2022 (USD Million)
Table 91 India: Market Size, By Source, 2014�2022 (KT)
Table 92 Australia & New Zealand: Market Size for Mixed Tocopherols, By Source, 2014�2022 (USD Million)
Table 93 Australia & New Zealand: Market Size, By Source, 2014�2022 (KT)
Table 94 Rest of Asia-Pacific: Mixed Tocopherols Market Size, By Source, 2014�2022 (USD Million)
Table 95 Rest of Asia-Pacific: Market Size, By Source, 2014�2022 (KT)
Table 96 RoW: Market Size for Mixed Tocopherols, By Country, 2014�2022 (USD Million)
Table 97 RoW: Market Size, By Country, 2014�2022 (KT)
Table 98 RoW: Mixed Tocopherols Market Size, By Source, 2014�2022 (USD Million)
Table 99 RoW: Market Size, By Source, 2014�2022 (KT)
Table 100 Brazil: Market Size for Mixed Tocopherols, By Source, 2014�2022 (USD Million)
Table 101 Brazil: Market Size, By Source, 2014�2022 (KT)
Table 102 South Africa: Mixed Tocopherols Market Size, By Source, 2014�2022 (USD Million)
Table 103 South Africa: Market Size, By Source, 2014�2022 (KT)
Table 104 Others in RoW: Market Size for Mixed Tocopherols, By Source, 2014�2022 (USD Million)
Table 105 Others in RoW: Market Size, By Source, 2014�2022 (KT)
Table 106 Expansions & Investments, 2012�2016
Table 107 Acquisitions & Mergers 2011�2015
Table 108 New Product Launches, 2012�2016
Table 109 Archer Daniels Midland Company: Products Offered
Table 110 DSM N.V.: Products & Services
Table 111 BASF SE: Products Offered
Table 112 Dupont Danisco: Products Offered
Table 113 Sigma Aldrich: Products Offered
Table 114 Nutralliance: Products Offered
Table 115 The Scoular Company: Products & Services
Table 116 Vitae Naturals: Products Offered
Table 117 B&D Nutrition Industries: Products & Services
Table 118 Davos Life Sciences: Products Offered
Table 119 Cofco Tech Bioengineering (Tianjin) Co., Ltd: Products Offered
List of Figures (58 Figures)
Figure 1 Mixed Tocopherols Market: Research Design
Figure 2 Breakdown of Primary Interviews: By Company Type, Designation, and Region
Figure 3 GDP Per Capita of Top Economies, 2011�2015
Figure 4 Middle-Class Population in Asia-Pacific Projected to Account for the Largest Share in the Global Market By 2030
Figure 5 Market Size Estimation: Bottom-Up Approach
Figure 6 Market Size Estimation Methodology: Top-Down Approach
Figure 8 Feed Segment to Dominate the Global Market, in Terms of Value, 2016�2022
Figure 9 Feed Segment to Dominate the Global Market, in Terms of Value, 2016�2022
Figure 10 Soybean Oil Segment Would Lead the Mixed Tocopherols Market, in Terms of Value, 2016�2022
Figure 11 Liquid Segment Led the Mixed Tocopherols Market, in Terms of Volume, in 2015
Figure 12 Gamma Tocopherols to Be the Largest Compound, in Terms of Value, 2014�2022
Figure 13 Europe Accounted for the Largest Share, in Terms of Value, 2015
Figure 14 an Emerging Market With Promising Growth Potential, 2016�2022
Figure 15 Asia-Pacific Projected to Grow at the Highest Rate From 2016 to 2022
Figure 16 Soybean Oil is Estimated to Hold the Largest Share in the European Market in 2016
Figure 17 Liquid Form is Projected to Be the Largest Between 2016 and 2022
Figure 18 Europe Dominated the Mixed Tocopherols Market Across All Applications in 2015, in Terms of Value
Figure 19 Feed Led the Mixed Tocopherols Market in 2015, in Terms of Value
Figure 20 European Mixed Tocopherols Market to Hit Maturity Phase
Figure 21 Mixed Tocopherols Market Segmentation
Figure 22 Market Segmentation, By Source
Figure 23 Market Segmentation, By Compound
Figure 24 Market Segmentation, By Function
Figure 25 Market Segmentation, By Form
Figure 26 Market Segmentation, By Application
Figure 27 Market Segmentation, By Food & Beverage Application
Figure 28 Market Segmentation, By Region
Figure 29 Mixed Tocopherols Market: Drivers, Restraints, Opportunities, and Challenges
Figure 30 Production/Processing of Mixed Tocopherols Contributes the Most to the Overall Value
Figure 31 Market for Mixed Tocopherols, By Source
Figure 32 Soybean Segment is Projected to Be the Largest Through 2022
Figure 33 Mixed Tocopherols Market, By Function
Figure 34 Antioxidation is Projected to Be the Largest Segment Through 2022
Figure 35 Market for Mixed Tocop, By Compound
Figure 36 Gamma Tocopherols to Account for the Largest Market Share Through 2022
Figure 37 Mixed Tocopherols Market, By Form
Figure 38 Market, By Application
Figure 39 Feed Segment is Projected to Be the Largest Through 2022
Figure 40 Cereal Segment is Projected to Be the Largest Through 2022
Figure 41 Geographic Snapshot (2016�2022): Europe has the Highest Market Share, Asia-Pacific is Growing to Become A New Hot Spot
Figure 42 Geographic Snapshot of Major Countries: India, China, and Brazil are Expected to Witness Rapid Growth
Figure 43 North American Mixed Tocopherols Market Snapshot
Figure 44 European Mixed Tocopherols Market Snapshot
Figure 45 Asia-Pacific Mixed Tocopherols Market Snapshot
Figure 46 RoW Mixed Tocopherols Market Snapshot
Figure 47 Acquisitions and Product Launches Were Prefered By the Mixed Tocopherols Companies in the Last Six Years
Figure 48 Acquisistions and Product Launches Fueled the Growth of Mixed Tocopherols Between January 2012 to September 2016
Figure 49 Acquisitions and Product Launch: the Key Strategies, 2011�2016
Figure 50 Archer Daniels Midland Company: Company Snapshot
Figure 51 Archer Daniels Midland Company: SWOT Analysis
Figure 52 DSM N.V.: Company Snapshot
Figure 53 DSM N.V.: SWOT Analysis
Figure 54 BASF SE: Company Snapshot
Figure 55 BASF SE: SWOT Analysis
Figure 56 Dupont Danisco: Company Snapshot
Figure 57 Dupont Danone: SWOT Analysis
Figure 58 Sigam Aldrich: Company Snapshot


Growth opportunities and latent adjacency in Mixed Tocopherols Market