Mobile Virtualization Market by Technology (Hypervisor, Application Containers, and Mobile Device Management), Organization Size (Large, and SMEs), Vertical (Retail, Media & Entertainment, Energy & Utility, BFSI, IT & Telecom) - Global Forecast to 2021


[133 pages Report] The global mobile virtualization market is estimated to grow from USD 2.16 Billion in 2016 to USD 5.68 Billion by 2021, at a CAGR of 21.3% during the forecast period.
Major growth drivers of the global market are increasing need to isolate personal and work data, high level of security and robustness to mobile applications, and the flourishing mobile industry.
Objectives of the study
- To define, describe, and forecast the global mobile virtualization market on the basis of technology, organization size, vertical, and region
- To provide detailed information about the major factors influencing the growth of the market (drivers, restraints, opportunities, and industry specific challenges)
- To analyze each submarket with respect to individual growth trends and its contribution towards the overall market
- To analyze the opportunities in the market for stakeholders and offer details of the market�s competitive landscape
- To forecast the market size of segments with respect to five main regions, namely, North America, Europe, Asia-Pacific, Middle East & Africa, and Latin America
- To profile key players and comprehensively analyze their core competencies (including innovation, quality, and customer experience)
- To track and analyze growth strategies, such as mergers & acquisitions, agreements & contracts, joint ventures, partnerships, and strategic alliances in the global market
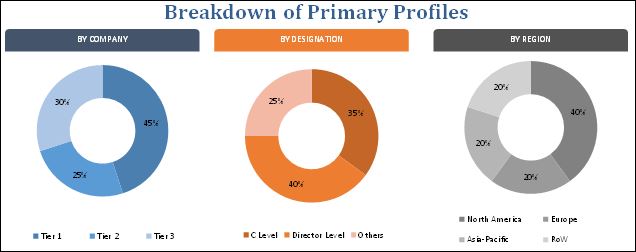
The research methodology used to estimate and forecast the global mobile virtualization market begins with capturing data about key vendor�s revenues through secondary research, such as annual reports, press releases and investor presentations of companies, white papers, technology journals and certified publications, articles from recognized authors, directories, and databases. Vendor offerings are also taken into consideration to determine market segmentation. The bottom up procedure was employed to arrive at the overall market size of the global market from the revenue of the key players in the market. After arriving at the overall market size, the total market was split into several segments and subsegments, which were then verified through primary research by conducting extensive interviews with key people, such as CEOs, VPs, directors, and executives. The data triangulation and market breakdown procedures were employed to complete the overall market engineering process and to arrive at the exact statistics for all segments and subsegments. The breakdown of profiles of primary is depicted in the figure below:
To know about the assumptions considered for the study, download the pdf brochure
The global mobile virtualization market ecosystem comprises vendors such as, International Business Machine Corporation (U.S.), VMware (U.S.), CA Technologies (U.S.), Oracle Corporation (U.S.), Microsoft Corporation (U.S.), Citrix Systems, (U.S.), AT&T, Inc. (U.S.), Harman International Industries, Inc. (U.S.), BlackBerry Limited (Canada), Cellrox Pvt. Ltd. (Israel). Other stakeholders of the global market include mobile virtualization software & solution provider, mobile device management solution provider, telecommunication service provider, mobile device manufacturers, BYOD service provider, and business enterprises.
Please visit 360Quadrants to see the vendor listing of Virtual Machine Software
Target audiences of the global mobile virtualization market report are:
- Mobile Device Manufacturers
- Telecommunication Service Providers
- Customer Experience Solution Providers
- Mobile Device Management Solution Providers
- End Users
"Study answers several questions for the stakeholders, primarily which market segments to focus in the next two to five years for prioritizing the efforts and investments"
Get online access to the report on the World's First Market Intelligence Cloud
Request Sample Scope of the Report

The research report categorizes the global mobile virtualization market to forecast revenues and analyze trends in each of the following subsegments:
By Technologies
- Hypervisors
- Application Containers
- Mobile Device Management
By Organization Size
- Large Enterprises
- SMEs
By Industry Vertical
- Retail, Media & Entertainment
- Manufacturing & Supply Chain Management
- IT & Telecom
- BFSI
- Healthcare & Life sciences
- Public sector & Education
- Energy & Utility
- Others
By Region
- North America
- Europe
- Asia-Pacific (APAC)
- Latin America
- Middle East and Africa (MEA)
Available Customizations
With the given market data, MarketsandMarkets offers customizations as per the company�s specific needs. The following customization options are available for the report:
Product Analysis
- Product matrix, which gives a detailed comparison of product portfolio of each company.
Geographic Analysis
- Further breakdown of the North America market
- Further breakdown of the Europe market
- Further breakdown of the APAC market
- Further breakdown of the Latin America market
- Further breakdown of the MEA market
Company Information
- Detailed analysis and profiling of additional market players
The global mobile virtualization market is projected to grow from USD 2.16 Billion in 2016 to USD 5.68 Billion by 2021, at a CAGR of 21.3% during the forecast period. Flourishing mobile industry and increasing use of mobile devices by consumers to perform different work related activities have resulted in increased demand for mobile virtualization. Furthermore, increasing need to provide security to enterprise data and applications is driving the global market.
The report provides detailed insights into the global mobile virtualization market, which is segmented into technology, vertical, organization size, and region. Based on technology, the market is segmented into hypervisors, application containers, and mobile device management. Among technologies, the hypervisor segment is projected to lead the global market during the forecast period.
Among verticals, the retail, and media & entertainment segment is projected to lead the global mobile virtualization market during the forecast period. This can be attributed to increasing privacy and security issues. Mobile virtualization solutions offer retailers the capacity to manage a diverse mobile fleet, increase customer engagement, improve store operations, and increase efficiency and connectivity of workforce. The healthcare & life sciences segment of the global market is projected to grow at the highest CAGR during the forecast period.
Large enterprises and SMEs prefer mobile virtualization across various industry verticals, as these deployments not only offer cost savings and improved IT efficiency to an organization, but also ensure business continuity. Based on organization size, the large enterprises segment is estimated to account for the largest share of the global mobile virtualization market in 2016. Mobile virtualization in large businesses is relatively high as compared to SMEs due to affordability and high economies of scale, which allow organizations to avail benefits of this tool. However, as SMEs across the world have started realizing the importance of mobile virtualization, adoption rate of mobile virtualization solutions is expected to increase significantly in SMEs during the forecast period.
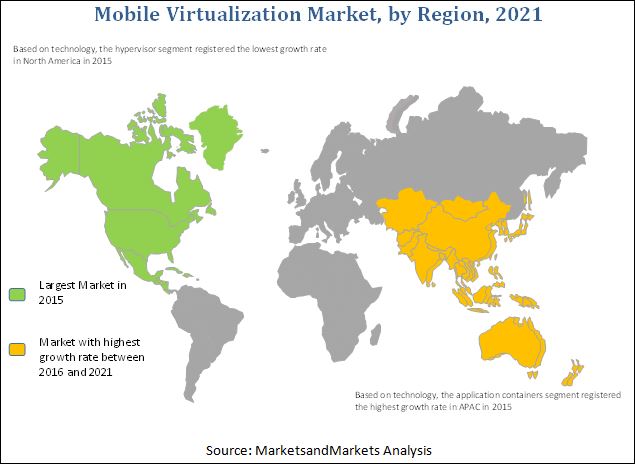
The report covers all the major aspects of the global market and provides an in-depth analysis across regions of North America, Europe, Asia-Pacific (APAC), the Middle East and Africa (MEA), and Latin America. North America is estimated to account for the largest share of the global market in 2016, owing the increased use of mobile devices. Organizations in North America have rapidly adopted mobile virtualization solutions to focus on cost savings, increasing business flexibility, and improved service levels. The Asia-Pacific mobile virtualization market is projected to grow at the highest CAGR during the forecast period.
Countries, such as Australia, India, Hong Kong, Myanmar, and South Korea are working with some of the service providers to help reduce security vulnerabilities in network through mobile virtualization. The growth of the mobile virtualization market in Asia-Pacific is further fueled by low cost of hardware, and increase in network visibility and flexibility facilitated by the technology.
However, the need for high-speed connectivity and limited adoption of mobile devices are acting as restraining factors for market growth. There are very few mobile virtualization vendors providing support to iOS, Windows, and other mobile device operating systems. Disparity in internet connectivity is restricting the growth of the global mobile virtualization market.
Most of the enterprises have adopted the strategy of agreements, collaborations, and partnerships to enhance end user and customer experience. For instance, in June 2016, VMware launched App Volumes 2.11, which is a real-time application delivery system that enterprises use to dynamically deliver and manage applications. In March 2015, Harman International Industries, Inc. acquired Red Bend Software (Israel), a leading provider of software and device management technology, over-the-air (OTA) software, and virtualization technology. This strengthened the company�s position in the automotive software industry, especially in the connected car segment.
To speak to our analyst for a discussion on the above findings, click Speak to Analyst
Table of Contents
1 Introduction (Page No. - 13)
1.1 Objectives of the Study
1.2 Market Definition
1.3 Market Scope
1.3.1 Markets Covered
1.3.2 Years Considered for the Study
1.4 Currency
1.5 Limitations
1.6 Stakeholders
2 Research Methodology (Page No. - 16)
2.1 Research Data
2.1.1 Secondary Data
2.1.1.1 Key Data From Secondary Sources
2.1.2 Primary Data
2.1.2.1 Key Data From Primary Sources
2.1.2.2 Key Industry Insights
2.2 Market Size Estimation
2.2.1 Bottom-Up Approach
2.2.2 Top-Down Approach
2.3 Market Breakdown and Data Triangulation
2.3.1 Assumptions
3 Executive Summary (Page No. - 24)
4 Premium Insights (Page No. - 29)
4.1 Attractive Market Opportunities in the Global Market
4.2 Global Market By Vertical
4.3 Global Market By Technology
4.4 Global Mobile Virtualization Market
4.5 Mobile Virtualization Market, By Region
4.6 Life Cycle Analysis, By Region
5 Market Overview (Page No. - 33)
5.1 Introduction
5.2 Evolution
5.3 Market Segmentation
5.3.1 By Technology
5.3.2 By Hypervisor Type
5.3.3 By Organization Size
5.3.4 By Vertical
5.3.5 By Region
5.4 Market Dynamics
5.4.1 Drivers
5.4.1.1 Increasing Need to Isolate Personal and Work Data
5.4.1.1 Booming Mobile Industry
5.4.1.2 Robustness and Security
5.4.2 Restraints
5.4.2.1 Need for High Speed Connectivity
5.4.2.2 Limited Adoption Across Devices
5.4.3 Opportunities
5.4.3.1 Mobile-To-Enterprise Virtualization
5.4.3.2 Mobility Cloud
5.4.4 Challenges
5.4.4.1 Lack of Awareness and Knowhow
5.5 Regulatory Implications
5.5.1 Introduction
5.5.2 Gramm�Leach�Bliley Act (GLBA)
5.5.3 Payment Card Industry (PCI) Data Security Standard (DSS)
5.5.4 Health Insurance Portability and Accountability Act (HIPAA)
5.5.5 Federal Information Security Management Act (FISMA)
5.5.6 Federal Information Processing Standard (FIPS)
6 Global Mobile Virtualization Market, By Technology (Page No. - 42)
6.1 Introduction
6.2 Hypervisor
6.2.1 Type -1 (Bare Metal Virtualization)
6.2.2 Type -2 (Hosted Virtualization)
6.3 Application Containers
6.4 Mobile Device Management Policies
7 Mobile Virtualization Market, By Vertical (Page No. - 49)
7.1 Introduction
7.2 Retail, Media & Entertainment
7.3 Manufacturing & Supply Chain Management
7.4 IT & Telecom
7.5 BFSI
7.6 Healthcare & Life Sciences
7.7 Public Sector & Education
7.8 Energy & Utility
7.9 Others
8 Global Mobile Virtualization Market, By Organizations Size (Page No. - 60)
8.1 Introduction
8.2 Small and Medium-Sized Enterprises
8.3 Large Enterprise
9 Regional Analysis (Page No. - 65)
9.1 Introduction
9.2 North America
9.3 Europe
9.4 Asia-Pacific
9.5 Middle East & Africa
9.6 Latin America
10 Competitive Landscape (Page No. - 87)
10.1 Overview
10.2 Competitive Situation and Trends
10.2.1 New Product Development & Launches
10.2.2 Acquisitions
10.2.3 Expansions
10.2.4 Agreements, Partnerships, and Collaborations
11 Company Profiles (Page No. - 93)
(Overview, Products & Services, Strategies & Insights, Developments and MnM View)*
11.1 IBM Corporation
11.2 VMware, Inc.
11.3 CA Technologies
11.4 Oracle Corporation
11.5 Microsoft Corporation
11.6 Citrix Systems, Inc.
11.7 Harman International Industries, Inc.
11.8 AT&T, Inc.
11.9 Blackberry Limited
11.10 Cellrox Pvt. Ltd.
*Details on Overview, Products & Services, Strategies & Insights, Developments and MnM View Might Not Be Captured in Case of Unlisted Companies.
12 Appendix (Page No. - 119)
12.1 Insights From Industry Experts
12.2 Discussion Guide
12.3 Knowledge Store: Marketsandmarkets� Subscription Portal
12.4 Introducing RT : Real-Time Market Intelligence
12.5 Available Customizations
12.6 Related Reports
List of Tables (71 Tables)
Table 1 Mobile Virtualization Market and Growth Rate, 2014-2021 (USD Million, Y-O-Y%)
Table 2 Global Market, By Technology, 2014�2021 (USD Million)
Table 3 Hypervisor: Market, By Region, 2014�2021 (USD Million)
Table 4 Type 1: Market, By Region, 2014�2021 (USD Million)
Table 5 Type 2: Market, By Region, 2014�2021 (USD Million)
Table 6 Application Containers: Market, By Region, 2014�2021 (USD Million)
Table 7 Mobile Device Management Policies: Market, By Region, 2014�2021 (USD Million)
Table 8 Global Mobile Virtualization Market, By Vertical, 2014-2021 (USD Million)
Table 9 Retail, Media & Entertainment: Market, By Region, 2014-2021 (USD Million)
Table 10 Retail, Media & Entertainment: Market, By Technology, 2014-2021 (USD Million)
Table 11 Manufacturing & Supply Chain Management: Market, By Region, 2014-2021 (USD Million)
Table 12 Manufacturing & Supply Chain Management: Market, By Technology, 2014-2021 (USD Million)
Table 13 IT & Telecom: Market, By Region, 2014-2021 (USD Million)
Table 14 IT & Telecom: Market, By Technology, 2014-2021 (USD Million)
Table 15 BFSI: Market, By Region, 2014-2021 (USD Million)
Table 16 BFSI: Mobile Virtualization Market, By Technology, 2014-2021 (USD Million)
Table 17 Healthcare & Life Sciences: Market, By Region, 2014-2021 (USD Million)
Table 18 Healthcare & Life Sciences: Market, By Technology, 2014-2021 (USD Million)
Table 19 Public Sector & Education: Market, By Region, 2014-2021 (USD Million)
Table 20 Public Sector & Education: Market, By Technology, 2014-2021 (USD Million)
Table 21 Energy & Utility: Mobile Virtualization Market, By Region, 2014-2021 (USD Million)
Table 22 Energy & Utility: Market, By Technology, 2014-2021 (USD Million)
Table 23 Other Verticals: Market, By Region, 2014-2021 (USD Million)
Table 24 Other Verticals: Market, By Technology, 2014-2021 (USD Million)
Table 25 Global Mobile Virtualization Market, By Organization Size, 2014�2021 (USD Billion)
Table 26 Small and Medium-Sized Enterprises: Market, By Region, 2014�2021 (USD Million)
Table 27 Large Enterprises: Market, By Region, 2014�2021 (USD Million)
Table 28 Global Mobile Virtualization Market, By Region, 2014�2021 (USD Million)
Table 29 North America Market, By Technology, 2014�2021 (USD Million)
Table 30 Hypervisors: North America Market, By Type, 2014�2021 (USD Million)
Table 31 Hypervisors: North America Market, By Vertical, 2014�2021 (USD Million)
Table 32 Application Containers: North America Market, By Vertical, 2014�2021 (USD Million)
Table 33 Device Management Policies: North America Market, By Vertical, 2014�2021 (USD Million)
Table 34 North America Market, By Organization Size, 2014�2021 (USD Million)
Table 35 North America Market, By Vertical, 2014�2021 (USD Million)
Table 36 Europe Mobile Virtualization Market, By Technology, 2014�2021 (USD Million)
Table 37 Hypervisor: Europe Market, By Type, 2014�2021 (USD Million)
Table 38 Hypervisors: Europe Market, By Vertical, 2014�2021 (USD Million)
Table 39 Application Containers: Europe Market, By Vertical, 2014�2021 (USD Million)
Table 40 Device Management Policies: Europe Market, By Vertical, 2014�2021 (USD Million)
Table 41 Europe Market, By Organization Size, 2014�2021 (USD Million)
Table 42 Europe Market, By Vertical, 2014�2021 (USD Million)
Table 43 Asia-Pacific Market, By Technology, 2014�2021 (USD Million)
Table 44 Hypervisors: Asia-Pacific Market, By Type, 2014�2021 (USD Million)
Table 45 Hypervisors: Asia-Pacific Market, By Vertical, 2014�2021 (USD Million)
Table 46 Application Containers: Asia-Pacific Market, By Vertical, 2014�2021 (USD Million)
Table 47 Device Management Policies: Asia-Pacific Mobile Virtualization Technology Market, By Vertical, 2014�2021 (USD Million)
Table 48 Asia-Pacific Mobile Virtualization Market, By Organization Size, 2014�2021 (USD Million)
Table 49 Asia-Pacific Market, By Vertical, 2014�2021 (USD Million)
Table 50 Middle East & Africa Market, By Technology, 2014�2021 (USD Million)
Table 51 Hypervisors: Middle East & Africa Market, By Type, 2014�2021 (USD Million)
Table 52 Hypervisors: Middle East & Africa Market, By Vertical, 2014�2021 (USD Million)
Table 53 Application Containers: Middle East & Africa Market, By Vertical, 2014�2021 (USD Million)
Table 54 Device Management Policies: Middle East & Africa Market, By Vertical, 2014�2021 (USD Million)
Table 55 Middle East & Africa Market, By Organization Size, 2014�2021 (USD Million)
Table 56 Middle East & Africa Market, By Vertical, 2014�2021 (USD Million)
Table 57 Latin America Market, By Technology, 2014�2021 (USD Million)
Table 58 Latin America Market, By Type, 2014�2021 (USD Million)
Table 59 Hypervisors: Latin America Market, By Vertical, 2014�2021 (USD Million)
Table 60 Application Containers: Latin America Market, By Vertical, 2014�2021 (USD Million)
Table 61 Device Management Policies: Latin America Market, By Vertical, 2014�2021 (USD Million)
Table 62 Latin America Mobile Virtualization Market, By Organization Size, 2014�2021 (USD Million)
Table 63 Latin America Market, By Vertical, 2014�2021 (USD Million)
Table 64 New Product Development & Launches, 2014-2016
Table 65 Acquisitions, 2014-2016
Table 66 Expansions, 2015
Table 67 Agreements, Partnerships, and Collaborations, 2014-2016
Table 68 New Product Launches/Developments, 2014-2016
Table 69 Acquisitions, 2014-2016
Table 70 Expansions, 2014-2016
Table 71 Partnerships, Collaborations & Agreements, 2014-2016
List of Figures (53 Figures)
Figure 1 Research Design
Figure 2 Market Size Estimation Methodology: Bottom Up Approach
Figure 3 Market Size Estimation Methodology: Top-Down Approach
Figure 4 Market Breakdown Data Triangulation Approach
Figure 5 Asia-Pacific Mobile Virtualization Market Projected to Grow at Highest CAGR Between 2016 and 2021
Figure 6 Application Containers Segment Projected to Grow at Highest CAGR During the Forecast Period
Figure 7 Type 2 of the Hypervisor Technology Type to Grow at the Highest CAGR
Figure 8 Small- and Medium-Sized Enterprises Segment to Grow at the Highest CAGR During the Forecast Period
Figure 9 Among Verticals, Healthcare & Life Sciences Segment to Grow at the Highest CAGR During the Forecast Period
Figure 10 North American Region Accounted for the Largest Share of the Global Market in 2015
Figure 11 Enterprise Mobility and BYOD are Expected to Drive the Global Market During the Forecast Period
Figure 12 Healthcare & Life Sciences Segment is Expected to Grow at the Highest CAGR During the Forecast Period
Figure 13 The Application Containers Segment is Expected to Witness Highest Growth During the Forecast Period
Figure 14 The Hypervisors Segment is Expected to Lead the Global Market in 2016
Figure 15 Asia-Pacific is Expected to Be the Fastest-Growing Market for Mobile Virtualization During the Forecast Period
Figure 16 Regional Life Cycle � the Asia-Pacific Mobile Virtualization Market is Projected to Grow at the Highest CAGR During the Forecast Period
Figure 17 Need to Segregate Access to Personal and Work Information Using Single Mobile Device has Resulted in Evolution of Mobile Virtualization Solutions
Figure 18 Mobile Virtualization Market Segmentation: By Technology
Figure 19 Market Segmentation: By Hypervisor Type
Figure 20 Market Segmentation: By Organization Size
Figure 21 Market Segmentation: By Vertical
Figure 22 Market Segmentation: By Region
Figure 23 Global Mobile Virtualization Market: Drivers, Restraints, Opportunities, and Challenges
Figure 24 Application Containers Segment is Expected to Grow at the Highest CAGR During the Forecast Period
Figure 25 Hypervisor Segment of the Mobile Virtualization Market in Asia-Pacific is Expected to Grow at the Highest CAGR
Figure 26 The Application Containers Segment Expected to Grow at the Highest CAGR in Asia-Pacific
Figure 27 Mobile Device Management Policies Segment is Expected to Grow at the Highest Rate in Asia-Pacific
Figure 28 The Healthcare & Life Sciences Segment of the Mobile Virtualization Market is Projected to Grow at the Highest CAGR During the Forecast Period
Figure 29 Small and Medium-Sized Enterprises Segment is Expected to Grow at the Highest CAGR During the Forecast Period
Figure 30 Small and Medium-Sized Enterprises Segment is Expected to Grow at the Highest Rate in the Middle East & Africa
Figure 31 Large Enterprises Segment in Asia-Pacific is Expected to Grow at the Highest CAGR During the Forecast Period
Figure 32 North America Expected to Lead the Global Mobile Virtualization Market in 2016
Figure 33 The Market in Asia-Pacific Expected to Grow at the Highest CAGR During the Forecast Period
Figure 34 North America Mobile Virtualization Market Snapshot
Figure 35 Asia-Pacific Mobile Virtualization Market Snapshot
Figure 36 Companies Adopted Acquisitions and Partnerships/ Agreements/Collaborations as the Key Growth Strategies From 2014-2016
Figure 37 Market Evaluation Framework
Figure 38 Battle for Market Share: Acquisitions & Partnerships, Collaborations & Agreements and are the Key Strategies
Figure 39 IBM Corporation: Company Snapshot
Figure 40 IBM Corporation :SWOT Analysis
Figure 41 VMware, Inc.: Company Snapshot
Figure 42 VMware, Inc.: SWOT Analysis
Figure 43 CA Technologies: Company Snapshot
Figure 44 CA Technologies :SWOT Analysis
Figure 45 Oracle Corporation: Company Snapshot
Figure 46 Oracle Corporation :SWOT Analysis
Figure 47 Microsoft Corporation: Company Snapshot
Figure 48 Microsoft Corpotation :SWOT Analysis
Figure 49 Citrix Systems, Inc.: Company Snapshot
Figure 50 Citrix Systems, Inc :SWOT Analysis
Figure 51 Harman International Industries, Inc.: Company Snapshot
Figure 52 AT&T: SWOT Analysis
Figure 53 Blackberry Limited: Company Snapshot


Growth opportunities and latent adjacency in Mobile Virtualization Market