Nanocoatings Market by Type (Anti-fingerprint, Anti-microbial, Easy-to-clean & Anti-fouling, Self-cleaning and Other), by Application (Healthcare, Food & Packaging, Marine industry, Water treatment equipment, Electronics, Construction, Automotive, Energy and others), and by Region - Trends & Forecasts to 2019


[205 Pages Report] Nanocoatings, materials that are manufactured by shrinking raw materials at the molecular level to form a denser product; they are measured on a nano-scale. They, due to lower VOCs (volatile organic contents) content, are preferred over traditional coatings. Nanocoatings have characteristics, such as scratch, UV, chemical resistance, low maintenance, anti-corrosion, and color and gloss retention among others. They also prevent the painted surface from being damaged that is caused by external factors, such as UV and acid rain. Nanocoatings are classified as anti-fingerprint, anti-microbial, anti-fouling and easy-to-clean, self-cleaning (bionic and photocatalytic), and others (specialty coatings and anti-corrosion). Anti-microbial is the most used nanocoating across various applications. Anti-microbial nanocoatings are used by applications, such as healthcare, water treatment equipment, food manufacturing, and packaging. Anti-fouling and easy-to-clean nanocoatings are the second-largest market for nanocoatings and find applications in marine, food manufacturing, automotive, and electronics among others. Anti-fingerprint nanocoatings are projected to grow in the near future due to the increasing demand from the electronics, automotive, medical, and healthcare industries. Other types of nanocoatings find applications in the construction, packaging, and textiles industries.
The nanocoatings market has grown significantly during the past few years and is projected to display higher growth rates in the next five years. The growing automotive and electronics industry, has led to the growth of the nanocoatings during the forecast period 2014-2019. Growth in the coatings sector coupled with rising demand, urbanization in BRIC countries has been driving the global market in the past few years.
The report covers the nanocoatings market in the key regions, namely Asia-Pacific, North America, Europe, and RoW.
The report aims to study the market of Nanocoatings for 2013, and project the expected demand for the period 2014�2019. It provides a comprehensive review of the main market drivers, restraints, opportunities, winning imperatives, challenges, and key issues in the market. The nanocoatings market is further segmented, estimated, and forecast on the basis of type and application of nanocoatings. Various secondary sources, such as encyclopedia, directories, and databases have been used to identify and collect information useful for an extensive research on this market. The primary sources, experts from related industries and suppliers, have been interviewed to obtain and verify critical information as well as to assess the future prospects of the nanocoatings industry.
Competitive scenarios of the top players in this market are discussed in detail. We have also profiled the leading players of this industry with their recent developments and other strategic industry activities. These include Bio-Gate Ag (Germany), Buhler PARTECH GmbH (Germany), Inframat Corporation (U.S.), Nanofilm Ltd. (U.S.), among others.
Get online access to the report on the World's First Market Intelligence Cloud
Request Sample Scope of the Report
: This research report categorizes the market for nanocoatings on the basis of application, type, and region; forecasting volume, value, and analyzing trends in each of the application and product type.

On the basis of type: This market is segmented on the basis of type of nanocoatings: anti-fingerprint, anti-microbial, anti-fouling and easy-to-clean, self-cleaning (bionic and photocatalytic), and others (specialty coatings and anti-corrosion). Each product type is further described in detail in the report, from both the value and volume perspective for each product type.
On the basis of application: Healthcare, Food & Packaging, Marine Industry, Water Treatment equipment, Electronics, Construction, Automotive, Energy, and Others (cosmetics, agriculture and textile). Each application is further described in detail in the report, from the value and volume perspective for each application.
On the basis of region: Asia-Pacific, North America, Europe, and Rest of the World, U.S., China, and Canada.
Nanocoatings are used in healthcare, automotive, food and packaging, marine industry, water treatment equipment, electronics, construction, energy and textiles. Nanocoatings have characteristics such as scratch, UV, chemical resistance, low maintenance, anti-corrosion and color and gloss retention among others.
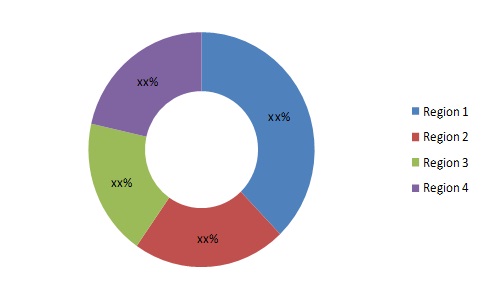
North America dominated global market in 2013, in terms of value. The global nanocoatings market is growing owing to the huge demand from medical and automotive coatings industry. Growth in the coatings sector coupled with rising demand, urbanization in BRIC countries has been driving the global market in the past few years. Additionally, European governments have stringent regulations associated with coatings industry due to VOCs content. Nanocoatings offer environmental benefits due to low VOCs in it resulting in more demand in upcoming years.
Nanocoatings Market Share, by Region, 2013
Source: MarketsandMarkets Analysis
Asia Pacific is anticipated to be the fastest growing market for nanocoatings in the coming years. The demand for nanocoatings is likely to increase in Asia Pacific due to growing automotive and electronics industry.
Though global Nanocoatings market is highly fragmented, major players are located in the developed countries. Demand from the emerging markets is likely to remain robust in the coming five years, due to rising awareness about the benefits of Nanocoatings. Major players have prominent presence in the developing countries.
This report analyzes the global nanocoatings market along with detailed segmentation on the basis of its major types, along with its forecast till 2019. This report discusses in detail, major supply and demand factors affecting this market on the global, regional, and country level.
The dominant players in Nanocoatings market are Bio-Gate AG (Germany), Buhler PARTEC GmbH (Germany), Nanogate AG (Germany), P2i Ltd.(U.K.), Nanofilm Ltd.(U.S.) and Inframat Corporation (U.S.).
Table of Contents
1 Introduction(Page No. - 16)
1.1 Objectives of the Study
1.2 Market Scope
1.2.1 Market Definition
1.2.2 Markets Covered
1.2.2.1 Nanocoatings Market, By Type
1.2.2.2 Nanocoatings Market, By Application
1.2.2.3 Nanocoatings Market, By Region
1.2.2.4 Year
1.2.2.4 Currency
1.2.2.5 Package Size
1.2.2.6 Limitations
1.3 Stakeholders
2 Research Methodology(Page No. - 20)
2.1 Description of the Nanocoatings Market
2.2 Market Size Estimation
2.3 Market Crackdown and Data Triangulation
2.4 Market Share Estimation
2.4.1 Key Data Taken From Secondary Sources
2.4.2 Key Data Taken From Primary Sources
2.4.3 Assumptions
3 Executive Summary(Page No. - 30)
4 Premium Insights(Page No. - 34)
5 Market Overview(Page No. - 39)
5.1 Introduction
5.2 Market Segmentation
5.2.1 By Type
5.2.2 By Application
5.2.3 By Region
5.3 Market Dynamics
5.3.1 Drivers
5.3.1.1 Performance Benefits and Commercial Activities
5.3.1.2 Rise in World Population, Income Level, Ease of Living and Awareness
5.3.1.3 Rising Awareness About Infections From Various Surrounding Objects and Hospital Acquired Infections(HAI)
5.3.2 Restraints
5.3.2.1 Volatility in the Prices of Raw Materials
5.3.2.2 Hazards to Environment and Health
5.3.3 Opportunities
5.3.3.1 Growing Healthcare, Automotive and Construction Markets
5.3.3.2 Display Screen of Electronics Requiring Functional Coatings
5.3.4 Challenges
5.3.4.1 Stringent and Time Consuming Regulatory Policies
6 Industry Trends(Page No. - 51)
6.1 Introduction
6.2 Value Chain Analysis
6.3 Porter�s Five Forces Analysis
6.3.1 Bargaining Power of Suppliers
6.3.2 in the Nanocoatings Market, the Bargaining Power of Supplier is Low Based on the Following Factors:
6.3.3 Bargaining Power of Buyers
6.3.4 Threat of Substitutes
6.3.5 Threat of New Entrants
6.3.6 Intensity of Rivalry
6.4 Market Life Cycle Analysis
7 Nanocoatings Market, By Type(Page No. - 58)
7.1 Introduction
7.2 Anti-Fingerprint Nanocoatings
7.3 Anti-Microbial Nanocoatings
7.4 Easy-To-Clean & Anti-Fouling Nanocoatings
7.5 Self-Cleaning (Bionic & Photocatalytic) Nanocoatings
7.6 Other Nanocoatings
8 Nanocoatings Market, By Application(Page No. - 72)
8.1 Introduction
8.2 Healthcare
8.3 Food & Packaging
8.4 Marine Industry
8.5 Water Treatment Equipment
8.6 Electronics
8.7 Construction
8.8 Automotive
8.9 Energy
8.1 Others
9 Regional Analysis(Page No. - 99)
9.1Introduction
9.2 North America
9.2.1 U.S.
9.2.2 Canada
9.2.3 Mexico
9.3 Asia-Pacific
9.3.1 China
9.3.2 Japan
9.3.3 South Korea
9.3.4 India
9.3.5 Other Asia-Pacific Countries
9.4 Europe
9.4.1 Germany
9.4.2 France
9.4.3 U.K.
9.4.4 Others
9.5 ROW
9.5.1 South America
9.5.2 GCC Countries
9.5.3 Africa
9.5.4 Other Countries
10 Competitive Landscape(Page No. - 153)
10.1 Overview
10.2 Market Share Analysis
10.3 Competitive Situation and Trends
10.3.1 Expansions & Investments
10.3.2 New Product Launch
10.3.3 Agreements & Partnerships
10.3.4 Acquisitions
11 Company Profiles(Page No. - 164)
11.1 Introduction
11.2 Buhler AG.
11.2.1 Business Overview
11.2.2 Products & Services
11.2.3 Key Strategy
11.2.4 Recent Developments
11.2.5 SWOT Analysis
11.2.6 MNM View
11.3 Nanogate AG
11.3.1 Business Overview
11.3.2 Products Offered
11.3.3 Key Strategy
11.3.4 Recent Developments
11.4 Nanophase Technologies Corporation
11.4.1 Business Overview
11.4.2 Products Offered
11.4.3 Key Strategy
11.4.4 SWOT Analysis
11.4.5 MNM View
11.5 Bio-Gate AG
11.5.1 Business Overview
11.5.2 Products Offered
11.5.3 Key Startegy
11.5.4 SWOT Analysis
11.5.5 MNM View
11.6 ADMAT Innovations
11.6.1 Business Overview
11.6.2 Products & Services
11.6.3 Key Strategy
11.7 Surfix BV Advanced Nanocoatings
11.7.1 Company Overview
11.7.2 Products and Services
11.7.3 Key Strategy
11.8 Nanomech Inc.
11.8.1 Products and Services
11.8.2 Key Strategy
11.9 EIKOS Inc.
11.9.1 Business Overview
11.9.2 Products Offered
11.9.3 Key Strategy
11.1 CIMA Nanotech
11.10.1 Business Overview
11.10.2 Products Offered
11.10.3 Key Strategy
11.10.4 Recent Developments
11.11 Telsa Nanocoatings Inc.
11.11.1 Business Overview
11.11.2 Products Offered
11.11.3 Key Strategy
11.12 CG2 Nanocoatings
11.12.1 Business Overview
11.12.2 Products Offered
11.12.3 Key Strategy
11.13 Inframat Corporation
11.13.1 Business Overview
11.13.2 Products Offered
11.13.3 Key Strategy
11.13.4 SWOT Analysis
11.13.5 MNM View
11.14 P2I Ltd
11.14.1 Business Overview
11.14.2 Products Offered
11.14.3 Key Strategy
11.14.4 Recent Developments
11.14.5 SWOT Analysis
11.14.6 MNM View
11.15 Integran Technologies
11.15.1 Business Overview
11.15.2 Products Offered
11.15.3 Key Strategy
11.16 Nanovere Technologies LLC
11.16.1 Business Overview
11.16.2 Products Offered
11.16.3 Recent Developments
11.17 Nanofilm Ltd.
11.17.1 Business Overview
11.17.2 Products &Services
11.17.3 Key Strategy
11.18 Nano-Care AG
11.18.1 Business Overview
11.18.2 Products Offered
11.18.3 Key Startegy
12 Appendix(Page No. - 195)
12.1 Discussion Guide
12.2 Introducing RT: Real-Time Market Intelligence
12.3 Available Customizations
12.4 Related Reports
List of Tables (126 Tables)
Table 1 Performance Benefits and Commercial Activities Are Driving the Market
Table 2 Volatility in the Raw Material Prices Pose as A Restraint for the Nanocoatings Market
Table 3 Growing Healthcare, Automotive and Construction Markets Are the Major Oppportunities for Growth of the Nanocoatings
Table 4 Stringent & Uncertain Regulations in the U.S. Pose A Challenge for the Market
Table 5 Global Nanocoatings Market Size , By Type, 2012�2019 ($Million)
Table 6 Global Nanocoatings Market Size , By Type, 2012�2019 (Tons)
Table 7 Anti-Fingerprint Nanocoatings Market, By Region, 2012�2019 ($Million)
Table 8 Anti-Fingerprint Nanocoatings Market, By Region, 2012�2019 (T)
Table 9 Anti-Microbial Nanocoatings Market, By Region, 2012�2019 ($ Million)
Table 10 Anti-Microbial Nanocoatings Market, By Region, 2012�2019 (T)
Table 11 Easy-To-Clean & Anti-Fouling Nanocoatings Market, By Region, 2012�2019 ($ Million)
Table 12 Easy-To-Clean & Anti-Fouling Nanocoatings Market, By Region, 2012�2019 (T)
Table 13 Self-Cleaning Nanocoatings Market, By Region, 2012�2019 ($ Million)
Table 14 Self-Cleaning Nanocoatings Market, By Region, 2012�2019 (T)
Table 15 Other Nanocoatings Market, By Region, 2012�2019 ($ Million)
Table 16 Other Nanocoatings Market, By Region, 2012�2019 (T)
Table 17 Global Nanocoatings Market, By Application, 2012�2019 ($ Million)
Table 18 Global Nanocoatings Coatings Market, By Application, 2012�2019 (T)
Table 19 Global Nanocoatings Market in Healthcare Sector, By Region, 2012�2019 ($ Million)
Table 20 Global Nanocoatings Market in Healthcare Sector, By Region, 2012�2019 (T)
Table 21 Global Nanocoatings Market in Food & Packaging Sector, By Region, 2012�2019 ($ Million)
Table 22 Global Nanocoatings Market in Food & Packaging Sector, 2012�2019 (T)
Table 23 Global Nanocoatings Market in Marine Industry, By Region, 2012�2019 ($ Million)
Table 24 Global Nanocoatings Market in Marine Industry, By Region, 2012�2019 (T)
Table 25 Global Nanocoatings Market in Water Treatment Equipment, By Region, 2012�2019 ($ Million)
Table 26 Global Nanocoatings Market in Water Treatment Equipment, By Region,2012�2019 (T)
Table 27 Global Nanocoatings Market in Electronics, By Region, 2012�2019 ($ Million)
Table 28 Global Nanocoatings Market in Electronics, By Region,2012�2019 (T)
Table 29 Global Nanocoatings Market in Construction, By Region, 2012�2019 ($ Million)
Table 30 Global Nanocoatings Market in Construction, By Region,2012�2019 (T)
Table 31 Global Nanocoatings Market in Automotive, By Region, 2012�2019 ($ Million)
Table 32 Global Nanocoatings Market in Automotive, By Region,2012�2019 (T)
Table 33 Global Nanocoatings Market in Energy, By Region, 2012�2019 ($ Million)
Table 34 Global Nanocoatings Market in Energy, By Region,2012�2019 (T)
Table 35 Global Nanocoatings Market in Other Applications, By Region, 2012�2019 ($ Million)
Table 36 Global Nanocoatings Market in Other Applications, By Region,2012�2019 (T)
Table 37 Nanocoatings Market Size , By Region , 2012�2019 ($Million)
Table 38 Nanocoatings Market Size , By Region , 2012�2019 (Tons)
Table 39 Nanocoatings Market Size in North America, By Country, 2012�2019 ($Million)
Table 40 Market Size in North America, By Country, 2012�2019 (Tons)
Table 41 Market Size in North America, By Application, 2012�2019 ($Million)
Table 42 Market Size in North America, By Application, 2012�2019 (Tons)
Table 43 Market Size in North America, By Type, 2012�2019 ($Million)
Table 44 Market Size in North America, By Type, 2012�2019 (Tons)
Table 45 Nanocoatings Market Size in U.S., By Application, 2012�2019 ($Million)
Table 46 Market Size in U.S., By Application, 2012�2019 (Tons)
Table 47 Market Size in U.S., By Type, 2012�2019 ($Million)
Table 48 Market Size in U.S., By Type, 2012�2019 (Tons)
Table 49 Nanocoatings Market Size in Canada, By Application, 2012�2019 ($Million)
Table 50 Market Size in Canada, By Application, 2012�2019 (Tons)
Table 51 Market Size in Canada, By Type, 2012�2019 ($Million)
Table 52 Market Size in Canada, By Type, 2012�2019 (Tons)
Table 53 Nanocoatings Market Size in Mexico, By Application, 2012�2019 ($Million)
Table 54 Market Size in Mexico, By Application, 2012�2019 (Tons)
Table 55 Market Size in Mexico, By Type, 2012�2019 ($Million)
Table 56 Market Size in Mexico, By Type, 2012�2019 (Tons)
Table 57 Nanocoatings Market Size in Asia-Pacific, By Country, 2012�2019 ($Million)
Table 58 Market Size in Asia-Pacific, By Country, 2012�2019 (Tons)
Table 59 Market Size in Asia-Pacific, By Application, 2012�2019 ($Million)
Table 60 Nanocoatings Market Size in Asia-Pacific, By Application, 2012�2019 (Tons)
Table 61 Market Size in Asia-Pacific, By Type, 2012�2019 ($Million)
Table 62 Market Size in Asia-Pacific, By Type, 2012�2019 (Tons)
Table 63 Nanocoatings Market Size in China, By Application, 2012�2019 ($Million)
Table 64 Market Size in China, By Application, 2012�2019 (Tons)
Table 65 Market Size in China, By Type, 2012�2019 ($Million)
Table 66 Market Size in China, By Type, 2012�2019 (Tons)
Table 67 Nanocoatings Market Size in Japan, By Application, 2012�2019 ($Million)
Table 68 Market Size in Japan, By Application, 2012�2019 (Tons)
Table 69 Market Size in Japan, By Type, 2012�2019 ($Million)
Table 70 Market Size in Japan, By Type, 2012�2019 (Tons)
Table 71 Nanocoatings Market Size in South Korea, By Application, 2012�2019 ($Million)
Table 72 Market Size in South Korea, By Application, 2012�2019 (Tons)
Table 73 Market Size in South Korea, By Type, 2012�2019 ($Million)
Table 74 Market Size in South Korea, By Type, 2012�2019 (Tons)
Table 75 Nanocoatings Market Size in India, By Application, 2012�2019 ($Million)
Table 76 Size in India, By Application, 2012�2019 (Tons)
Table 77 Size in India, By Type, 2012�2019 ($Million)
Table 78 Size in India, By Type, 2012�2019 (Tons)
Table 79 Nanocoatings Market Size in Other Countries of Asia-Pacific, By Application, 2012�2019 ($Million)
Table 80 Size in Other Countries of Asia-Pacific, By Application, 2012�2019 (Tons)
Table 81 Size in Other Countries of Asia-Pacific, By Type, 2012�2019 ($Million)
Table 82 Size in Other Countries of Asia-Pacific, By Type, 2012�2019 (Tons)
Table 83 Size in Europe, By Country, 2012�2019 ($Million)
Table 84 Nanocoatings Market Size in Europe, By Country, 2012�2019 (Tons)
Table 85 Size in Europe, By Application, 2012�2019 ($Million)
Table 86 Size in Europe, By Application, 2012�2019 (Tons)
Table 87 Size in Europe, By Type, 2012�2019 ($Million)
Table 88 Size in Europe, By Type, 2012�2019 (Tons)
Table 89 Nanocoatings Market Size in Germany, By Application, 2012�2019 ($Million)
Table 90 Size in Germany, By Application, 2012�2019 (Tons)
Table 91 Size in Germany, By Type, 2012�2019 ($Million)
Table 92 Size in Germany, By Type, 2012�2019 (Tons)
Table 93 Nanocoatings Market Size in France, By Application, 2012�2019 ($Million)
Table 94 Size in France, By Application, 2012�2019 (Tons)
Table 95 Size in France, By Type, 2012�2019 ($Million)
Table 96 Size in France, By Type, 2012�2019 (Tons)
Table 97 Nanocoatings Market Size in U.K., By Application, 2012�2019 ($Million)
Table 98 Nanocoatings Market Size in U.K., By Application, 2012�2019 (Tons)
Table 99 Nanocoatings Market Size in U.K., By Type, 2012�2019 ($Million)
Table 100 Nanocoatings Market Size in U.K., By Type, 2012�2019 (Tons)
Table 101 Nanocoatings Market Size in Other European Countries, By Application, 2012�2019 ($Million)
Table 102 Nanocoatings Market Size in Other European Countries, By Application, 2012�2019 (Tons)
Table 103 Nanocoatings Market Size in Other European Countries, By Type, 2012�2019 ($Million)
Table 104 Nanocoatings Market Size in Other European Countries, By Type, 2012�2019 (Tons)
Table 105 Nanocoatings Market Size in ROW, By Country, 2012�2019 ($Million)
Table 106 Nanocoatings Market Size in ROW, By Country, 2012�2019 (Tons)
Table 107 Nanocoatings Market Size in ROW, By Application, 2012�2019 ($Million)
Table 108 Nanocoatings Market Size in ROW, By Application, 2012�2019 (Tons)
Table 109 Nanocoatings Market Size in ROW, By Type, 2012�2019 ($Million)
Table 110 Nanocoatings Market Size in ROW, By Type, 2012�2019 (Tons)
Table 111 Nanocoatings Market Size in South America, By Application, 2012�2019 ($Million)
Table 112 Nanocoatings Market Size in South America, By Application, 2012�2019 (Tons)
Table 113 Nanocoatings Market Size in South America, By Type, 2012�2019 ($Million)
Table 114 Nanocoatings Market Size in South America, By Type, 2012�2019 (Tons)
Table 115 Nanocoatings Market Size in GCC Countries, By Application, 2012�2019 ($Million)
Table 116 Nanocoatings Market Size in GCC Countries, By Application, 2012�2019 (Tons)
Table 117 Nanocoatings Market Size in GCC Countries, By Type, 2012�2019 ($Million)
Table 118 Nanocoatings Market Size in GCC Countries, By Type, 2012�2019 (Tons)
Table 119 Nanocoatings Market Size in Africa, By Application, 2012�2019 ($Million)
Table 120 Nanocoatings Market Size in Africa, By Application, 2012�2019 (Tons)
Table 121 Nanocoatings Market Size in Africa, By Type, 2012�2019 ($Million)
Table 122 Nanocoatings Market Size in Africa, By Type, 2012�2019 (Tons)
Table 123 Nanocoatings Market Size in Other Countries of ROW, By Application, 2012�2019 ($Million)
Table 124 Nanocoatings Market Size in Other Countries of ROW, By Application, 2012�2019 (Tons)
Table 125 Nanocoatings Market Size in Other Countries of ROW, By Type, 2012�2019 ($Million)
Table 126 Nanocoatings Market Size in Other Countries of ROW, By Type, 2012�2019 (Tons)
List of Figures (70 Figures)
Figure 1 Nano-Coatings Market Segmentation
Figure 2 Research Methodology
Figure 3 Nanocoatings Production Facilities Concentration,2013
Figure 4 Market Size Estimation Methodology: Bottom-Up Approach
Figure 5 Market Size Estimation Methodology: Top-Down Approach
Figure 6 Primary Split
Figure 7 Data Triangulation
Figure 8 Global Nanocoatings Penetration Level of Countries, Market Size ($Billion)
Figure 9 Other Types of Nanocoatings is the Growing Market
Figure 10 Global Nanocoatings Market Size, By Fast-Growing Regions ($Million)
Figure 11 Global Nanocoatings Market Size ($Billion)
Figure 12 Most of the Countries With High CAGR Are From Asia-Pacific
Figure 13 Construction Accounts for the Largest Application Market for Nanocoatings By Value
Figure 14 Healthcare is the Fastest Growing Among Applications and Asia-Pacific is the Fastest Growing Region for Nanocoatings
Figure 15 Different Types of Nanocoatings to Register A High Demand in Asia-Pacific
Figure 16 Market Segmentation of Nanocoatings, By Type
Figure 17 Market Segmentation of Nanocoatings, By Application
Figure 18 Market Segmentation of Nanocoatings, By Region
Figure 19 Performance Benefits Along With Rise in Commercial Activities is Driving the Market for Nanocoatings
Figure 20 Rise in World Population Driving the Nanocoatings Market Indirectly
Figure 21 Value Chain Analysis (2013) : Direct Distribution is the Most Preferred Strategy Followed By Most of the Players
Figure 22 Porter�s Five Forces Analysis (2013): Medium Threat From Substitutes & Medium Entry Barriers Leading to High Growth
Figure 23 Nanocoatings : Market Life Cycle Analysis By Region
Figure 24 Self-Cleaning (Bionic & Photocatalytic) Have the Largest Market Size in the Nanocoatings Market (2014-2019)
Figure 25 Asia-Pacific the Fastest Growing Market for Anti-Fingerprint Nanocoatings (2014-2019)
Figure 26 Europe Followed By North America Lead the Anti-Microbial Nanocoatings Market (2014-2019)
Figure 27 North America Largest Market for Easy-To-Clean & Anti-Fouling Nanocoatings (2014-2019)
Figure 28 Asia Pacific Forecasted to Become the Largest Market for Self-Cleaning Nanocoatings By 2019
Figure 29 North America to Remain the Largest Market for Other Types of Nanocoatings During 2014-2019
Figure 30 Construction the Largest Share of the Nanocoatings Market (2014-2019)
Figure 31 Rise in Healthcare Expenditure Driving the Growth of Nanocoatings Market (2014-2019)
Figure 32 Asia-Pacific is Anticipated to the Show the Highest Growth for Nanocoatings in Marine Industry (2014-2019)
Figure 33 Nanocoatings Market in Water Treatment Equipment to Grow Fastest in Asia-Pacific (2014-2019)
Figure 34 Asia-Pacific Holds the Major Share for the Nanocoatings Market in Electronics (2014-2019)
Figure 35 Factors Leading to the Growth of Nanocoatings in the Construction Sector in Various Regions (2014-2019)
Figure 36 Asia-Pacific Leading the Nanocoatings Market in the Automotive Sector, By Volume(2014-2019)
Figure 37 Regions Depicting Growth of Nanocoatings in the Energy Sector, By Value(2014-2019)
Figure 38 Other Application Areas for Nanocoatings Market
Figure 39 Regions Depicting Growth of Nanocoatings in Other Applications, By Value (2014-2019)
Figure 40 Countries in Asia-Pacific Are Projected to Lead the Growth ($Million) Between 2014-2019
Figure 41 Construction, Food & Packaging and Healthcare Are Dominant Applications With Significant Growth Opportunities Between 2014-2019
Figure 42 Anti-Microbial and Easy-To-Clean & Anti-Fouling Asia-Pacific Between 2014-2019
Figure 43 China is Projected to Become the Second Largest Market of Nanocoatings and Japan to Enter in Top Five By 2019
Figure 44 Key Companies Preferred Expansions & Investments Strategy Over the Last Four Years
Figure 45 Nanogate AG Company Grew at the Fastest Rate Between 2010-2014
Figure 46 Nano-Coatings Market Developments, By Key Players, 2010-2014
Figure 47 Expansions & Investments Fueled Growth and Innovation Between 2010-2014
Figure 48 Battle for Market Share: Expansions & Investments Was the Key Strategy
Figure 49 Geographic Revenue Mix of Top 4 Market Players
Figure 50 Buhler AG: Business Overview
Figure 51 SWOT Analysis
Figure 52 Nanogate: Business Overview
Figure 53 Nanophase: Business Overview
Figure 54 SWOT Analysis
Figure 55 Bio-Gate: Business Overview
Figure 56 SWOT Analysis
Figure 57 ADMAT Innovations
Figure 58 Surfix BV Advanced Nanocoatings : Business Overview
Figure 59 Nanomech Inc : Business Overview
Figure 60 EIKOS: Business Overview
Figure 61 CIMA: Business Overview
Figure 62 Telsa: Business Overview
Figure 63 CG2: Business Overview
Figure 64 Inframat Corporation: Business Overview
Figure 65 SWOT Analysis
Figure 66 P2I Ltd: Business Overview
Figure 67 Integran Technologies: Business Overview
Figure 68 Nanovere Technologies LLC: Business Overview
Figure 69 Nanofilm: Business Overview
Figure 70 Nano-Care: Business Overview


Growth opportunities and latent adjacency in Nanocoatings Market