North America Well Completion Equipment & Services Market by Type (Packers, Sand Control Tools, Multi-stage Fracturing Tools, Liner Hangers, Smart Wells, Safety Valves, and Other), by Application & by Country - Trends & Forecast to 2019


[172 Pages Report] The shale gas boom coupled with growing demand of energy with increasing drilling activities in offshore and unconventional exploration and production activities is expected to drive the North America completion equipment and services market. It is estimated to reach $5.27 billion by 2019, at CAGR of 2.5% from 2014 to 2019. Latest and highly advanced technology is required in the U.S. Gulf of Mexico and Canada. High growth in deepwater and ultra deepwater explorations in these regions is expected to push the demand for completion equipment and services market in North America.
Completion equipment and services are well completion technologies used for packing, sand controlling, many such other purposes. Completion services include performing casing, cementing, perforating, gravel packing, and installing a production tree for the well to start production. It is also important to identify whether the hole should be plugged and abandoned as a dry hole. These completion activities require different kinds of equipment for performing the above mentioned services. With technological developments impacting this market, various new technologies such as sensors for measuring flow properties that includes rate, pressure and gas-to-oil ratio known as smart wells has been on the rise.
Completion equipment and services are provided by oilfield service companies such as Halliburton (U.S.), Schlumberger (U.S.), and Baker Hughes (U.S.) and oil & gas companies such as Shell (The Netherlands).
The completion equipment and services market is the largest in North America as compared to the global completion equipment and services market. Leading oil field service companies�Schlumberger (U.S.), Halliburton (U.S.), Baker Hughes (U.S.) and other medium and small players�operate in North America.
North America Completion Equipment & Services Market Value, 2014-2019 ($Million)
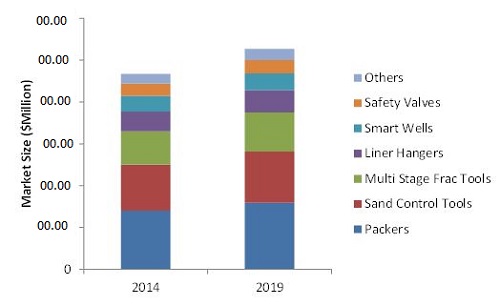
Source: MarketsandMarkets Analysis
For this report, the major players in North American market have been identified through secondary and primary research, based on which their market shares have been evaluated. This includes a study of the annual reports of top market players and interviews with key opinion leaders such as CEOs, Directors, and marketing people.
The size of the overall market is determined by forecast techniques based on the completion equipment and services demand in North America, which has been validated through primary sources. The market revenue for various types of North America completion equipment and services has been determined and evaluated using primary and secondary research. The data for this market is provided from 2012 to 2019, with CAGR calculated from 2014 to 2019.
This report analyzes various marketing trends and establishes the most effective growth strategy. It identifies market dynamics such as drivers, opportunities, burning issues, and winning imperatives. Major companies such as Schlumberger (U.S.), Halliburton (U.S.), Baker Hughes (U.S.), and Weatherford (Switzerland) have also been profiled in this report.
Get online access to the report on the World's First Market Intelligence Cloud
Request Sample Scope of the Report
:

On the basis of service types:
- Packers
- Sand Control tools
- Multi stage fracturing tools
- Liner Hangers
- Smart wells
- Safety valves
- Others (Wireline Conveyed Perforation (WCP) and Tubing Conveyed Perforation (TCP))
On the basis of application:
- Onshore
- Offshore
On the basis of country:
- U.S.
- Canada
- Mexico
North America Completion Equipment & Services market: Expected to reach $5.27 billion market by 2019, signifying a firm annualized growth rate of 2.5% from 2014 to 2019.
Completion equipment and services are used for a wide range of purposes after the drilling of well is carried out. Completion equipment and services are precisely used for converting a drilled well into a producing one. Completion includes various stages before the well starts production; these include casing, cementing, perforating, gravel packing, and installation of a production tree. In this report, the market has been analyzed on the basis of revenue generated by the completion equipment and services supplied by oilfield service companies to the oilfield services market in North America. Major value generation activities of the market are recorded in North America and the other regions are growing at a higher growth rate with the exploration of new reserves, creating growth prospects for the completion equipment and services market. The North American market is reaching towards maturity and the movement in the market would mainly be subjected to competition.
Rise in deepwater and ultra deepwater discoveries, with high growth in exploration and production, activities are the most important drivers for the completion equipment and services market in North America. Equipment and services are used for the completion of well for oil and natural gas, while these services are necessary for any type of well to complete it and put it on production. Currently, natural gas is referred to as transitional fuel between conventional resources and renewable energy. This proves to be an advantage to the international natural gas market, and hence to the completion equipment and services market in North America. As the energy demand in developing countries such as India and Brazil is increasing, fulfilling this demand would push growth prospects for completion equipment and services market. Drilling activities in countries such as Canada and Mexico are expected to propel growth in the North America completion equipment market.
The growth of completion equipment and services market depends on many reasons including environmental ones, which is an important hurdle for the growth of this market. The North American region has both natural resources as well as technology, to make production of hydrocarbons viable. Moreover, the presence of major players in the market also makes implementation of technology at the production site economical.
North America Completion Equipment & Services Market Value, by Country, 2012-2019
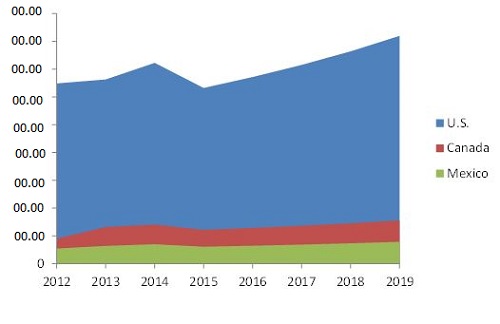
Source: MarketsandMarkets Analysis
North America dominates the completion equipment and services market. This dominance is seen mainly due to continuous and large increment in the U.S. exploration and production activities. North America has the highest market share of over 50% in the global completion equipment and services market during the forecast period, because of favorable regulations in the region. The U.S. region is expected to dominate the North America completion equipment and services market in the next five years.
Table of Contents
1 Introduction (Page No. - 15)
1.1 Objectives of the Study
1.2 Market Definition
1.3 Market Scope
1.3.1 Markets Covered
1.3.2 Years Considered for the Study
1.3.3 Currency & Pricing
1.4 Limitations
1.5 Stakeholders
2 Research Methodology (Page No. - 18)
2.1 Research Data
2.1.1 Secondary Data
2.1.1.1 Key Data From Secondary Sources
2.1.2 Primary Data
2.1.2.1 Key Data From Primary Sources
2.1.2.2 Key Industry Insights
2.1.2.3 Breakdown of Primary Interviews
2.2 Factor Analysis for North America Well Completion Equipment & Services Market
2.2.1 Demand-Side Analysis
2.2.1.1 Increasing Number of Horizontal Wells in the U.S.
2.2.2 Supply-Side Analysis
2.3 Market Size Estimation
2.3.1 Bottom-Up Approach
2.3.2 Top-Down Approach
2.4 Market Breakdown & Data Triangulation
2.5 Market Share Estimation
2.6 Assumptions
3 Executive Summary (Page No. - 28)
4 Premium Insights (Page No. - 34)
4.1 Attractive Opportunities in the North America Well Completion Equipment & Services Market
4.2 Well Completion Equipment & Services Market is Equally Dispersed
4.3 North America Well Completion Equipment & Services Market
4.4 North America Well Completion Equipment & Services Market, By Type
4.5 Well Completion Equipment & Services Market, By Application
4.6 Life Cycle Analysis, By Region
5 Market Overview (Page No. - 40)
5.1 Introduction
5.2 Market Segmentation
5.2.1 By Type
5.2.1.1 Packers
5.2.1.2 Sand Control Tools
5.2.1.3 Multi-Stage Fracturing Tools
5.2.1.4 Liner Hangers
5.2.1.5 Smart Wells
5.2.1.6 Safety Valves
5.2.1.7 Others
5.2.2 By Application
5.3 Market Dynamics
5.3.1 Drivers
5.3.1.1 Increase in the Number of Horizontal Wells in the U.S.
5.3.1.2 Increase in Oil & Shale Gas Production Per Rig in the U.S. Despite of the Decrease in Crude Oil Prices
5.3.1.3 Rise in Investment in the Exploration & Production Activities in North America
5.3.2 Restraints
5.3.2.1 Environmental Constraints in the Process of Well Completion
5.3.3 Opportunities
5.3.3.1 Oil Prices Projected to Increase Up Till 2025
5.3.3.2 Opportunities for Investments in the U.S. & Canadian Crude Oil Industry
5.3.4 Challenges
5.3.4.1 Current Low Oil Prices Carry Geopolitical Consequences
5.3.4.2 High Pressure, High Temperature Completion Challenges
5.4 Winning Imperative
5.4.1 Crude Oil Production & Prices Expected to Increase Till 2025
5.5 Impact Analysis
6 Industry Trends (Page No. - 52)
6.1 Introduction
6.2 Supply Chain Analysis
6.2.1 Key Influencers
6.2.1.1 Equipment Manufacturers
6.2.1.2 Prominent Companies
6.2.1.3 Service Providers
6.2.1.4 End-Users
6.3 Porter�s Five Forces Analysis
6.3.1 Threat of New Entrants
6.3.2 Threat of Substitutes
6.3.3 Bargaining Power of Suppliers
6.3.4 Bargaining Power of Buyers
6.3.5 Intensity of Competitive Rivalry
7 Well Completion Equipment & Services Market, Buying Behavior Analysis (Page No. - 57)
7.1 Buying Parameters & Definitions/Explanations
7.1.1 Parameters Affecting Buying Behavior: Global Perspective
7.1.2 Parameters Affecting Buying Behavior: Regional Perspective
7.1.2.1 North America
7.2 Buying Behavior: Segmented By Product/Service Type
7.2.1 Parameters Affecting Buying Behavior for Services
7.2.2 Completion Equipment Services: Parameters Impacting Buying Behavior
7.2.2.1 Packers
7.2.2.2 Sand Control Services
7.2.2.3 Multi-Stage Fracturing Services
7.2.2.4 Liner Hangers
7.2.2.5 Smart Wells & Safety Valves
7.3 Buying Behavior: Segmented By Company Type
8 North America Well Completion Equipment & Services, By Type (Page No. - 65)
8.1 Introduction
8.2 North America Well Completion Equipment & Services Market, By Type
8.2.1 Packers
8.2.2 Sand Control Tools
8.2.2.1 By Type
8.2.2.2 By Application
8.2.2.2.1 North America Onshore Sand Control Systems, Market
8.2.2.2.2 North America Offshore Sand Control Systems, Market
8.2.2.3 By Country
8.2.3 Gravel Pack Systems
8.2.3.1 Frac Pack Systems
8.2.3.2 Sand Screens
8.2.3.3 Inflow Control Devices
8.2.3.4 Others
8.2.4 Multi-Stage Fracturing Tools
8.2.5 Liner Hangers
8.2.6 Smart Wells
8.2.7 Safety Valves
8.2.8 Other Well Completion Equipment & Services
9 North America Well Completion Equipment & Services, By Application (Page No. - 93)
9.1 Introduction
9.2 Onshore Well Completion Equipment & Services Market
9.3 Offshore Well Completion Equipment & Services Market
9.3.1 By Depth
9.4 North America Well Completion Equipment & Services Market
9.4.1 Onshore
9.4.2 Offshore
10 North America Well Completion Equipment & Services, By Country (Page No. - 103)
10.1 Introduction
10.2 Regional Analysis of the Well Completion Equipment & Services Market
10.3 North America Well Completion Equipment & Services Market
10.3.1 U.S.
10.3.1.1 By Type
10.3.1.2 By Application
10.3.2 Canada
10.3.2.1 By Type
10.3.2.2 By Application
10.3.3 Mexico
10.3.3.1 By Type
10.3.3.2 By Application
11 Competitive Landscape (Page No. - 112)
11.1 Overview
11.2 Market Share Analysis, By Key Players
11.2.1 Competitive Situation & Trends
11.3 Contracts & Agreements
11.4 New Product Launches
11.5 Expansions
11.6 Mergers & Acquisitions
12 Company Profiles (Page No. - 120)
(Company at A Glance, Recent Financials, Products & Services, Strategies & Insights, & Recent Developments)*
12.1 Introduction
12.2 Baker Hughes Incorporated
12.3 Halliburton
12.4 Weatherford International
12.5 Schlumberger Ltd.
12.6 Packers Plus Energy Services Inc.
12.7 National Oilwell Varco
12.8 Nabors Industries Ltd.
12.9 Trican Well Service Ltd.
12.10 RPC Inc.
12.11 Superior Energy Services Inc.
12.12 Welltec as
12.13 FTS International.
12.14 Nine Energy Services Inc.
12.15 NCS Multistage
*Details on Company at A Glance, Recent Financials, Products & Services, Strategies & Insights, & Recent Developments Might Not Be Captured in Case of Unlisted Companies.
13 Appendix (Page No. - 163)
13.1 Insights of Industry Experts
13.2 Other Developments
13.3 Discussion Guide
13.4 Available Customizations
13.5 Introducing RT: Real Time Market Intelligence
13.6 Related Reports
List of Tables (66 Tables)
Table 1 Impact Analysis of Market Dynamics
Table 2 Well Completion Equipment & Services Market Size, By Type, 2012�2019 ($Million)
Table 3 North America Well Completion Equipment & Services Market Size, By Type, 2012�2019 ($Million)
Table 4 Year-On-Year Growth for North America Well Completion Equipment & Services Market Size, By Type
Table 5 Packers Equipment & Services Market Size, By Region, 2012�2019 ($Million)
Table 6 Packers Equipment & Services Market Size, By Country, 2012�2019 ($Million)
Table 7 U.S. Packers Equipment & Services Market Size, By Application, 2012�2019 ($Million)
Table 8 Canada Packers Equipment & Services Market Size, By Application, 2012�2019 ($Million)
Table 9 Mexico Packers Equipment & Services Market Size, By Application, 2012�2019 ($Million)
Table 10 Sand Control Tools Equipment & Services Market Size, By Region, 2012�2019 ($Million)
Table 11 North America: Sand Control Systems Market Size, By Type, 2012�2019 ($Million)
Table 12 North America: Sand Control Systems Market Size, By Application, 2012�2019 ($Million)
Table 13 North America: Onshore Sand Control Systems Market Size, By Country, 2012�2019 ($Million)
Table 14 North America: Offshore Sand Control Systems Market Size, By Country, 2012�2019 ($Million)
Table 15 North America: Sand Control Tools Equipment & Services Market Size, By Country, 2012�2019 ($Million)
Table 16 U.S.: Sand Control Systems Market Size, By Type, 2012�2019 ($Million)
Table 17 U.S.: Sand Control Systems Market Size, By Application, 2012�2019 ($Million)
Table 18 Canada: Sand Control Systems Market Size, By Type, 2012�2019 ($Million)
Table 19 Canada: Sand Control Systems Market Size, By Application, 2012�2019 ($Million)
Table 20 Mexico: Sand Control Systems Market Size, By Type, 2012�2019 ($Million)
Table 21 Mexico: Sand Control Systems Market Size, By Application, 2012�2019 ($Million)
Table 22 Gravel Pack Market Size, By Region, 2012�2019 ($Million)
Table 23 North America: Gravel Pack Market Size, By Country, 2012�2019 ($Million)
Table 24 Frac Pack Market Size, By Region, 2012�2019 ($Million)
Table 25 North America: Frac Pack Market Size, By Country, 2012�2019 ($Million)
Table 26 Sand Screens Market Size, By Region, 2012�2019 ($Million)
Table 27 North America: Sand Screens Market Size, By Country, 2012�2019 ($Million)
Table 28 Inflow Control Devices Market Size, By Region, 2012�2019 ($Million)
Table 29 North America: Inflow Control Devices Market Size, By Country, 2012�2019 ($Million)
Table 30 Other Sand Control Systems Market Size, By Region, 2012�2019 ($Million)
Table 31 North America: Other Sand Control Systems Market Size, By Country, 2012�2019 ($Million)
Table 32 Multi-Stage Fracturing Tools Equipment & Services Market Size, By Region, 2012�2019 ($Million)
Table 33 Multi-Stage Fracturing Tools Well Completion Equipment & Services Market Size, By Country, 2012�2019 ($Million)
Table 34 Liner Hangers Well Completion Equipment & Services Market Size, By Region, 2012�2019 ($Million)
Table 35 Liner Hangers Well Completion Equipment & Services Market Size, By Country, 2012�2019 ($Million)
Table 36 Smart Wells Well Completion Equipment & Services Market Size, By Region, 2012�2019 ($Million)
Table 37 Smart Wells Well Completion Equipment & Services Market Size, By Country, 2012�2019 ($Million)
Table 38 Safety Valves Well Completion Equipment & Services Market Size, By Region, 2012�2019 ($Million)
Table 39 Safety Valves Well Completion Equipment & Services Market Size, By Country, 2012�2019 ($Million)
Table 40 Other Well Completion Equipment & Services Market Size, By Region, 2012�2019 ($Million)
Table 41 Other Well Completion Equipment & Services Market Size, By Country, 2012�2019 ($Million)
Table 42 Well Completion Equipment & Services Market Size, By Application, 2012�2019 ($Million)
Table 43 Onshore Well Completion Equipment & Services Market Size, By Region, 2012�2019 ($Million)
Table 44 Offshore Well Completion Equipment & Services Market Size, By Region, 2012�2019 ($Million)
Table 45 Offshore Well Completion Equipment & Services Market Size, By Depth, 2012�2019 ($Million)
Table 46 Shallow Water Well Completion Equipment & Services Market Size, By Region, 2012�2019 ($Million)
Table 47 Deep-water Well Completion Equipment & Services Market Size, By Region, 2012�2019 ($Million)
Table 48 Ultra-Deep-water Well Completion Equipment & Services Market Size, By Region, 2012�2019 ($Million)
Table 49 North America Well Completion Equipment & Services Market Size, By Depth, 2012�2019 ($Million)
Table 50 North America Well Completion Equipment & Services Market Size, By Application, 2012�2019 ($Million)
Table 51 North America Onshore Well Completion Equipment & Services Market Size, By Country, 2012�2019 ($Million)
Table 52 North America Onshore Well Completion Equipment & Services Market Size, By Type, 2012�2019 ($Million)
Table 53 North America Offshore Well Completion Equipment & Services Market Size, By Type, 2012�2019 ($Million)
Table 54 North America Offshore Well Completion Equipment & Services Market Size, By Application, 2012�2019 ($Million)
Table 55 Well Completion Equipment & Services Market Size, By Region, 2012�2019 ($Million)
Table 56 North America: Well Completion Equipment & Services Market Size, By Country, 2012�2019 ($Million)
Table 57 U.S.: Well Completion Equipment & Services Market Size, By Type, 2012�2019 ($Million)
Table 58 U.S.: Well Completion Equipment & Services Market Size, By Application, 2012�2019 ($Million)
Table 59 Canada: Well Completion Equipment & Services Market Size, By Type, 2012�2019 ($Million)
Table 60 Canada: Well Completion Equipment & Services Market Size, By Application, 2012�2019 ($Million)
Table 61 Mexico: Well Completion Equipment & Services Market Size, By Type, 2012�2019 ($Million)
Table 62 Mexico: Well Completion Equipment & Services Market Size, By Application, 2012�2019 ($Million)
Table 63 Contracts & Agreements, 2010�2014
Table 64 New Product Launches, 2011�2014
Table 65 Expansions, 2012�2013
Table 66 Mergers & Acquisitions, 2012�2013
List of Figures (63 Figures)
Figure 1 North America Well Completion Equipment & Services, By Segments
Figure 2 Research Design
Figure 3 Increase in Horizontal Well Completion in North America
Figure 4 Oil Prices Projected to Increase Up to 2025
Figure 5 Market Size Estimation Methodology: Bottom-Up Approach
Figure 6 Market Size Estimation Methodology: Top-Down Approach
Figure 7 Data Triangulation
Figure 8 Well Completion Equipment & Services Geographic Market Snapshot (2014 vs. 2019)
Figure 9 North America Well Completion Equipment & Services Market Snapshot (2014 vs. 2019)
Figure 10 North American Well Completion Equipment & Services Market Size, By Type, 2014 ($Million)
Figure 11 U.S. Well Completion Equipment & Services Market Size, By Equipment Type, 2014 ($Million)
Figure 12 North American Well Completion Equipment & Services Market Share (Value), By Country, 2013
Figure 13 Offshore to Grow at the Highest Rate During the Forecast Period in North America
Figure 14 Increasing Production Activities Driving the Well Completion Equipment & Services Market
Figure 15 North America Well Completion Equipment & Services Market is Expected to Grow at A Slower Rate in the Forecast Period
Figure 16 Onshore Application Had the Major Share in the North American Market, 2013
Figure 17 Packers Will Continue to Dominate the Well Completion Equipment & Services Market in North America
Figure 18 Offshore Application is Expected to Grow at A Higher Rate in the Well Completion Equipment & Services Market
Figure 19 Shale Boom to Trigger the U.S. Market
Figure 20 Well Completion Equipment & Services Market Segmentation
Figure 21 Increase in Oil & Shale Gas Production Per Rig Drive the Well Completion Equipment & Services Market in North America
Figure 22 Number of Horizontal Wells in the U.S. (2010�2014)
Figure 23 Oil Production Per Rig (BBL/D) (February 2014-February 2015)
Figure 24 Shale Gas Production Per Rig (MCF/D) (February 2014-February 2015)
Figure 25 Investments in Exploration & Production (2013�2014)
Figure 26 Total Water Used for Completion of Fracking Wells Since 2005
Figure 27 Well Completion Equipment & Services Market: Supply Chain
Figure 28 Well Completion Equipment & Services Market: Porter�s Five Force Analysis
Figure 29 Factors Influencing the Buying Behavior
Figure 30 Parameters Affecting the Buying Behavior for Services
Figure 31 Buying Behavior, By Company Type
Figure 32 Packers & Sand Control Tools Will Acquire Majority of the Global Well Completion Equipment & Services Market By 2019
Figure 33 Packers Dominate the North America Well Completion Equipment & Services Market During the Forecast Period
Figure 34 Packers Equipment & Services Market Size, By Region, 2014�2019, ($Million)
Figure 35 U.S. to Demand More Number of Packers During the Forecast Period
Figure 36 U.S. is the Biggest & Fastest Growing Market in the North American Continent
Figure 37 Onshore Applications Dominate the Global Well Completion Equipment & Services Market
Figure 38 North America & Asia-Pacific Are Expected to Hold Major Share of Offshore Well Completion Equipment & Services
Figure 39 North America is Expected to Dominate the Well Completion Equipment & Services Market During the Forecast Period
Figure 40 U.S. Will Demand Most of the Well Completion Equipment & Services in During the Forecast Period
Figure 41 U.S. & Canada Are the Key Countries Contributing to Majority of Well Completion Equipment & Services Market
Figure 42 Companies Adopted New Contracts & Agreements as the Key Growth Strategy From 2010�2014
Figure 43 North America Well Completion Equipment & Services Market, By Major Market Players, 2013
Figure 44 Battle for Market Share: Contracts & Agreements is the Key Strategy
Figure 45 Baker Hughes Incorporated: Business Overview
Figure 46 Baker Hughes Incorporated: SWOT Analysis
Figure 47 Halliburton : Business Overview
Figure 48 Halliburton: SWOT Analysis
Figure 49 Weatherford International: Business Overview
Figure 50 Weatherford: SWOT Analysis
Figure 51 Schlumberger Ltd.: Business Overview
Figure 52 Schlumberger Ltd.: SWOT Analysis
Figure 53 Packers Plus Energy Services Inc.: Business Overview
Figure 54 Packers Plus Energy Services Inc.: SWOT Analysis
Figure 55 National Oil well Varco: Business Overview
Figure 56 Nabors Industries Ltd.: Business Overview
Figure 57 Trican Well Service Ltd.: Business Overview
Figure 58 RPC Inc.: Business Overview
Figure 59 Superior Energy Services Inc.: Business Overview
Figure 60 Welltec As: Business Overview
Figure 61 FTS International: Business Overview
Figure 62 Nine Energy Services Inc.: Business Overview
Figure 63 NCS Multistage: Business Overview


Growth opportunities and latent adjacency in North America Well Completion Equipment & Services Market