North America Injectable Drug Delivery Market � by Formulations [Liposomes, Microspheres, & Nanoparticles], Devices [Disposables & Reusable, Fillable & Prefilled, Pen, Needle Free & Auto Injectors] & Therapeutics [Diabetes & Oncology] � Forecasts to 2017


The North American injectable drug delivery technologies market was valued at $9.3 billion in 2012; it is expected to reach $16.6 billion by 2017 at a CAGR of 12.3% from 2012 to 2017. Injectable drug delivery technologies are the combination of two major segments; devices and formulations. The North American injectable drug delivery formulations technologies market was the largest segment in this market. In addition, the market is segmented on the basis of its therapeutic applications. In therapeutic area, hormonal disorders command the major segment of injectable drug delivery technologies market due to high demand of injectable in treatment of diabetes. However, auto-immune diseases are the fastest growing segment of this market due to the advent of biologics (tumor necrosis factor (TNF) and Interleukin 1 (IL-1)) and improving patient compliance by the development of self injection devices.
The major markets covered in this report are United States and Canada. The United States accounted for the largest market of the North American injectable drug delivery technologies market in the year 2012. However, Canada is expected to witness high growth due to growing prevalence of diabetes and autoimmune diseases such as multiple sclerosis and rheumatoid arthritis, increase in approval of injectable formulation and device, favorable reimbursement and rise in injectable cosmetic treatments.
The growth of the injectable drug delivery technologies market is driven by factors such as innovations in injectable drug delivery devices, rising prevalence of diabetes in the U.S. and Canada, improving patient compliance and rise in partnerships, collaborations and acquisitions among prominent players in this market. However, factors such as product recalls, regulatory hurdles for approval of new device sand formulations and needle-stick injuries and infections, are restraining the growth of the market.
Get online access to the report on the World's First Market Intelligence Cloud
Request Sample Scope of the Report

This research report categorizes and analyzes the North American injectable drug delivery technologies market under two broad segments - devices and formulations. Both of these markets are broken down into segments and sub-segments, providing exhaustive value analysis for the years 2010, 2011, 2012, and forecast to 2017. Furthermore, due to wide range of applications of injectable drug delivery technologies in varied therapeutic areas, the market is segmented into five categories, namely; auto immune diseases, hormonal imbalances, oncology, orphan/rare diseases (Hemophilia, Ribose-5-phosphate isomerase deficiency (RPI deficiency), Cystic Fibrosis, Wilson�s Disease) and others (pain management, allergies, hepatitis C, and aesthetic treatment). Each market is comprehensively analyzed at a granular level by country (United States and Canada) to provide in-depth information on the North American scenario.
Injectable Drug Delivery Technologies Market, By Segment
- Injectable Drug Delivery Devices Technologies
- Injectable Drug Delivery Formulations Technologies
Injectable Drug Delivery Devices Technologies Market, By Product
- Conventional Injection Devices
- By Materials
- Glass
- Plastics
- By Product
- Fillable Syringes
- Prefilled Syringes
- By Usability
- Reusable
- Disposable
- By Materials
- Self-Injection Devices
- Needle Free Injectors
- By Product
- Fillable Syringes
- Prefilled Syringes
- By Technology
- Jet-based Needle Free Injectors
- Spring-based Needle Free Injectors
- Laser Powered Needle Free Injectors
- Others
- By Usability
- Reusable
- Disposable
- By Product
- Auto Injectors
- By Product
- Fillable Syringes
- Prefilled Syringes
- By Technology
- Manual Injection Auto Injectors
- Automated Injection Auto Injectors
- By Design
- Standardized Auto Injectors
- Customized Auto Injectors
- By Usability
- Reusable
- Disposable
- By Product
- Pen Injectors
- By Product
- Single Chambered Pen Injectors
- Dual Chambered Pen Injectors
- By design
- Standardized pen injectors
- Customized pen injectors
- By usability
- Reusable
- Disposable
- By Product
- Needle Free Injectors
- Others (blunt needle, micro needle, and nano needle injections)
Injectable Drug Delivery Formulations Technologies, By Product
- Conventional Drug Delivery Formulation
- Solution
- Reconstituted / Lyophilized Formulation
- Novel Drug Delivery Formulation
- Liposomal Systems
- Microspheres
- Nanoparticles
- Polymeric Micelles
- Others (dendrimers, nanosponge, and nanoemulsions)
Injectable Drug Delivery Technologies Market, B y Therapeutic Applications
- Auto Immune Diseases
- Multiple Sclerosis
- Rheumatoid Arthritis
- Crohn's Diseases
- Psoriasis
- Others
- Hormonal Disorders
- Diabetes
- Antithrombotic/Thrombolytic Therapy
- Reproductive Health Diseases
- Anemia
- Osteoporosis
- Others
- Orphan Diseases
- Oncology
- Others
- Pain Management
- Allergies
- Hepatitis C
- Aesthetic Treatment
Customer Interested in this report also can view
-
Injectable Drug Delivery Market by Formulations [Liposomes, Microspheres, & Nanoparticles], Devices [Disposables & Reusable, Fillable & Prefilled, Pen, Needle Free & Auto Injectors] & Therapeutics [Diabetes & Oncology] - Global Forecasts to 2017
-
European Injectable Drug Delivery Market - Forecasts to 2017 By Formulations [Liposomes, Microspheres, & Nanoparticles], Devices [Disposables & Reusable, Fillable & Prefilled, Pen, Needle Free & Auto Injectors] & Therapeutics [Diabetes & Oncology] - Forecasts to 2017
Injectable drug delivery technologies are the combination of two major segments; devices and formulations. The injectable drug delivery formulation technologies segment accounted for the largest share of the overall injection drug delivery technologies market and is expected to grow at a CAGR of 14.6% from 2012 to 2017. This is due to surge of biologics and development of nanotechnologies. Based on product, the injectable drug delivery devices technologies market is further categorized into conventional injection devices, self injection devices, and others (microneedles, nanoneedles and blunt needle injections), while injectable drug delivery formulation technologies market is categorized into conventional drug delivery formulations and novel drug delivery formulations. Conventional injection devices segment accounted for the largest share of the overall injectable drug delivery technologies market in 2012.
In addition, the market is segmented on the basis of its therapeutic applications. In therapeutic area, hormonal disorders command the major share of injectable drug delivery technologies market due to high demand of injectables in treatment of diabetes. However, auto-immune diseases are the fastest growing segment of this market due to the advent of biologics (tumor necrosis factor (TNF) and Interleukin 1 (IL-1)) and improving patient compliance by the development of self injection devices.
The North American injectable drug delivery technologies market was valued at $9.3 billion in 2012 and is estimated to grow at a CAGR of 12.3% from 2012 to 2017 to reach $16.6 billion by 2017. The growth of the injectable drug delivery technologies market is driven by factors such as innovations in injectable drug delivery devices, rising prevalence of diabetes in the U.S. and Canada, improving patient compliance and rise in partnerships, collaborations and acquisitions among prominent players in this market. However, factors such as product recalls, regulatory hurdles for approval of new device sand formulations and needle-stick injuries and infections, are restraining the growth of the market.
INJECTABLE DRUG DELIVERY TECHNOLOGIES MARKET, BY COUNTRY, 2012 - 2017
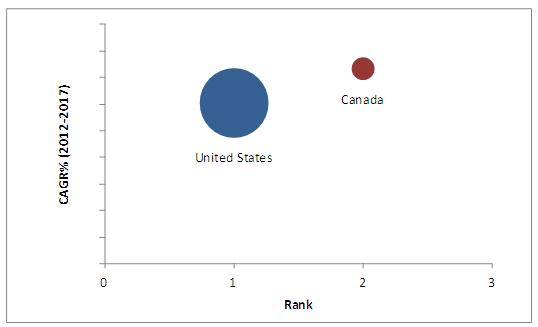
Source: Annual Reports, SEC Filings, Press Releases, Investor Presentations, Expert Interviews, MnM Analysis
The U.S. dominated the North American injectable drug delivery technologies market followed by Canada in 2012. The advancement of injectable devices and formulation has been driving the market in North America. Rising prevalence of chronic diseases in the U.S. as well as Canada forms important accelerator for injectable drug delivery devices technologies.
Table Of Contents
1 Introduction (Page No. - 22)
1.1 Key Take-Aways
1.2 Report Description
1.3 Markets Covered
1.4 Stakeholders
1.5 Research Methodology
1.5.1 Market Size
1.5.2 Market Share
1.5.3 Key Data Points From Secondary Sources
1.5.4 Key Data Points From Primary Sources
1.5.5 Assumptions
2 Executive Summary (Page No. - 30)
3 Market Overview (Page No. - 35)
3.1 Introduction
3.2 Market Segmentation
3.3 Market Dynamics
3.4 Drivers
3.4.1 Innovations In Injectable Drug Delivery Devices
3.4.2 Surge Of Biologics
3.4.3 Rising Prevalence Of Diabetes In The U.S. And Canada
3.4.4 Improvement In Patient Compliance
3.4.5 Incessant Rise In Partnerships, Collaborations And Acquisitions
3.5 Restraints
3.5.1 Product Recalls
3.5.2 Stringent Regulatory Systems
3.5.3 Needle-Stick Injuries And Infections
3.6 Opportunities
3.6.1 Development Of Biosimilars
3.6.2 Advancements In Nanotechnology And Others
3.7 Challenges
3.7.1 Sustainability Of Players In Highly Competitive Market
3.8 Market Share Analysis, By Major Players
3.8.1 Injectable Drug Delivery Devices
4 Injectable Drug Delivery Devices Technologies Market (Page No. - 56)
4.1 Introduction
4.2 Market Segmentation
4.3 Manufacturers Criteria For Selection Of An Injectable Device
4.4 Conventional Injectable Drug Delivery Devices
4.4.1 By Usability
4.4.1.1 Disposable
4.4.1.2 Reusable
4.4.2 By Material
4.4.2.1 Glass
4.4.2.2 Plastic
4.4.3 By Product
4.4.3.1 Prefilled
4.4.3.2 Fillable
4.5 Self-Injection Devices
4.5.1 Market Segmentation
4.5.2 Selection Criteria For Self-Injection Device
4.5.3 Pen Injectors
4.5.3.1 By Product
4.5.3.1.1 Single Chamber Pen Injectors
4.5.3.1.2 Dual Chamber Pen Injectors
4.5.3.2 By Usability
4.5.3.2.1 Disposable Pen Injectors
4.5.3.2.2 Reusable Pen Injectors
4.5.3.3 By Design
4.5.3.3.1 Standard Pen Injectors
4.5.3.3.2 Customized Pen Injectors
4.5.4 Needle-Free Injectors
4.5.4.1 By Product
4.5.4.1.1 Prefilled Needle Free Injectors
4.5.4.1.2 Fillable Needle Free Injectors
4.5.4.2 By Technology
4.5.4.2.1 Jet-Based Needle-Free Injectors
4.5.4.2.2 Spring-Based Needle-Free Injectors
4.5.4.2.3 Laser-Based Needle Free Injectors
4.5.4.2.4 Vibration-Based Needle Free Injectors
4.5.4.3 By Usability
4.5.4.3.1 Disposable
4.5.4.3.2 Reusable
4.5.5 Auto Injectors
4.5.5.1 By Product
4.5.5.1.1 Prefilled Auto Injectors
4.5.5.1.2 Fillable Auto Injectors
4.5.5.2 By Technology
4.5.5.2.1 Automated Auto Injectors
4.5.5.2.2 Manual Auto Injectors
4.5.5.3 By Design
4.5.5.3.1 Standardized Auto Injectors
4.5.5.3.2 Customized Auto Injectors
4.5.5.4 By Usability
4.5.5.4.1 Disposable Auto Injectors
4.5.5.4.2 Reusable Auto Injectors
4.6 Others
5 Injectable Drug Delivery Formulation Technologies Market (Page No. - 123)
5.1 Introduction
5.2 Conventional Drug Delivery
5.2.1 Injectable Solutions
5.2.2 Reconstituted/Lyophilized Formulations
5.3 Novel Drug Delivery Formulation Technologies
5.3.1 Market Segmentation
5.3.2 Liposomal Systems
5.3.3 Microspheres
5.3.4 Nanoparticles
5.3.5 Polymeric Micelles
5.3.6 Others
6 Injectable Drug Delivery Technologies Market,By Therapeutic Applications (Page No. - 146)
6.1 Introduction
6.2 Auto-Immune Diseases
6.2.1 Multiple Sclerosis
6.2.2 Rheumatoid Arthritis
6.2.3 Crohn's Disease
6.2.4 Psoriasis
6.2.5 Others
6.3 Hormonal Disorders
6.3.1 Diabetes
6.3.2 Anemia
6.3.3 Reproductive Health Diseases
6.3.4 Antithrombotic/Thrombolytic Therapy
6.3.5 Osteoporosis
6.3.6 Growth Hormone Deficiency
6.4 Orphan/Rare Diseases
6.5 Oncology
6.6 Others
6.6.1 Pain Management
6.6.2 Hepatitis C
6.6.3 Allergies
6.6.4 Aesthetic Treatment
7 Geographic Analysis (Page No. - 184)
7.1 Introduction
7.1.1 U.S.
7.1.1.1 Product Innovation Stimulating The Growth Of Injectable Drug Delivery Devices In U.S.
7.1.1.2 Incessant Rise In Number Of Diseases Requiring Injectable Drug Delivery-Based Treatment In U.S.
7.1.2 Canada
7.1.2.1 Rise In Number Of Approvals Of Injectable Drug Delivery Devices
7.1.2.2 Canadian Market Impacted Due To Shortage Of Injectable Drugs
7.1.2.3 Insurance Coverage Favoring The Growth Of Canadian Injectable Drug Delivery Technology Market
8 Competitive Landscape (Page No. - 199)
8.1 Introduction
8.2 Agreements, Partnerships, Collaborations & Joint Ventures 203
8.3 New Product Launch
8.4 Expansion
8.5 Mergers & Acquisitions
8.6 Other Developments
8.7 Approvals
9 Company Profiles (Overview, Financials, Products & Services, Strategy, & Developments)* (Page No. - 219)
9.1 Antares Pharma, Inc.
9.2 Baxter International, Inc.
9.3 Becton, Dickinson And Company
9.4 Eli Lilly And Company
9.5 Hospira, Inc.
9.6 Novo Nordisk A/S
9.7 Sanofi
9.8 Unilife Corporation
9.9 West Pharmaceutical Services, Inc.
9.1 Zogenix, Inc.
*Details On Financials, Product & Services, Strategy, & Developments Might Not Be Captured In Case Of Unlisted Companies.
List Of Tables (130 Tables)
Table 1 North America: Injection Drug Delivery Technologies Market, By Segment, 2010 � 2017 ($Million)
Table 2 North America: Injection Drug Delivery Technologies Market, By Segment, 2010 � 2017 ($Million)
Table 3 North America: Injection Drug Delivery Technologies Market, By Country, 2010 � 2017 ($Million)
Table 4 North America: Injectable Drug Delivery Devices Technologies Market, By Product, 2010 � 2017 ($Million)
Table 5 North America: Injection Drug Delivery Devices Technologies Market, By Country, 2010 � 2017 ($Million)
Table 6 North America: Conventional Injectable Drug Delivery Devices Market, By Country, 2010 � 2017 ($Million)
Table 7 North America: Conventional Injection Devices Market,By Usability, 2010 � 2017 ($Million)
Table 8 Disposable Conventional Devices Market, By Country,2010 � 2017 ($Million)
Table 9 Reusable Conventional Devices Market, By Country,2010 � 2017 ($Million)
Table 10 North American Conventional Injection Devices Market,By Material, 2010 � 2017 ($Million)
Table 11 Conventional Injection Devices (Glass) Market, By Country, 2010 � 2017 ($Million)
Table 12 Conventional Injection Devices (Plastic) Market, By Country, 2010 � 2017 ($Million)
Table 13 North America: Conventional Injection Devices Market,By Product, 2010 � 2017 ($Million)
Table 14 North America: Prefilled Conventional Injection Devices Market, By Country, 2010 � 2017 ($Million)
Table 15 North America: Fillable Conventional Injection Devices Market, By Country, 2010 � 2017 ($Million)
Table 16 North America: Self-Injection Devices Market, By Product, 2010 � 2017 ($Million)
Table 17 North America: Self-Injection Devices Market, By Country, 2010 � 2017 ($Million)
Table 18 North America: Pen Injectors Market, By Product,2010 � 2017 ($Million)
Table 19 North America: Single Chamber Pen Injector Market,By Country, 2010 � 2017 ($Million)
Table 20 North America: Dual Chamber Pen Injector Market,By Country, 2010 � 2017 ($Million)
Table 21 North America: Pen Injectors Market, By Usability,2010 � 2017 ($Million)
Table 22 North America: Disposable Pen Injectors Market, By Country, 2010 � 2017 ($Million)
Table 23 North America: Reusable Pen Injectors Market, By Country, 2010 � 2017 ($Million)
Table 24 North America: Pen Injectors Market, By Design,2010 � 2017 ($Million) 90
Table 25 North America: Standard Pen Injectors Market, By Country, 2010 � 2017 ($Million)
Table 26 North America: Customized Pen Injectors Market,By Country, 2010 � 2017 ($Million)
Table 27 North American Needle Free Injectors Market, By Product, 2010 � 2017 ($Million)
Table 28 North America: Prefilled Needle Free Injectors Market,By Country, 2010 � 2017 ($Million)
Table 29 North America: Fillable Needle Free Injectors Market,By Country, 2010 � 2017 ($Million)
Table 30 North America: Needle Free Injectors Market, By Technology, 2010 � 2017 ($Million)
Table 31 North America: Jet-Based Needle Free Injector Market,By Country, 2010 � 2017 ($Million)
Table 32 North America: Spring-Based Needle Free Injector Market,By Country, 2010 � 2017 ($Million)
Table 33 North America: Laser-Powered Needle Free Injector Market, By Country, 2010 � 2017 ($Million)
Table 34 North America: Vibration-Based Needle Free Injector Market, By Country, 2010 � 2017 ($Million)
Table 35 North America: Needle Free Injectors Market, By Usability, 2010 � 2017 ($Million)
Table 36 North America: Disposable Needle Free Injectors Market,By Country, 2010 � 2017 ($Million)
Table 37 North America: Reusable Needle Free Injectors Market,By Country, 2010 � 2017 ($Million)
Table 38 North America: Auto Injectors Market, By Product,2010 � 2017 ($Million) 109
Table 39 North America: Prefilled Auto Injectors Market, By Country, 2010 � 2017 ($Million)
Table 40 North America: Fillable Auto Injectors Market, By Country, 2010 � 2017 ($Million)
Table 41 North America: Auto Injectors Market, By Technology,2010 � 2017 ($Million) 112
Table 42 North America: Manual Auto Injectors Market, By Country, 2010 � 2017 ($Million)
Table 43 North America: Auto Injectors Market, By Design,2010 � 2017 ($Million) 115
Table 44 North America: Standardized Auto Injectors Market,By Country, 2010 � 2017 ($Million)
Table 45 North America: Customized Auto Injectors Market,By Country, 2010 � 2017 ($Million)
Table 46 North America: Auto Injectors Market, By Usability,2010 � 2017 ($Million)
Table 47 North America: Disposable Auto Injectors Market,By Country, 2010 � 2017 ($Million)
Table 48 North America: Reusable Auto Injectors Market, By Country, 2010 � 2017 ($Million)
Table 49 North America: Others Injectors Market, By Country,2010 � 2017 ($Million)
Table 50 North America: Injectable Drug Delivery Formulation Technologies Market, By Segment, 2010 � 2017 ($Million)
Table 51 North America: Injectable Drug Delivery Formulation Technologies Market, By Country, 2010 � 2017 ($Million)
Table 52 North America: Conventional Drug Delivery Formulation Technologies Market, 2010 � 2017 ($Million)
Table 53 North America: Conventional Drug Delivery Formulation Technologies Market, By Country, 2010 � 2017 ($Million)
Table 54 North America: Injectable Solutions Conventional Drug Delivery Formulation Market, By Country,2010 � 2017 ($Million)
Table 55 North America: Reconstituted/Lyophilized Conventional Drug Delivery Formulation Market, By Country,2010 � 2017 ($Million)
Table 56 North America: Novel Drug Delivery Formulation Technologies Market, 2010 � 2017 ($Million)
Table 57 North America: Novel Drug Delivery Formulation Technologies Market, By Country, 2010 � 2017 ($Million)
Table 58 North America: Liposome Drug Delivery Formulation Market, By Country, 2010 � 2017 ($Million)
Table 59 North America: Microspheres Drug Delivery Formulation Market, By Country, 2010 � 2017 ($Million)
Table 60 North America: Nanoparticles Drug Delivery Formulation Market, By Country, 2010 � 2017 ($Million)
Table 61 North America: Polymeric Micelles Drug Delivery Formulation Market, By Country, 2010 � 2017 ($Million)
Table 62 North America: Others Novel Drug Delivery Formulation Market, By Country, 2010 � 2017 ($Million)
Table 63 North American Injectable Drug Delivery Technologies Market, By Therapeutic Applications, 2010 � 2017 ($Million)
Table 64 North America: Auto Immune Therapeutics Market,By Indication, 2010 � 2017 ($Million)
Table 65 North America: Auto Immune Therapeutics Market,By Country, 2010 � 2017 ($Million)
Table 66 North America: Multiple Sclerosis Market, By Country,2010 � 2017 ($Million)
Table 67 North America: Rheumatoid Arthritis Market, By Country, 2010 � 2017 ($Million)
Table 68 North America: Crohn's Disease Market, By Country,2010 � 2017 ($Million)
Table 69 Psoriasis Market, By Country, 2010 � 2017 ($Million)
Table 70 North America: Other Auto Immune Disease Market,By Country, 2010 � 2017 ($Million)
Table 71 North America: Hormonal Disorders Market, By Indication, 2010 � 2017 ($Million)
Table 72 North America:Hormonal Disorders Market, By Country,2010 � 2017($Million)
Table 73 North America: Diabetes Market, By Country,2010 � 2017 ($Million)
Table 74 North America: Anemia Market, By Country,2010 � 2017 ($Million)
Table 75 North America: Reproductive Health Disease Market,By Country, 2010 � 2017($Million)
Table 76 North America: Antithrombotic Therapy Market, By Country, 2010 � 2017 ($Million)
Table 77 North America: Osteoporosis Market, By Country,2010 � 2017($Million)
Table 78 North America: Growth Hormone Deficiency Market,By Country, 2010 � 2017 ($Million)
Table 79 North America: Orphan/Rare Disease Market, By Country, 2010 � 2017 ($Million)
Table 80 North America: Oncology Market, By Country,2010 � 2017 ($Million)
Table 81 North America: Other Therapeutic Market, By Indication, 2010 � 2017 ($Million)
Table 82 North America: Other Therapeutic Market, By Country,2010 � 2017 ($Million)
Table 83 North America: Pain Management Market, By Country,2010 � 2017 ($Million)
Table 84 North America: Hepatitis C Market, By Country,2010 � 2017 ($Million)
Table 85 North America: Allergies/Anaphylytic Shock Market,By Country, 2010 � 2017 ($Million)
Table 86 North America: Aesthetic Treatment Market, By Country,2010 � 2017 ($Million)
Table 87 North America: Injectable Drug Delivery Technologies Market, By Country, 2010 � 2017 ($Million)
Table 88 United States: Injectable Drug Delivery Technologies Market, By Segment, 2010 � 2017 ($Million)
Table 89 United States: Injectable Drug Delivery Technologies Market, By Product, 2010 � 2017 ($Million)
Table 90 United States: Injectable Drug Delivery Formulation Technologies Market, By Product, 2010 � 2017($Million)
Table 91 United States: Injectable Drug Delivery Technologies Market, By Therapeutic Application, 2010 � 2017 ($Million)
Table 92 Canada: Injectable Drug Delivery Technologies Market,By Type, 2010 � 2017 ($Million)
Table 93 Canada: Injectable Drug Delivery Technologies Market,By Product, 2010 � 2017 ($Million)
Table 94 Canada: Injectable Drug Delivery Formulation Technologies Market, By Segment, 2010 � 2017 ($Million)
Table 95 Canada: Injectable Drug Delivery Technologies Market,By Therapeutic Application, 2010 � 2017 ($Million)
Table 96 Agreements, Partnerships, Collaborations & Joint Ventures, 2010 � 2013
Table 97 New Product Launch, 2010 � 2013
Table 98 Expansion, 2010 � 2012
Table 99 Mergers & Acquisitions, 2010 � 2013
Table 100 Others, 2010 � 2013
Table 101 Approvals, 2010 � 2013
Table 102 Antares Pharma: Total Revenues And R&D Expenditure,2010 � 2012 ($Million)
Table 103 Antares Pharma: Total Revenue, By Product,2010 � 2012 ($Million)
Table 104 Antares Pharma: Total Revenue, By Geography,2010 � 2012 ($Million)
Table 105 Baxter International: Total Revenue And R&D Expenses,2010 � 2012 ($Million)
Table 106 Baxter International: Total Revenue, By Segment,2010 � 2012 ($Million)
Table 107 Baxter International: Medical Products Total Revenue,2010 � 2012($Million)
Table 108 Baxter International: Total Revenue, By Geography,2010 � 2012 ($Million)
Table 109 Becton Dickinson: Total Revenue And R&D Expenditure,2010 � 2012 ($Million)
Table 110 Becton Dickinson: Total Revenue, By Segment,2010 � 2012 ($Million)
Table 111 Becton Dickinson: Medical Division Total Revenue,2010 � 2012($Million)
Table 112 Becton Dickinson: Total Revenue, By Geography,2010� 2012($Million)
Table 113 Eli Lilly & Co: Total Revenue And R&D Expenses,2010 � 2012 ($Billion)
Table 114 Eli Lilly & Co: Total Revenue, By Segment,2010 � 2012 ($Billion)
Table 115 Eli Lilly & Co: Total Revenue By Geography,2010 � 2012 ($Billion)
Table 116 Hospira, Inc.: Total Revenue And R&D Expenditure,2009 � 2011 ($Million)
Table 117 Hospira, Inc.: Total Revenue, By Geography,2009 � 2011 ($Million)
Table 118 Hospira, Inc.: Total Revenue, By Segment,2009 � 2011($Million)
Table 119 Novo Nordisk: Total Revenue And R&D Expenses,2010 � 2012 ($Billion)
Table 120 Novo Nordisk: Total Revenue, By Segment,2010 � 2012($Billion)
Table 121 Novo Nordisk: Total Revenue, By Geography,2010 � 2012 ($Billion)
Table 122 Sanofi: Total Revenue & R&D Expenditure,2009 � 2012 ($Billion)
Table 123 Sanofi: Total Revenue, By Segment, 2009 � 2012 ($Billion)
Table 124 Sanofi: Total Revenue, By Geography, 2009 � 2012 ($Billion)
Table 125 Unilife Corporation: Total Revenue And Expenditure,2009 � 2011 ($Million)
Table 126 Unilife Corporation: Total Revenue, By Geography,2009 � 2011 ($Million)
Table 127 West Pharma: Total Revenues And R&D Expenses,2009 � 2012 ($Million)
Table 128 West Pharma: Total Revenue, By Segment,2009 � 2012 ($Million)
Table 129 West Pharma: Total Revenue, By Geography,2009 � 2012 ($Million)
Table 130 Zogenix, Inc.: Total Revenue And R&D Expenditure,2010 � 2012 ($Million)
List Of Figures (28 Figures)
Figure 1 North America: Injectable Drug Delivery Technologies Market
Figure 2 North America: Injectable Drug Delivery Technologies Market, By Country, 2012 � 2017
Figure 3 Injectable Drug Delivery Technologies Market Segmentation
Figure 4 Market Segmentation Of Injectable Drug Delivery Technologies
Figure 5 Market Segmentation Of Injectable Drug Delivery Technologies, By Therapeutic Application
Figure 6 Injectable Drug Delivery Technologies Market Dynamics
Figure 7 North America: Injectable Drug Delivery Devices Market,By Key Players, 2012 52
Figure 8 Injectable Drug Delivery Devices Technologies Market Segmentation
Figure 9 Factors Affecting Selection Of An Injectable Device
Figure 10 North America: Self-Injection Devices Market, By Product, 2010 � 2017 ($Million)
Figure 11 Self-Injection Devices Market Segmentation
Figure 12 Factors Affecting Selection Of Self-Injection Device
Figure 13 North America: Pen Injector Product Market, By Country, 2010 � 2017 ($Million)
Figure 14 North America: Needle Free Injectors Product Market,By Country, 2010 � 2017 ($Million)
Figure 15 North America: Auto Injectors Products Market, By Country, 2010 � 2017 ($Million)
Figure 16 North America: Automated Auto Injectors Market,By Country, 2010 � 2017 ($Million)
Figure 17 North America: Conventional Drug Delivery Formulation Technologies Market Segmentation
Figure 18 North America: Conventional Drug Delivery Formulation Technologies Market
Figure 19 North America: Novel Drug Delivery Formulation Technologies Market
Figure 20 North America: Novel Drug Delivery Formulation Technologies Segmentation
Figure 21 North America: Injectable Drug Delivery Technologies Market, By Therapeutic Applications, 2010 � 2017 ($Million)
Figure 22 Injectable Drug Delivery Therapeutics Market Segmentation
Figure 23 Auto-Immune Therapeutics Market Segmentation
Figure 24 Hormonal Disorders Market Segmentation
Figure 25 Key Growth Strategies, 2010 � 2013
Figure 26 Key Players Focusing On Agreements, Partnerships, Collaborations And Joint Ventures Strategy, 2010 � 2013
Figure 27 Key Players Focusing On New Product Launch Strategy,2010 � 2013 201
Figure 28 Key Players Focusing On Expansion, 2010 � 2013

 Generating Response ...


Growth opportunities and latent adjacency in North America Injectable Drug Delivery Market