Light Duty Vehicle Market for North America by Key OEM & Model, Engine Capacity, Fuel, Turbocharger, Transmission, Aftertreatment Devices, Steering & Safety System, RVD, ADAS and Country, & Vehicle Type (Passenger Car, Light Trucks & AFV) - Forecast to 2021


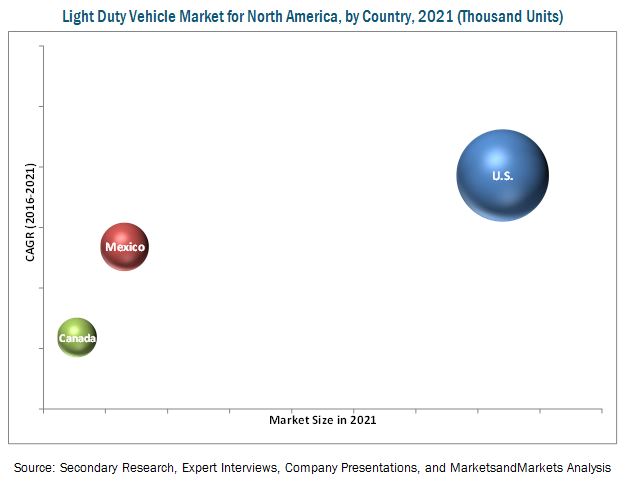
[222 Pages Report] The North American light duty vehicle production is driven by the U.S., which accounts for 67.5% of the total North America light duty vehicle production in terms of volume. Stringent emission regulations leading to light weighting/engine downsizing has also fueled the growth of light duty vehicles in the region. The light duty vehicle market for North America is projected to grow at a CAGR of 5.65% during the forecast period, to reach 24540.0 thousand units by 2021, from an estimated 18647.1 thousand units in 2016. The base year for the report is 2015 and the forecast year is 2021.
The objective of the study is to analyze and forecast (2013 to 2021) the North American light duty vehicle market by volume (‘000 units) and by country. The report segments the market By Key OEM & Model, Engine Capacity, Fuel, Turbocharger, Transmission, After treatment Devices, Steering & Safety System, RVD, ADAS, and Country & Vehicle Type (Passenger Car, Light Trucks & AFV). A detailed study of various market leaders has been done and opportunity analysis has been provided in the report.
Various secondary sources, such as company annual reports/presentations, press releases, industry association publications, automotive magazine articles, encyclopedias, directories, technical handbooks, world economic outlook, trade websites, technical articles, and databases have been used to identify and collect information useful for an extensive study of the North American light duty vehicle market. The primary sources experts from related industries, automobile OEMs, and turbocharger manufacturer–have been interviewed to obtain and verify critical information, as well as to assess future prospects and market estimations. Bottom-up approach has been used for market estimation and calculating the North American light duty vehicle market size.
The figure given below illustrates the break-up of the profile of industry experts who participated in primary discussions.
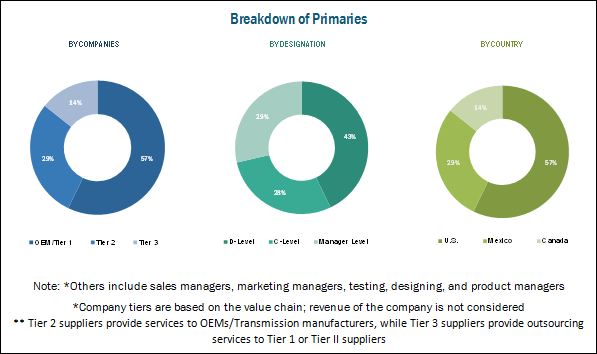
To know about the assumptions considered for the study, download the pdf brochure
The North American light duty vehicles ecosystem consists of various major manufacturers such as General Motors (U.S.), Ford Motor Company (U.S.), Honda Motor (Japan), Hyundai Motors (South Korea), and Fiat Chrysler Automobiles (U.K.), and Toyota Motor Corporation (Japan).
Target Audience
- Automotive OEMs
- Automotive engine manufacturers
- Automotive turbocharger manufacturers
- Automotive transmission manufacturers
Get online access to the report on the World's First Market Intelligence Cloud
Request Sample Scope of the Report

-
By Country
- U.S.
- Mexico
- Canada
-
By Key OEM and Model
- Ford Motor
- Chevrolet
- Toyota
- Honda
- GMC
-
By Transmission Type
- Automatic transmission ( AT )
- Continuous variable transmission ( CVT )
- Manual transmission ( MT )
- Others*
-
By Turbocharger
- Gasoline Turbocharged
- Diesel Turbocharged
-
By Engine Capacity
- 1.8 L
- 2 L
- 2.4 L
- 2.5 L
- 3.5 L
- 3.6 L
- 6.2 L
- Others
-
By Vehicle Segment
- Passenger Car
- Light Trucks
-
By Fuel Type
- Gasoline
- Diesel
- Others (CNG, Electric)
Available Customizations
- Light Duty Vehicle Market for North America, By Engine Architecture
The light duty vehicle market for North America is projected to grow at a CAGR of 5.65% during the forecast period, to reach 24540.0 thousand units by 2021, from an estimated 18647.1 thousand units in 2016. The base year for the report is 2015 and the forecast year is 2021.
The increasing demand for light duty vehicles in North America, stringent emission regulations leading to light weighting/engine downsizing, and infrastructure growth has led to an increase in passenger car production in North America.
The North American passenger car production market is dominated by the two major domestic players: The Ford Motor Company and Chevrolet, a division of General Motors (GM). The Japanese player such as Toyota and Honda also hold a considerable market share. The Ford F-series, Chevrolet Silverado, GM Sierra and the Honda CR-V are the best-selling models of their respective companies
The turbocharged vehicle segment is estimated be the fastest growing during the forecast period. With the increased focus on fuel efficiency and emission norms, a majority of the car OEMs are focusing on small sized vehicles along with downsizing larger engines with the help of turbocharger technology in order to provide better fuel efficiency.
The North American passenger car market is favorable for gasoline vehicles, but it has started moving towards diesel and hybrid vehicles. The U.S. government is taking steps to promote electric vehicles (EVs), and plans to introduce 48 electric charging corridors which will cover 25,000 miles of highways.
The CVT transmission segment is the fastest growing transmission type used in passenger cars. This escalated growth can be attributed to the elevated demand for fuel efficient vehicles and as an alternative to automatic transmissions which increase costs.
Advancement in technology has led to improved fuel economy of vehicles which has prompted customers to purchase light duty vehicles. Electric pick-up trucks are also becoming a key trend in this region. The light truck segment is estimated to dominate the Mexican light duty vehicle production market in terms of growth rate
The U.S. has the largest market share in the North American light duty vehicle segment however, Mexico is also gaining traction due to lower manufacturing cost owing to low manpower cost and favorable government policies
The major restraints considered in the study includes is the increasing average age of light duty vehicles. The average age of a light duty vehicle in North America is around 11–12 years which is a restraint for the OE market in North America. The increasing trend of shared mobility is another restraint for light duty vehicle manufacturers. The light duty vehicle market for North America is dominated by many international as well as domestic players, and some of them are General Motors (U.S.), Ford Motor Company (U.S.), Toyota Motor Corporation (Japan), Fiat Chrysler Automobiles (U.K.).
To speak to our analyst for a discussion on the above findings, click Speak to Analyst
Table of Contents
1 Introduction
1.1 Objectives of the Study
1.2 Markets Covered
1.3 Stakeholders
1.4 Markets Definition
1.5 Market Scope
1.5.1 Markets Covered
1.5.2 Years Considered in the Report
1.6 Currency & Pricing
1.7 Limitation
1.8 Stakeholders
2 Research Methodology
2.1 Research Data
2.2 Secondary Data
2.2.1 Key Data From Secondary Sources
2.3 Primary Data
2.3.1 Primary Participants
2.4 Factor Analysis
2.4.1 Introduction
2.4.2 Demand Side Analysis
2.4.3 Supply Side Analysis
2.5 Market Estimation
2.5.1 Bottom-Up Approach
2.5.2 Data Triangulation
2.5.3 Assumptions
3 Executive Summary
4 Market Overview
4.1 Introduction
4.2 Market Segmentation
4.3 Market Dynamics
4.3.1 Drivers
4.3.2 Restraints
4.3.3 Opportunities
4.3.4 Challenges
5 Light Duty Vehicle Outlook for North America, By Key Oem & Models (2013-2015)
5.1 Introduction
5.2 Ford Top 5 Models Production
5.3 Chevrolet Top 5 Models Production
5.4 Toyota Top 5 Models Production
5.5 Honda Top 5 Models Production
5.6 Gmc Top 5 Models Production
6 Light Duty Vehicle Outlook for North America, By Engine Capacity (2013-2015)
6.1 Introduction
6.2 1.8 L, By Coutry Level Production
6.3 2 L, By Coutry Level Production
6.4 2.4 L, By Coutry Level Production
6.5 2.5 L, By Coutry Level Production
6.6 3.5 L, By Coutry Level Production
6.7 3.6 L, By Coutry Level Production
6.8 6.2 L, By Coutry Level Production
6.9 Others, By Coutry Level Production
7 Light Duty Vehicle Outlook for North America, By Turbocharged Engines (2013-2021)
7.1 Introduction
7.2 Gasolone Turbocharged, By Coutry Level Production
7.3 Diesel Turbocharged, By Coutry Level Production
8 Light Duty Vehicle Outlook for North America, By Fuel Type (2013-2021)
8.1 Introduction
8.2 Gasolone, By Coutry Level Production
8.3 Diesel, By Coutry Level Production
8.4 Others, By Coutry Level Production
9 Light Duty Vehicle Outlook for North America, By Trnsmission Type (2013-2021)
9.1 Introduction
9.2 Automatic Transmission (AT), By Coutry Level Production
9.3 Manual Transmission (MT), By Coutry Level Production
9.4 Continuous Variable Transmission (CVT), By Coutry Level Production
9.5 Others, By Coutry Level Production
10 Light Duty Vehicle Outlook for North America, By Country & Vehicle Type (2013-2021)
10.1 Introduction
10.2 U.S. Market, By Vehicle Type
10.3 Canada Market, By Vehicle Type
10.4 Mexico Market, By Vehicle Type
11 Light Duty Vehicle Outlook for North America, Other Key Thechnologies
11.1 Introduction
11.2 Aftertreatment Devices, By Device Type
11.3 Steering & Safety System, By Country & Technology
11.4 Rvd, By Coutry & Engine Type
11.5 Adas, By Coutry & Key Technology
11.6 Alternate Fuel Vehicle Sales, By Coutry & Type
11.7 Vehicle Electrification, By Key Technology
12 Competitve Landscape
12.1 Overview
12.2 Competitve Situation and Trends
12.3 New Product Launches
12.4 Expansions
12.5 Mergers & Acquisitons and Other Developments
12.6 Agreements/Joint Ventures/Supply Contracts/Partnerships
13 Company Profiles
(Company at A Glance, Recent Financials, Products & Services, Strategies & Insights, & Recent Developments)*
13.1 Introduction
13.2 General Motors
13.3 Ford Motor Company Company
13.4 Toyota Motor Corporation
13.5 Fiat Chrysler Automobiles
13.6 Honda Motor
13.7 Diamler AG
13.8 BMW
13.9 Fuji Heavy Industries
13.10 Nissan Motor Corporation
13.11 Hyundai Motors
*Details on Company at A Glance, Recent Financials, Products & Services, Strategies & Insights, & Recent Developments Might Not Be Captured in Case of Unlisted Companies.
14 Appendix
14.1 Insights of Industry Experts
14.2 Discussion Guide
14.3 Available Customizations
14.3.1 Light Duty Vehicle Market for North America, By Engine Architecture
14.3.1.1 Introduction
14.3.1.2 I4 Type, By Coutry Level Production
14.3.1.3 V6 Type, By Coutry Level Production
14.3.1.4 V8 Type, By Coutry Level Production
14.3.1.5 Others, By Coutry Level Production
14.4 Related Reports
List of Tables (57 Tables)
Table 1 Weight Reduction Strategies Followed to Achieve Cafe Targets
Table 2 Top 5 OEMS in North America 2013–2015, (‘000 Units)
Table 3 Top 5 Ford Models in North America 2013–2015 (‘000 Units)
Table 4 Top 5 Chevrolet Models in North America 2013–2015, (‘000 Units)
Table 5 Top 5 Toyota Models in North America 2013–2015, (‘000 Units)
Table 6 Top 5 Honda Models in North America 2013–2015, (‘000 Units)
Table 7 Top 5 Gmc Models in North America 2013–2015, (‘000 Units)
Table 8 North America: Passenger Car Production, By Engine Capacity in Litres, 2013–2015 (‘000 Units)
Table 9 United States: Passenger Car Production, By Engine Capacity in Litres, 2013–2015 (‘000 Units)
Table 10 Mexico: Passenger Car Production, By Engine Capacity in Litres 2013–2015 (‘000 Units)
Table 11 Canada: Passenger Car Production, By Engine Capacity in Litres 2013–2015 (‘000 Units)
Table 12 North America: Passenger Car Production, By Turbocharged Engine, 2013–2021 (‘000 Units)
Table 13 U.S.: Passenger Car Production, By Turbocharged Engine, 2013–2021 (‘000 Units)
Table 14 Mexico: Passenger Car Production, By Turbocharged Engine, 2013–2021 (‘000 Units)
Table 15 Canada Passenger Car Production, By Turbocharged Engine, 2013–2021 (‘000 Units)
Table 16 North America: Passenger Car Production, By Fuel Type, 2013–2021 (‘000 Units)
Table 17 U.S.: Passenger Car Production, By Fuel Type, 2013–2021 (‘000 Units)
Table 18 Mexico: Passenger Car Production, By Fuel Type, 2013–2021 (‘000 Units)
Table 19 Canada: Passenger Car Production, By Fuel Type, 2013–2021 (‘000 Units)
Table 20 North America: Passenger Car Production, By Transmission, 2013–2021 (‘000 Units)
Table 21 U.S.: Passenger Car Production, By Transmission, 2013–2021 (‘000 Units)
Table 22 Mexico: Passenger Car Production, By Transmission, 2013–2021 (‘000 Units)
Table 23 Canada: Passenger Car Production, By Transmission, 2013–2021 (‘000 Units)
Table 24 North America: Passenger Car Production, By Country, 2013–2021 (‘000 Units)
Table 25 North America: Passenger Car Production, By Vehicle Type, 2013–2021 (‘000 Units)
Table 26 U.S.: Passenger Car , By Vehicle Type, 2013–2021 (‘000 Units)
Table 27 Mexico: Passenger Car , By Vehicle Type, 2013–2021 (‘000 Units)
Table 28 Canada: Passenger Car, By Vehicle Type, 2013–2021 (‘000 Units)
Table 29 U.S.: Existing & Upcoming Regulation Roadmap for Light Duty Vehicles
Table 30 North America: Vehicle Electrification Market, By Technology, 2014–2021 ('000 Units)
Table 31 North America: Vehicle Electrification Market, By Technology 2014–2021 (USD Million)
Table 32 North America: Alternate Fuel Vehicle Sales, By Country, 2014–2021 ('000 Units)
Table 33 North America: Alternate Fuel Vehicle Sales, By Type, 2014–2021 ('000 Units)
Table 34 North America: Remote Vehicle Diagnostics Market Size, By Country, 2014–2021 (‘000 Units)
Table 35 North America: Remote Vehicle Diagnostics Market Size, By Country, 2014–2021 (USD Million)
Table 36 North America: Remote Vehicle Diagnostics Market Size, By Engine Type, 2014–2021 (‘000 Units)
Table 37 North America: Remote Vehicle Diagnostics Market Size, By Value, By Engine Type, 2014–2021 (USD Million)
Table 38 North America: Adas Market, By Country, 2014–2021 (‘000 Units)
Table 39 North America: Adas Market, By Country, 2014–2021 (USD Million)
Table 40 North America: Adas Market, By Country, 2014–2021 (‘000 Units)
Table 41 North America: Adas Market, By Country, 2014–2021 (USD Million)
Table 42 North America: Passenger Car After Treatment Device Market, 2014–2021 (‘000 Units)
Table 43 North America: Passenger Car After Treatment Device Market 2014–2021 (USD Million)
Table 44 North America: Steering System Market, By Country 2014–2021 (‘000 Units)
Table 45 North America: Steering System Market, By Country 2014–2021 (USD Million)
Table 46 North America: Steering System Market, By Technology, 2014–2021 (‘000 Units)
Table 47 North America: Steering System Market, By Technology, 2014–2021 (‘000 Units)
Table 48 North America: Passenger Car Abs & Esc Market, 2014–2021 (‘000 Units)
Table 49 North America: Passenger Car Abs & Esc Market, 2014–2021 (USD Million)
Table 50 North America: Driver Fatigue Monitoring System Market Size, 2018-2025 (000 Units)
Table 51 North America: Driver Distraction Monitoring System Market Size, 2018-2025 (000 Units)
Table 52 North America: Driver Monitoring Systems Market Size, By Technology, 2018–2025 (‘000 Units)
Table 53 North America: Driver Monitoring Systems Market Size, By Technology, 2018–2025 (USD Million)
Table 54 North America: Airbag Market 2014–2021 (‘000 Units)
Table 55 North America: Airbag Market 2014–2021 (USD Million)
Table 56 North America: Seat Belt Market 2014–2021 (‘000 Units)
Table 57 North America: Seat Belt Market 2014–2021 (USD Million)
List of Figuers (39 Figures)
Figure 1 Gasoline Fuel is Estimated to Hold the Largest Market Size in the North America
Figure 2 Automatic Transmission is Estimated to Hold the Largest Market Size in the North America
Figure 3 Gasoline Turbocharged Light Duty Vehicles are Estimated to Be the Largest Market in North America
Figure 4 Ford is Estimated to Be the Largest Player in the U.S. Market
Figure 5 Light Trucks are Estimated to Hold the Largest Market Size in North America
Figure 6 U.S. is Estimated to Be the Largest Market Size in North America
Figure 7 Light Duty Vehicles With 3.5 Liter Engines are Estimated to Be the Largest Market in North America
Figure 8 Average Age of Light Duty Vehicles in U.S.
Figure 9 Top 5 OEMS in North America 2013–2015, (‘000 Units)
Figure 10 Top 5 OEMS in North America, 2015
Figure 11 Top 5 Ford Models in North America, 2015
Figure 12 Top 5 Chevrolet Models in North America, 2015
Figure 13 Top 5 Toyota Models in North America, 2015
Figure 14 Top 5 Honda Models in North America, 2015
Figure 15 Top 5 Gmc Models in North America, 2015
Figure 16 North America: Passenger Car Production, By Engine Capacity in Litres, 2013–2015 (‘000 Units)
Figure 17 North America: Passenger Car Production, By Turbocharged Engine 2013–2021 (‘000 Units)
Figure 18 North America: Passenger Car Production, By Turbocharged Engine 2016–2021 (‘000 Units)
Figure 19 North America: Passenger Car Production, By Fuel Type, 2013–2021 (‘000 Units)
Figure 20 North America: Passenger Car Production, By Transmission, 2013–2021 (‘000 Units)
Figure 21 North America: Passenger Car Production, By Transmission, 2016–2021 (‘000 Units)
Figure 22 North America: Passenger Car Production, By Country, 2013–2021 (‘000 Units) & Vehicle Type 2015 (‘000 Units)
Figure 23 Country Wise Passenger Car Production
Figure 24 Vehicle Type Wise Passenger Car Production
Figure 25 General Motors Company: Snapshot
Figure 26 General Motors: SWOT Analysis
Figure 27 Ford Motor Company: Company Snapshot
Figure 28 Ford Motor Company: SWOT Analysis
Figure 29 Toyota Motor Corporation : Company Snapshot
Figure 30 Toyota Motor Corporation : SWOT Analysis
Figure 31 Fiat Chrysler Automobiles: Company Snapshot
Figure 32 Fiat Chrysler Automobiles: SWOT Analysis
Figure 33 Honda Motor : Company Snapshot
Figure 34 Honda Motor : SWOT Analysis
Figure 35 Daimler AG: Company Snapshot
Figure 36 BMW: Company Snapshot
Figure 37 Fuji Heavy Industries: Company Snapshot
Figure 38 Nissan Motor Corporation : Company Snapshot
Figure 39 Hyundai Motors : Company Snapshot


Growth opportunities and latent adjacency in Light Duty Vehicle Market